
14.4: Important Examples
- Page ID
- 83471

\( \newcommand{\vecs}[1]{\overset { \scriptstyle \rightharpoonup} {\mathbf{#1}} } \)
\( \newcommand{\vecd}[1]{\overset{-\!-\!\rightharpoonup}{\vphantom{a}\smash {#1}}} \)
\( \newcommand{\id}{\mathrm{id}}\) \( \newcommand{\Span}{\mathrm{span}}\)
( \newcommand{\kernel}{\mathrm{null}\,}\) \( \newcommand{\range}{\mathrm{range}\,}\)
\( \newcommand{\RealPart}{\mathrm{Re}}\) \( \newcommand{\ImaginaryPart}{\mathrm{Im}}\)
\( \newcommand{\Argument}{\mathrm{Arg}}\) \( \newcommand{\norm}[1]{\| #1 \|}\)
\( \newcommand{\inner}[2]{\langle #1, #2 \rangle}\)
\( \newcommand{\Span}{\mathrm{span}}\)
\( \newcommand{\id}{\mathrm{id}}\)
\( \newcommand{\Span}{\mathrm{span}}\)
\( \newcommand{\kernel}{\mathrm{null}\,}\)
\( \newcommand{\range}{\mathrm{range}\,}\)
\( \newcommand{\RealPart}{\mathrm{Re}}\)
\( \newcommand{\ImaginaryPart}{\mathrm{Im}}\)
\( \newcommand{\Argument}{\mathrm{Arg}}\)
\( \newcommand{\norm}[1]{\| #1 \|}\)
\( \newcommand{\inner}[2]{\langle #1, #2 \rangle}\)
\( \newcommand{\Span}{\mathrm{span}}\) \( \newcommand{\AA}{\unicode[.8,0]{x212B}}\)
\( \newcommand{\vectorA}[1]{\vec{#1}} % arrow\)
\( \newcommand{\vectorAt}[1]{\vec{\text{#1}}} % arrow\)
\( \newcommand{\vectorB}[1]{\overset { \scriptstyle \rightharpoonup} {\mathbf{#1}} } \)
\( \newcommand{\vectorC}[1]{\textbf{#1}} \)
\( \newcommand{\vectorD}[1]{\overrightarrow{#1}} \)
\( \newcommand{\vectorDt}[1]{\overrightarrow{\text{#1}}} \)
\( \newcommand{\vectE}[1]{\overset{-\!-\!\rightharpoonup}{\vphantom{a}\smash{\mathbf {#1}}}} \)
\( \newcommand{\vecs}[1]{\overset { \scriptstyle \rightharpoonup} {\mathbf{#1}} } \)
\( \newcommand{\vecd}[1]{\overset{-\!-\!\rightharpoonup}{\vphantom{a}\smash {#1}}} \)
We can use a graph to visualize the power set of a finite set \(A\text{:}\) let \((\mathscr{P}(A),E)\) be the directed graph where, for vertices \(B,C \in \mathscr{P}(A)\) (that is, subsets \(B,C \subseteq A\)), the ordered pair \((B,C)\) is an edge in \(E\) if the following two conditions are satisfied:
\(B \subsetneqq C\text{;}\) and
there does not exist a subset \(D \subseteq A\) such that \(B \subsetneqq D \subsetneqq C\text{.}\)
Note: The second condition is to avoid cluttering the graph with extra edges that do not add any extra information.
For example, consider \(A = \{a,b,c\}\) and
\begin{equation*} \mathscr{P}(A) = \left\{ \, \emptyset, \, \{a\}, \, \{b\}, \, \{c\},\, \{a,b\},\, \{a,c\},\, \{b,c\},\, \{a,b,c\} \, \right\}. \end{equation*}
So we can draw a graph to represent the subset relationships of \(\mathscr{P}(A)\text{,}\) with arrows to point from subset to superset.

It is somewhat natural to draw the graph with the largest subsets of \(A\) at the top (or at the bottom). If we decide that arrows will always point upwards, we can unclutter our graph by just drawing lines instead of arrows for edges.
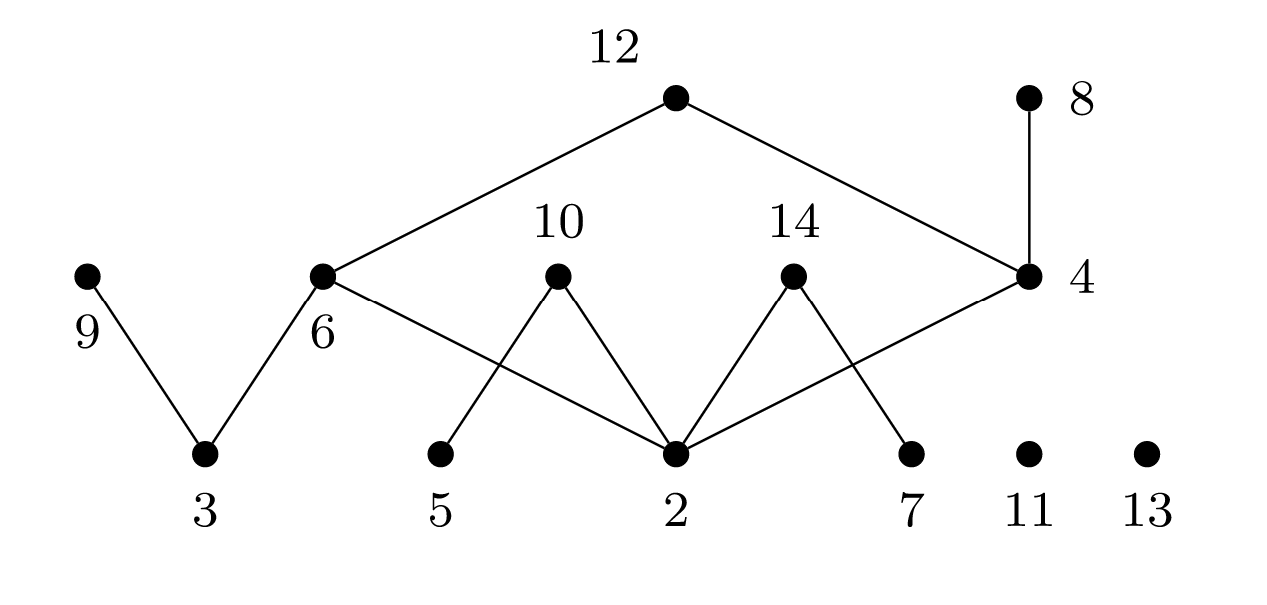
We can use graphs to visualize other kinds of mathematical relationships.
For integers \(m,n\text{,}\) write \(m \mid n\) if \(m\) divides \(n\text{;}\) that is, if \(n/m\) is also an integer. In this case, we say that \(m\) divides \(n\text{.}\)
Set
\begin{equation*} V = \{2,3,4,5,6,7,8,9,10,11,12,13,14\} \text{.} \end{equation*}
Let \(G = (V,E)\) be the directed graph where, for integers \(m,n \in V\) with \(m \lt n\text{,}\) the ordered pair \((m,n)\) is an edge in \(E\) if the following two conditions are satisfied:
\(m \mid n\text{;}\)
there does not exist an integer \(\mathscr{P} \in V\) such that \(m \mid \mathscr{P}\) and \(\mathscr{P} \mid n\text{,}\) but \(\mathscr{P} \ne m,n\text{.}\)
We can use this directed graph to visualize the set \(V\) with respect to the divides relationship. Again, we agree that arrows will always point up, but do not actually draw them. Note that the prime numbers all appear at the bottom.
You get a summer job with the Prospective Student Office at the University of Alberta's Augustana Campus in Camrose, Alberta. In May and June, your job is to visit Alberta high schools and meet with students who are thinking of applying to Augustana. Below is a map of the cities and towns you must visit, given as a weighted graph with distances in kilometres as weights. To save on gas, you would like to visit each city and town exactly once, and do so while travelling the shortest distance possible.
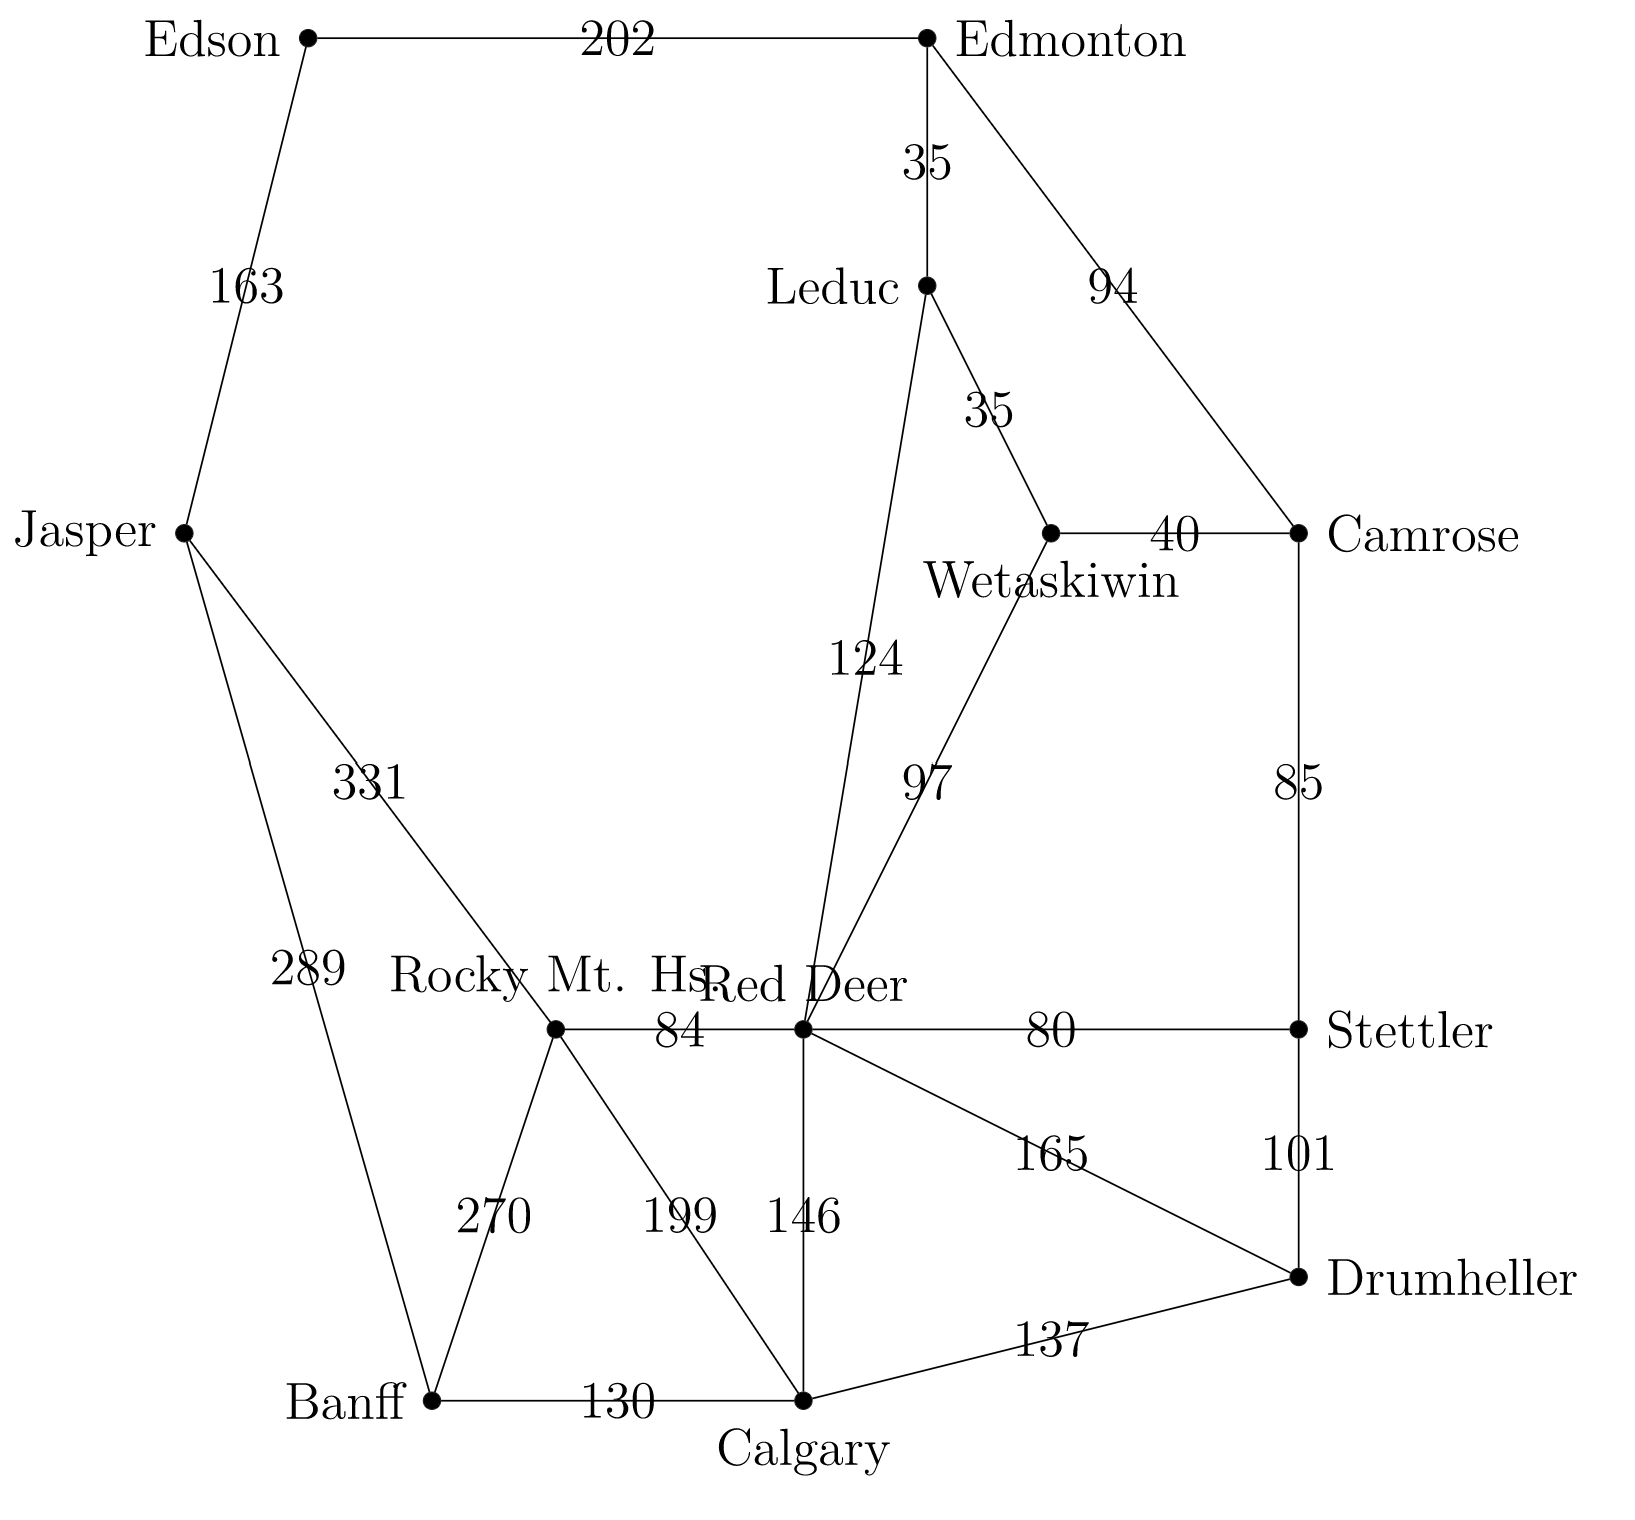
This is a difficult problem, and gets more difficult as the number of cities and roads increases.