
2.4.2: Interpreting Graphs of Proportional Relationships
- Page ID
- 38114

\( \newcommand{\vecs}[1]{\overset { \scriptstyle \rightharpoonup} {\mathbf{#1}} } \)
\( \newcommand{\vecd}[1]{\overset{-\!-\!\rightharpoonup}{\vphantom{a}\smash {#1}}} \)
\( \newcommand{\id}{\mathrm{id}}\) \( \newcommand{\Span}{\mathrm{span}}\)
( \newcommand{\kernel}{\mathrm{null}\,}\) \( \newcommand{\range}{\mathrm{range}\,}\)
\( \newcommand{\RealPart}{\mathrm{Re}}\) \( \newcommand{\ImaginaryPart}{\mathrm{Im}}\)
\( \newcommand{\Argument}{\mathrm{Arg}}\) \( \newcommand{\norm}[1]{\| #1 \|}\)
\( \newcommand{\inner}[2]{\langle #1, #2 \rangle}\)
\( \newcommand{\Span}{\mathrm{span}}\)
\( \newcommand{\id}{\mathrm{id}}\)
\( \newcommand{\Span}{\mathrm{span}}\)
\( \newcommand{\kernel}{\mathrm{null}\,}\)
\( \newcommand{\range}{\mathrm{range}\,}\)
\( \newcommand{\RealPart}{\mathrm{Re}}\)
\( \newcommand{\ImaginaryPart}{\mathrm{Im}}\)
\( \newcommand{\Argument}{\mathrm{Arg}}\)
\( \newcommand{\norm}[1]{\| #1 \|}\)
\( \newcommand{\inner}[2]{\langle #1, #2 \rangle}\)
\( \newcommand{\Span}{\mathrm{span}}\) \( \newcommand{\AA}{\unicode[.8,0]{x212B}}\)
\( \newcommand{\vectorA}[1]{\vec{#1}} % arrow\)
\( \newcommand{\vectorAt}[1]{\vec{\text{#1}}} % arrow\)
\( \newcommand{\vectorB}[1]{\overset { \scriptstyle \rightharpoonup} {\mathbf{#1}} } \)
\( \newcommand{\vectorC}[1]{\textbf{#1}} \)
\( \newcommand{\vectorD}[1]{\overrightarrow{#1}} \)
\( \newcommand{\vectorDt}[1]{\overrightarrow{\text{#1}}} \)
\( \newcommand{\vectE}[1]{\overset{-\!-\!\rightharpoonup}{\vphantom{a}\smash{\mathbf {#1}}}} \)
\( \newcommand{\vecs}[1]{\overset { \scriptstyle \rightharpoonup} {\mathbf{#1}} } \)
\( \newcommand{\vecd}[1]{\overset{-\!-\!\rightharpoonup}{\vphantom{a}\smash {#1}}} \)
Lesson
Let's read stories from the graphs of proportional relationships.
Exercise \(\PageIndex{1}\): What Could the Graph Represent?
Here is a graph that represents a proportional relationship.
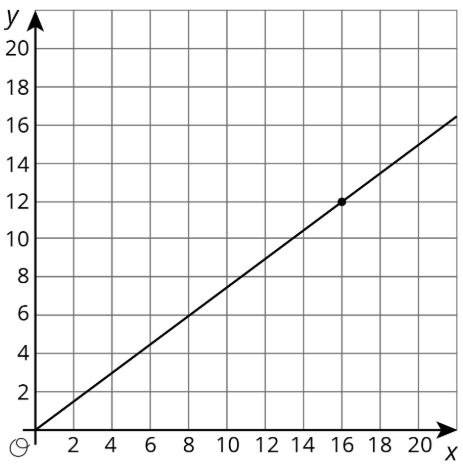
- Invent a situation that could be represented by this graph.
- Label the axes with the quantities in your situation.
- Give the graph a title.
- There is a point on the graph. What are its coordinates? What does it represent in your situation?
Exercise \(\PageIndex{2}\): Tyler's Walk
Tyler was at the amusement park. He walked at a steady pace from the ticket booth to the bumper cars.
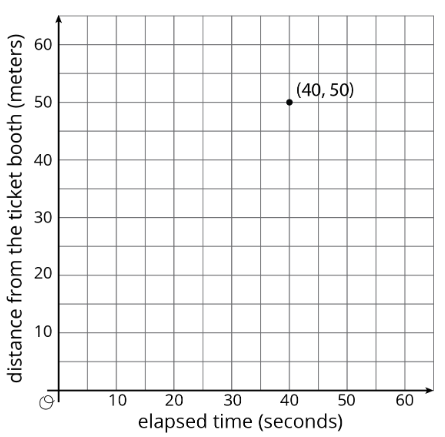
- The point on the graph shows his arrival at the bumper cars. What do the coordinates of the point tell us about the situation?
- The table representing Tyler's walk shows other values of time and distance. Complete the table. Next, plot the pairs of values on the grid.
- What does the point \((0,0)\) mean in this situation?
- How far away from the ticket booth was Tyler after 1 second? Label the point on the graph that shows this information with its coordinates.
- What is the constant of proportionality for the relationship between time and distance? What does it tell you about Tyler's walk? Where do you see it in the graph?
| time (seconds) | distance (meters) |
|---|---|
| \(0\) | \(0\) |
| \(20\) | \(25\) |
| \(30\) | \(37.5\) |
| \(40\) | \(50\) |
| \(1\) |
Are you ready for more?
If Tyler wanted to get to the bumper cars in half the time, how would the graph representing his walk change? How would the table change? What about the constant of proportionality?
Exercise \(\PageIndex{3}\): Seagulls Eat What?
4 seagulls ate 10 pounds of garbage. Assume this information describes a proportional relationship.
- Plot a point that shows the number of seagulls and the amount of garbage they ate.
- Use a straight edge to draw a line through this point and \((0,0)\).
- Plot the point \((1,k)\) on the line. What is the value of \(k\)? What does the value of \(k\) tell you about this context?
Summary
For the relationship represented in this table, \(y\) is proportional to \(x\). We can see in the table that \(\frac{5}{4}\) is the constant of proportionality because it’s the \(y\) value when \(x\) is 1.
The equation \(y=\frac{5}{4}x\) also represents this relationship.
| \(x\) | \(y\) |
|---|---|
| \(4\) | \(5\) |
| \(5\) | \(\frac{25}{4}\) |
| \(8\) | \(10\) |
| \(1\) | \(\frac{5}{4}\) |
Here is the graph of this relationship.
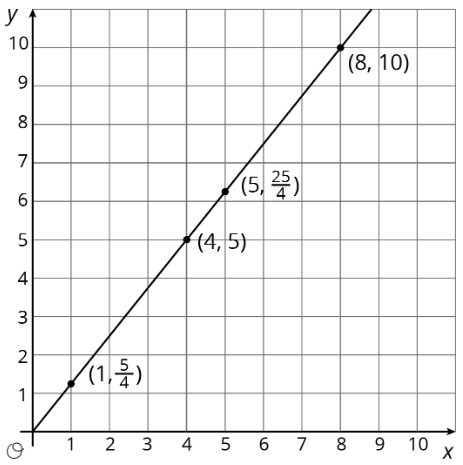
If \(y\) represents the distance in feet that a snail crawls in \(x\) minutes, then the point \((4,5)\) tells us that the snail can crawl 5 feet in 4 minutes.
If \(y\) represents the cups of yogurt and \(x\) represents the teaspoons of cinnamon in a recipe for fruit dip, then the point \((4,5)\) tells us that you can mix 4 teaspoons of cinnamon with 5 cups of yogurt to make this fruit dip.
We can find the constant of proportionality by looking at the graph, because \(\frac{5}{4}\) is the \(y\)-coordinate of the point on the graph where the \(x\)-coordinate is 1. This could mean the snail is traveling \(\frac{5}{4}\) feet per minute or that the recipe calls for \(1\frac{1}{4}\) cups of yogurt for every teaspoon of cinnamon.
In general, when \(y\) is proportional to \(x\), the corresponding constant of proportionality is the \(y\)-value when \(x=1\).
Glossary Entries
Definition: Coordinate Plane
The coordinate plane is a system for telling where points are. For example. point \(R\) is located at \((3,2)\) on the coordinate plane, because it is three units to the right and two units up.

Definition: Origin
The origin is the point \((0,0)\) in the coordinate plane. This is where the horizontal axis and the vertical axis cross.

Practice
Exercise \(\PageIndex{4}\)
There is a proportional relationship between the number of months a person has had a streaming movie subscription and the total amount of money they have paid for the subscription. The cost for 6 months is $47.94. The point \((6,47.94)\) is shown on the graph below.

- What is the constant of proportionality in this relationship?
- What does the constant of proportionality tell us about the situation?
- Add at least three more points to the graph and label them with their coordinates.
- Write an equation that represents the relationship between \(C\), the total cost of the subscription, and \(m\), the number of months.
Exercise \(\PageIndex{5}\)
The graph shows the amounts of almonds, in grams, for different amounts of oats, in cups, in a granola mix. Label the point \((1,k)\) on the graph, find the value of \(k\), and explain its meaning.

Exercise \(\PageIndex{6}\)
To make a friendship bracelet, some long strings are lined up then taking one string and tying it in a knot with each of the other strings to create a row of knots. A new string is chosen and knotted with the all the other strings to create a second row. This process is repeated until there are enough rows to make a bracelet to fit around your friend's wrist.
Are the number of knots proportional to the number of rows? Explain your reasoning.
(From Unit 2.3.3)
Exercise \(\PageIndex{7}\)
What information do you need to know to write an equation relating two quantities that have a proportional relationship?
(From Unit 2.3.3)