
2.4.4: Two Graphs for Each Relationship
- Page ID
- 38112

\( \newcommand{\vecs}[1]{\overset { \scriptstyle \rightharpoonup} {\mathbf{#1}} } \)
\( \newcommand{\vecd}[1]{\overset{-\!-\!\rightharpoonup}{\vphantom{a}\smash {#1}}} \)
\( \newcommand{\id}{\mathrm{id}}\) \( \newcommand{\Span}{\mathrm{span}}\)
( \newcommand{\kernel}{\mathrm{null}\,}\) \( \newcommand{\range}{\mathrm{range}\,}\)
\( \newcommand{\RealPart}{\mathrm{Re}}\) \( \newcommand{\ImaginaryPart}{\mathrm{Im}}\)
\( \newcommand{\Argument}{\mathrm{Arg}}\) \( \newcommand{\norm}[1]{\| #1 \|}\)
\( \newcommand{\inner}[2]{\langle #1, #2 \rangle}\)
\( \newcommand{\Span}{\mathrm{span}}\)
\( \newcommand{\id}{\mathrm{id}}\)
\( \newcommand{\Span}{\mathrm{span}}\)
\( \newcommand{\kernel}{\mathrm{null}\,}\)
\( \newcommand{\range}{\mathrm{range}\,}\)
\( \newcommand{\RealPart}{\mathrm{Re}}\)
\( \newcommand{\ImaginaryPart}{\mathrm{Im}}\)
\( \newcommand{\Argument}{\mathrm{Arg}}\)
\( \newcommand{\norm}[1]{\| #1 \|}\)
\( \newcommand{\inner}[2]{\langle #1, #2 \rangle}\)
\( \newcommand{\Span}{\mathrm{span}}\) \( \newcommand{\AA}{\unicode[.8,0]{x212B}}\)
\( \newcommand{\vectorA}[1]{\vec{#1}} % arrow\)
\( \newcommand{\vectorAt}[1]{\vec{\text{#1}}} % arrow\)
\( \newcommand{\vectorB}[1]{\overset { \scriptstyle \rightharpoonup} {\mathbf{#1}} } \)
\( \newcommand{\vectorC}[1]{\textbf{#1}} \)
\( \newcommand{\vectorD}[1]{\overrightarrow{#1}} \)
\( \newcommand{\vectorDt}[1]{\overrightarrow{\text{#1}}} \)
\( \newcommand{\vectE}[1]{\overset{-\!-\!\rightharpoonup}{\vphantom{a}\smash{\mathbf {#1}}}} \)
\( \newcommand{\vecs}[1]{\overset { \scriptstyle \rightharpoonup} {\mathbf{#1}} } \)
\( \newcommand{\vecd}[1]{\overset{-\!-\!\rightharpoonup}{\vphantom{a}\smash {#1}}} \)
Lesson
Let's use tables, equations, and graphs to answer questions about proportional relationships.
Exercise \(\PageIndex{1}\): True or False: Fractions and Decimals
Decice whether each equation is true or false. Be prepared to explain your reasoning.
- \(\frac{3}{2}\cdot 16=3\cdot 8\)
- \(\frac{3}{4}\div\frac{1}{2}=\frac{6}{4}\div\frac{1}{4}\)
- \((2.8)\cdot (13)=(0.7)\cdot (52)\)
Exercise \(\PageIndex{2}\): Tables, Graphs, and Equations
Explore the graph. Start by dragging the gray bar on the left across the screen until you can see both the table and the graph. Notice the values in the table and the coordinates of the labeled point. Grab the point and move it around.
- What stays the same and what changes in the table? in the equation? on the graph?
- Choose one row in the table and write it here. To what does this row correspond on the graph?
| \(x\) | \(y\) |
|---|---|
Grab and drag the point until you see the equation \(y=\frac{3}{2}x\).
- Do not move the point. Choose three rows from the table, other than the origin. Record \(x\) and \(y\), and compute \(\frac{y}{x}\).
| \(x\) | \(y\) | \(\frac{y}{x}\) |
|---|---|---|
- What do you notice? What does this have to do with the equation of the line?
- Do not move the point. Check the box to view the coordinates \((1,?)\). What are the coordinates of this point? What does this correspond to in the table? What does this correspond to in the equation?
- Drag the point to a different location. Record the equation of the line, the coordinates of three points, and the value of \(\frac{y}{x}\).
Equation of the line: _______________________________
| \(x\) | \(y\) | \(\frac{y}{x}\) |
|---|---|---|
- Based on your observations, summarize any connections you see between the table, characteristics of the graph, and the equation.
Are you ready for more?
The graph of an equation of the form \(y=kx\), where \(k\) is a positive number, is a line through \((0,0)\) and the point \((1,k)\).
- Name at least one line through \((0,0)\) that cannot be represented by an equation like this.
- If you could draw the graphs of all of the equations of this form in the same coordinate plane, what would it look like?
Exercise \(\PageIndex{3}\): Hot Dog Eating Contest
Andre and Jada were in a hot dog eating contest. Andre ate 10 hot dogs in 3 minutes. Jada ate 12 hot dogs in 5 minutes.
- The points shown on the first set of axes display information about Andre’s and Jada’s consumption. Which point indicates Andre’s consumption? Which indicates Jada’s consumption? Label them.
- Draw two lines: one through the origin and Andre’s point, and one through the origin and Jada’s point. Write an equation for each line. Use to represent time in minutes, and to represent number of hot dogs.
- For each equation, what does the constant of proportionality tell you?
- The points shown on the second set of axes display information about Andre’s and Jada’s consumption. Which point indicates Andre’s consumption? Which indicates Jada’s consumption? Label them.
- Draw lines from the origin through each of the two points. Write an equation for each line. What does the constant of proportionality tell you in each case?
Summary
Imagine that a faucet is leaking at a constant rate and that every 2 minutes, 10 milliliters of water leaks from the faucet. There is a proportional relationship between the volume of water and elapsed time.
- We could say that the elapsed time is proportional to the volume of water. The corresponding constant of proportionality tells us that the faucet is leaking at a rate of \(\frac{1}{5}\) of a minute per milliliter.
- We could say that the volume of water is proportional to the elapsed time. The corresponding constant of proportionality tells us that the faucet is leaking at a rate of 5 milliliters per minute.
Let’s use \(v\) to represent volume in milliliters and \(t\) to represent time in minutes. Here are graphs and equations that represent both ways of thinking about this relationship:
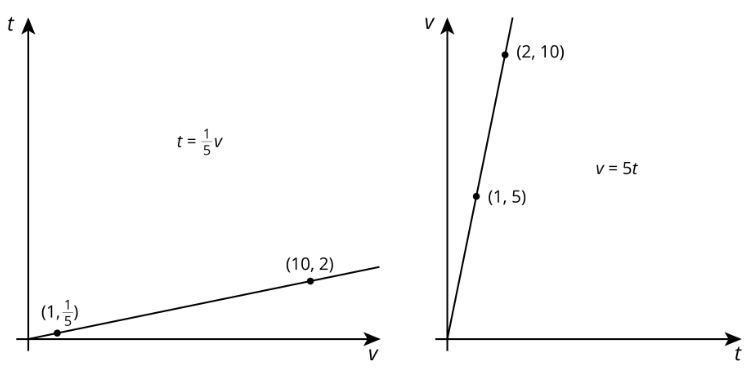
Even though the relationship between time and volume is the same, we are making a different choice in each case about which variable to view as the independent variable. The graph on the left has \(v\) as the independent variable, and the graph on the right has \(t\) as the independent variable.
Glossary Entries
Definition: Coordinate Plane
The coordinate plane is a system for telling where points are. For example. point \(R\) is located at \((3,2)\) on the coordinate plane, because it is three units to the right and two units up.

Definition: Origin
The origin is the point \((0,0)\) in the coordinate plane. This is where the horizontal axis and the vertical axis cross.

Practice
Exercise \(\PageIndex{4}\)
At the supermarket you can fill your own honey bear container. A customer buys 12 oz of honey for $5.40.
- How much does honey cost per ounce?
- How much honey can you buy per dollar?
- Write two different equations that represent this situation. Use \(h\) for ounces of honey and \(c\) for cost in dollars.
- Choose one of your equations, and sketch its graph. Be sure to label the axes.

Exercise \(\PageIndex{5}\)
The point \((3,\frac{6}{5})\) lies on the graph representing a proportional relationship. Which of the following points also lie on the same graph? Select all that apply.
- \((1,0.4)\)
- \(1.5, \frac{6}{10})\)
- \(\frac{6}{5},3)\)
- \((4,\frac{11}{5})\)
- \((15,6)\)
Exercise \(\PageIndex{6}\)
A trail mix recipe asks for 4 cups of raisins for every 6 cups of peanuts. There is proportional relationship between the amount of raisins, \(r\) (cups), and the amount of peanuts, \(p\) (cups), in this recipe.
- Write the equation for the relationship that has constant of proportionality greater than 1. Graph the relationship.
- Write the equation for the relationship that has constant of proportionality less than 1. Graph the relationship.
Exercise \(\PageIndex{7}\)
Here is a graph that represents a proportional relationship.

- Come up with a situation that could be represented by this graph.
- Label the axes with the quantities in your situation.
- Give the graph a title.
- Choose a point on the graph. What do the coordinates represent in your situation?
(From Unit 2.4.2)