
11.1: Use the Rectangular Coordinate System (Part 1)
- Page ID
- 5040

\( \newcommand{\vecs}[1]{\overset { \scriptstyle \rightharpoonup} {\mathbf{#1}} } \)
\( \newcommand{\vecd}[1]{\overset{-\!-\!\rightharpoonup}{\vphantom{a}\smash {#1}}} \)
\( \newcommand{\id}{\mathrm{id}}\) \( \newcommand{\Span}{\mathrm{span}}\)
( \newcommand{\kernel}{\mathrm{null}\,}\) \( \newcommand{\range}{\mathrm{range}\,}\)
\( \newcommand{\RealPart}{\mathrm{Re}}\) \( \newcommand{\ImaginaryPart}{\mathrm{Im}}\)
\( \newcommand{\Argument}{\mathrm{Arg}}\) \( \newcommand{\norm}[1]{\| #1 \|}\)
\( \newcommand{\inner}[2]{\langle #1, #2 \rangle}\)
\( \newcommand{\Span}{\mathrm{span}}\)
\( \newcommand{\id}{\mathrm{id}}\)
\( \newcommand{\Span}{\mathrm{span}}\)
\( \newcommand{\kernel}{\mathrm{null}\,}\)
\( \newcommand{\range}{\mathrm{range}\,}\)
\( \newcommand{\RealPart}{\mathrm{Re}}\)
\( \newcommand{\ImaginaryPart}{\mathrm{Im}}\)
\( \newcommand{\Argument}{\mathrm{Arg}}\)
\( \newcommand{\norm}[1]{\| #1 \|}\)
\( \newcommand{\inner}[2]{\langle #1, #2 \rangle}\)
\( \newcommand{\Span}{\mathrm{span}}\) \( \newcommand{\AA}{\unicode[.8,0]{x212B}}\)
\( \newcommand{\vectorA}[1]{\vec{#1}} % arrow\)
\( \newcommand{\vectorAt}[1]{\vec{\text{#1}}} % arrow\)
\( \newcommand{\vectorB}[1]{\overset { \scriptstyle \rightharpoonup} {\mathbf{#1}} } \)
\( \newcommand{\vectorC}[1]{\textbf{#1}} \)
\( \newcommand{\vectorD}[1]{\overrightarrow{#1}} \)
\( \newcommand{\vectorDt}[1]{\overrightarrow{\text{#1}}} \)
\( \newcommand{\vectE}[1]{\overset{-\!-\!\rightharpoonup}{\vphantom{a}\smash{\mathbf {#1}}}} \)
\( \newcommand{\vecs}[1]{\overset { \scriptstyle \rightharpoonup} {\mathbf{#1}} } \)
\( \newcommand{\vecd}[1]{\overset{-\!-\!\rightharpoonup}{\vphantom{a}\smash {#1}}} \)
\(\newcommand{\avec}{\mathbf a}\) \(\newcommand{\bvec}{\mathbf b}\) \(\newcommand{\cvec}{\mathbf c}\) \(\newcommand{\dvec}{\mathbf d}\) \(\newcommand{\dtil}{\widetilde{\mathbf d}}\) \(\newcommand{\evec}{\mathbf e}\) \(\newcommand{\fvec}{\mathbf f}\) \(\newcommand{\nvec}{\mathbf n}\) \(\newcommand{\pvec}{\mathbf p}\) \(\newcommand{\qvec}{\mathbf q}\) \(\newcommand{\svec}{\mathbf s}\) \(\newcommand{\tvec}{\mathbf t}\) \(\newcommand{\uvec}{\mathbf u}\) \(\newcommand{\vvec}{\mathbf v}\) \(\newcommand{\wvec}{\mathbf w}\) \(\newcommand{\xvec}{\mathbf x}\) \(\newcommand{\yvec}{\mathbf y}\) \(\newcommand{\zvec}{\mathbf z}\) \(\newcommand{\rvec}{\mathbf r}\) \(\newcommand{\mvec}{\mathbf m}\) \(\newcommand{\zerovec}{\mathbf 0}\) \(\newcommand{\onevec}{\mathbf 1}\) \(\newcommand{\real}{\mathbb R}\) \(\newcommand{\twovec}[2]{\left[\begin{array}{r}#1 \\ #2 \end{array}\right]}\) \(\newcommand{\ctwovec}[2]{\left[\begin{array}{c}#1 \\ #2 \end{array}\right]}\) \(\newcommand{\threevec}[3]{\left[\begin{array}{r}#1 \\ #2 \\ #3 \end{array}\right]}\) \(\newcommand{\cthreevec}[3]{\left[\begin{array}{c}#1 \\ #2 \\ #3 \end{array}\right]}\) \(\newcommand{\fourvec}[4]{\left[\begin{array}{r}#1 \\ #2 \\ #3 \\ #4 \end{array}\right]}\) \(\newcommand{\cfourvec}[4]{\left[\begin{array}{c}#1 \\ #2 \\ #3 \\ #4 \end{array}\right]}\) \(\newcommand{\fivevec}[5]{\left[\begin{array}{r}#1 \\ #2 \\ #3 \\ #4 \\ #5 \\ \end{array}\right]}\) \(\newcommand{\cfivevec}[5]{\left[\begin{array}{c}#1 \\ #2 \\ #3 \\ #4 \\ #5 \\ \end{array}\right]}\) \(\newcommand{\mattwo}[4]{\left[\begin{array}{rr}#1 \amp #2 \\ #3 \amp #4 \\ \end{array}\right]}\) \(\newcommand{\laspan}[1]{\text{Span}\{#1\}}\) \(\newcommand{\bcal}{\cal B}\) \(\newcommand{\ccal}{\cal C}\) \(\newcommand{\scal}{\cal S}\) \(\newcommand{\wcal}{\cal W}\) \(\newcommand{\ecal}{\cal E}\) \(\newcommand{\coords}[2]{\left\{#1\right\}_{#2}}\) \(\newcommand{\gray}[1]{\color{gray}{#1}}\) \(\newcommand{\lgray}[1]{\color{lightgray}{#1}}\) \(\newcommand{\rank}{\operatorname{rank}}\) \(\newcommand{\row}{\text{Row}}\) \(\newcommand{\col}{\text{Col}}\) \(\renewcommand{\row}{\text{Row}}\) \(\newcommand{\nul}{\text{Nul}}\) \(\newcommand{\var}{\text{Var}}\) \(\newcommand{\corr}{\text{corr}}\) \(\newcommand{\len}[1]{\left|#1\right|}\) \(\newcommand{\bbar}{\overline{\bvec}}\) \(\newcommand{\bhat}{\widehat{\bvec}}\) \(\newcommand{\bperp}{\bvec^\perp}\) \(\newcommand{\xhat}{\widehat{\xvec}}\) \(\newcommand{\vhat}{\widehat{\vvec}}\) \(\newcommand{\uhat}{\widehat{\uvec}}\) \(\newcommand{\what}{\widehat{\wvec}}\) \(\newcommand{\Sighat}{\widehat{\Sigma}}\) \(\newcommand{\lt}{<}\) \(\newcommand{\gt}{>}\) \(\newcommand{\amp}{&}\) \(\definecolor{fillinmathshade}{gray}{0.9}\)- Plot points on a rectangular coordinate system
- Identify points on a graph
- Verify solutions to an equation in two variables
- Complete a table of solutions to a linear equation
- Find solutions to linear equations in two variables
Before you get started, take this readiness quiz.
- Evaluate: x + 3 when x = −1. If you missed this problem, review Example 3.4.10.
- Evaluate: 2x − 5y when x = 3, y = −2. If you missed this problem, review Example 3.8.106.
- Solve for y: 40 − 4y = 20. If you missed this problem, review Example 8.4.1.
Plot Points on a Rectangular Coordinate System
Many maps, such as the Campus Map shown in Figure \(\PageIndex{1}\), use a grid system to identify locations. Do you see the numbers 1, 2, 3, and 4 across the top and bottom of the map and the letters A, B, C, and D along the sides? Every location on the map can be identified by a number and a letter.
For example, the Student Center is in section 2B. It is located in the grid section above the number 2 and next to the letter B. In which grid section is the Stadium? The Stadium is in section 4D.
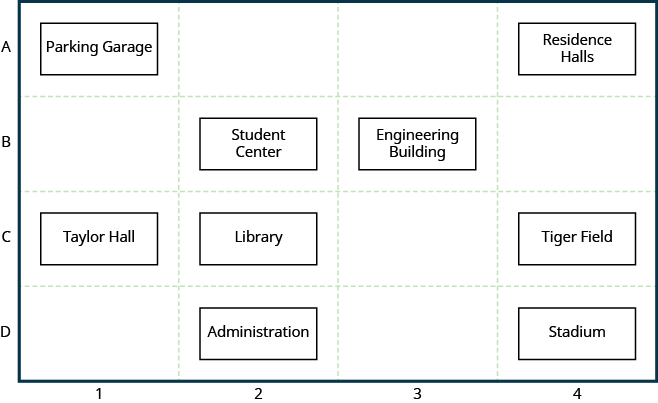
Figure \(\PageIndex{1}\)
Use the map in Figure \(\PageIndex{1}\). (a) Find the grid section of the Residence Halls. (b) What is located in grid section 4C?
Solution
(a) Read the number below the Residence Halls, 4, and the letter to the side, A. So the Residence Halls are in grid section 4A.
(b) Find 4 across the bottom of the map and C along the side. Look below the 4 and next to the C. Tiger Field is in grid section 4C.
Use the map in Figure \(\PageIndex{1}\). (a) Find the grid section of Taylor Hall. (b) What is located in section 3B?
- Answer a
-
1C
- Answer b
-
Engineering Building
Use the map in Figure \(\PageIndex{1}\). (a) Find the grid section of the Parking Garage. (b) What is located in section 2C?
- Answer a
-
1A
- Answer b
-
Library
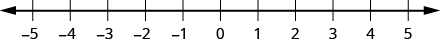
Just as maps use a grid system to identify locations, a grid system is used in algebra to show a relationship between two variables in a rectangular coordinate system. To create a rectangular coordinate system, start with a horizontal number line. Show both positive and negative numbers as you did before, using a convenient scale unit. This horizontal number line is called the x-axis.
Now, make a vertical number line passing through the x-axis at 0. Put the positive numbers above 0 and the negative numbers below 0. See Figure \(\PageIndex{2}\). This vertical line is called the y-axis.
Vertical grid lines pass through the integers marked on the x-axis. Horizontal grid lines pass through the integers marked on the y-axis. The resulting grid is the rectangular coordinate system.
The rectangular coordinate system is also called the x-y plane, the coordinate plane, or the Cartesian coordinate system (since it was developed by a mathematician named René Descartes.)
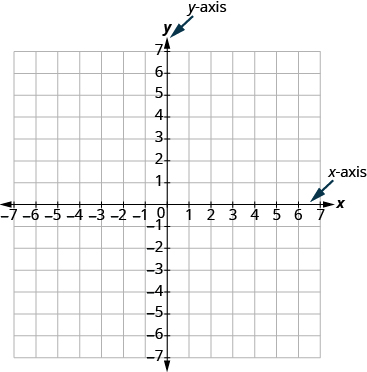
Figure \(\PageIndex{2}\) - The rectangular coordinate system.
The x-axis and the y-axis form the rectangular coordinate system. These axes divide a plane into four areas, called quadrants. The quadrants are identified by Roman numerals, beginning on the upper right and proceeding counterclockwise. See Figure \(\PageIndex{3}\).
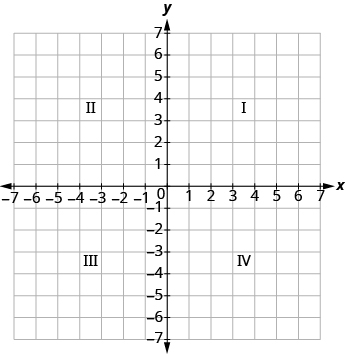
Figure \(\PageIndex{3}\) - The four quadrants of the rectangular coordinate system.
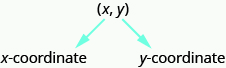
In the rectangular coordinate system, every point is represented by an ordered pair. The first number in the ordered pair is the x-coordinate of the point, and the second number is the y-coordinate of the point.
An ordered pair, (x, y) gives the coordinates of a point in a rectangular coordinate system. The first number is the x-coordinate. The second number is the y-coordinate.
So how do the coordinates of a point help you locate a point on the x-y plane?
Let’s try locating the point (2, 5) . In this ordered pair, the x -coordinate is 2 and the y -coordinate is 5 .
We start by locating the x value, 2, on the x-axis. Then we lightly sketch a vertical line through x = 2, as shown in Figure \(\PageIndex{4}\)
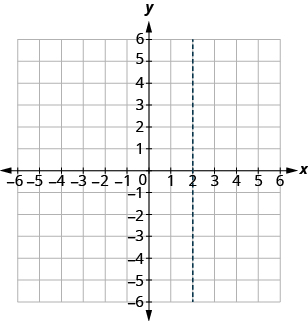
Figure \(\PageIndex{4}\)
Now we locate the y value, 5, on the y -axis and sketch a horizontal line through y = 5. The point where these two lines meet is the point with coordinates (2, 5). We plot the point there, as shown in Figure \(\PageIndex{5}\).
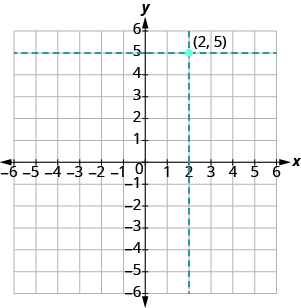
Figure \(\PageIndex{5}\)
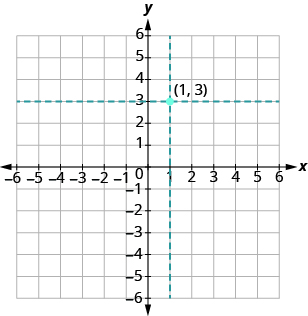
Plot (1, 3) and (3, 1) in the same rectangular coordinate system.
Solution
The coordinate values are the same for both points, but the x and y values are reversed. Let’s begin with point (1, 3). The x-coordinate is 1 so find 1 on the x-axis and sketch a vertical line through x = 1. The y-coordinate is 3 so we find 3 on the y-axis and sketch a horizontal line through y = 3. Where the two lines meet, we plot the point (1, 3).
To plot the point (3, 1), we start by locating 3 on the x-axis and sketch a vertical line through x = 3. Then we find 1 on the y-axis and sketch a horizontal line through y = 1. Where the two lines meet, we plot the point (3, 1).
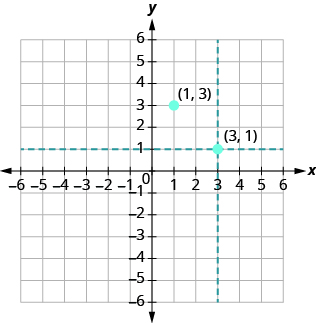
Notice that the order of the coordinates does matter, so, (1, 3) is not the same point as (3, 1).
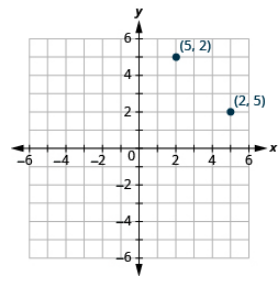
Plot each point on the same rectangular coordinate system: (2, 5), (5, 2).
- Answer
-
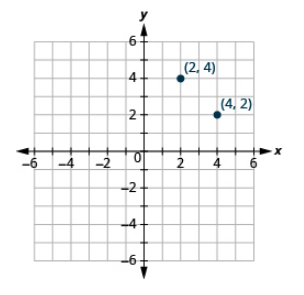
Plot each point on the same rectangular coordinate system: (4, 2), (2, 4).
- Answer
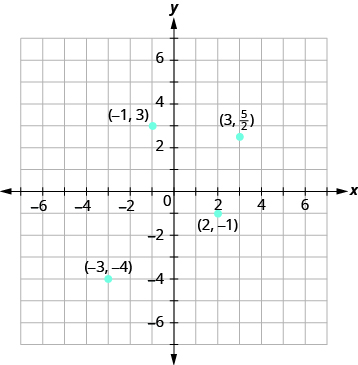
Plot each point in the rectangular coordinate system and identify the quadrant in which the point is located: (a) (−1, 3) (b) (−3, −4) (c) (2, −3) (d) \(\left(3, \dfrac{5}{2}\right)\)
Solution
The first number of the coordinate pair is the x-coordinate, and the second number is the y-coordinate.
- Since x = −1, y = 3, the point (−1, 3) is in Quadrant II.
- Since x = −3, y = −4, the point (−3, −4) is in Quadrant III.
- Since x = 2, y = −1, the point (2, −1) is in Quadrant lV.
- Since x = 3, y = \(\dfrac{5}{2}\), the point \(\left(3, \dfrac{5}{2}\right)\) is in Quadrant I. It may be helpful to write \(\dfrac{5}{2}\) as the mixed number, \(2 \dfrac{1}{2}\), or decimal, 2.5. Then we know that the point is halfway between 2 and 3 on the y-axis.
Plot each point in the rectangular coordinate system and identify the quadrant in which the point is located: (a) (−2, 1) (b) (−3, −1) (c) (4, −4) (d) \(\left(-4, \dfrac{3}{2}\right)\)
- Answer
Plot each point in the rectangular coordinate system and identify the quadrant in which the point is located: (a) (−4, 1) (b) (−2, 3) (c) (2, −5) (d) \(\left(-3, \dfrac{5}{2}\right)\)
- Answer
How do the signs affect the location of the points?
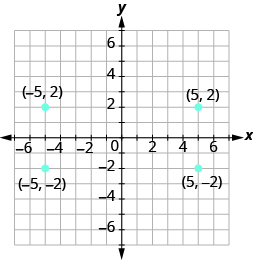
Plot each point: (a) (−5, 2) (b) (−5, −2) (c) (5, 2) (d) (5, −2)
Solution
As we locate the x-coordinate and the y-coordinate, we must be careful with the signs.
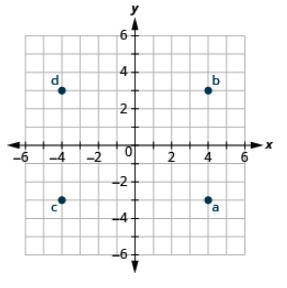
Plot each point: (a) (4, −3) (b) (4, 3) (c) (−4, −3) (d) (−4, 3)
- Answer
Plot each point: (a) (−1, 4) (b) (1, 4) (c) (1, −4) (d) (−1, −4)
- Answer
You may have noticed some patterns as you graphed the points in the two previous examples.
For each point in Quadrant IV, what do you notice about the signs of the coordinates?
What about the signs of the coordinates of the points in the third quadrant? The second quadrant? The first quadrant?
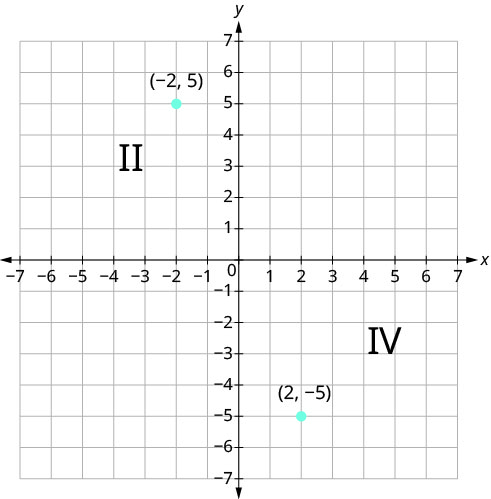
Can you tell just by looking at the coordinates in which quadrant the point (−2, 5) is located? In which quadrant is (2, −5) located?
We can summarize sign patterns of the quadrants as follows. Also see Figure \(\PageIndex{6}\).
| Quadrant I | Quadrant II | Quadrant III | Quadrant IV |
|---|---|---|---|
| (x,y) | (x,y) | (x,y) | (x,y) |
| (+,+) | (-,+) | (-,-) | (+,-) |
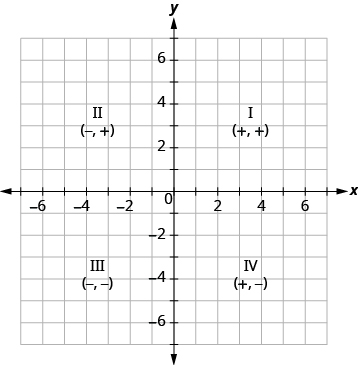
Figure \(\PageIndex{6}\)
What if one coordinate is zero? Where is the point (0, 4) located? Where is the point (−2, 0) located? The point (0, 4) is on the y-axis and the point ( − 2, 0) is on the x-axis.
Points with a y-coordinate equal to 0 are on the x-axis, and have coordinates (a, 0).
Points with an x-coordinate equal to 0 are on the y-axis, and have coordinates (0, b).
What is the ordered pair of the point where the axes cross? At that point both coordinates are zero, so its ordered pair is (0, 0). The point has a special name. It is called the origin.
The point (0, 0) is called the origin. It is the point where the x-axis and y-axis intersect.
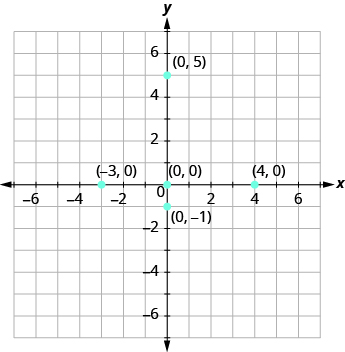
Plot each point on a coordinate grid: (a) (0, 5) (b) (4, 0) (c) (−3, 0) (d) (0, 0) (e) (0, −1)
Solution
- Since x = 0, the point whose coordinates are (0, 5) is on the y-axis.
- Since y = 0, the point whose coordinates are (4, 0) is on the x-axis.
- Since y = 0, the point whose coordinates are (−3, 0) is on the x-axis.
- Since x = 0 and y = 0, the point whose coordinates are (0, 0) is the origin.
- Since x = 0, the point whose coordinates are (0, −1) is on the y-axis.
Plot each point on a coordinate grid: (a) (4, 0) (b) (−2, 0) (c) (0, 0) (d) (0, 2) (e) (0, −3)
- Answer
Plot each point on a coordinate grid: (a) (−5, 0) (b) (3, 0) (c) (0, 0) (d) (0, −1) (e) (0, 4)
- Answer
Identify Points on a Graph
In algebra, being able to identify the coordinates of a point shown on a graph is just as important as being able to plot points. To identify the x-coordinate of a point on a graph, read the number on the x-axis directly above or below the point. To identify the y-coordinate of a point, read the number on the y-axis directly to the left or right of the point. Remember, to write the ordered pair using the correct order (x, y).
Name the ordered pair of each point shown:
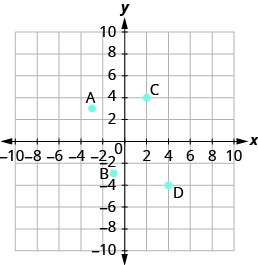
Solution
Point A is above −3 on the x-axis, so the x-coordinate of the point is −3. The point is to the left of 3 on the y-axis, so the y-coordinate of the point is 3. The coordinates of the point are (−3, 3).
Point B is below −1 on the x-axis, so the x-coordinate of the point is −1. The point is to the left of −3 on the y-axis, so the y-coordinate of the point is −3. The coordinates of the point are (−1, −3).
Point C is above 2 on the x-axis, so the x-coordinate of the point is 2. The point is to the right of 4 on the y-axis, so the y-coordinate of the point is 4. The coordinates of the point are (2, 4).
Point D is below 4 on the x - axis, so the x-coordinate of the point is 4. The point is to the right of −4 on the y-axis, so the y-coordinate of the point is −4. The coordinates of the point are (4, −4)
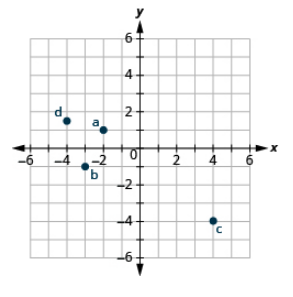
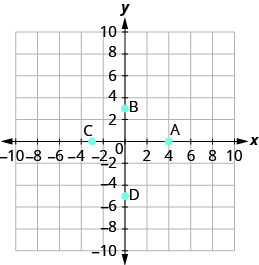
Name the ordered pair of each point shown:
- Answer
- A: (5,1), B: (−2,4), C: (−5,−1), D: (3,−2)
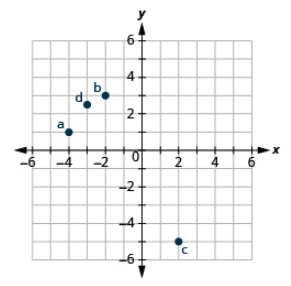
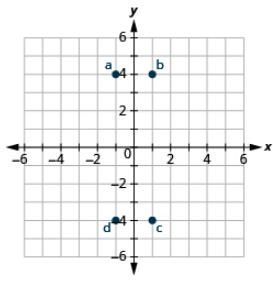
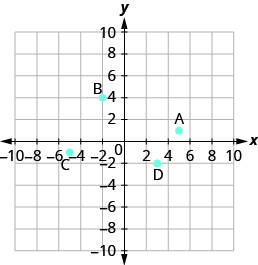
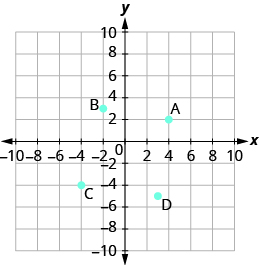
Name the ordered pair of each point shown:
- Answer
- A: (4,2), B: (−2,3), C: (−4,−4), D: (3,−5)
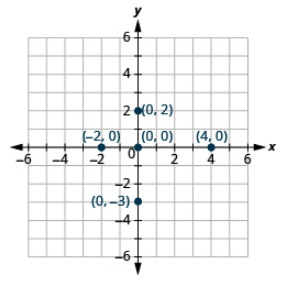
Name the ordered pair of each point shown:
Solution
| Point A is on the x-axis at x = − 4. | The coordinates of point A are (− 4, 0). |
| Point B is on the y-axis at y = − 2. | The coordinates of point B are (0, − 2). |
| Point C is on the x-axis at x = 3. | The coordinates of point C are (3, 0). |
| Point D is on the y-axis at y = 1. | The coordinates of point D are (0, 1). |
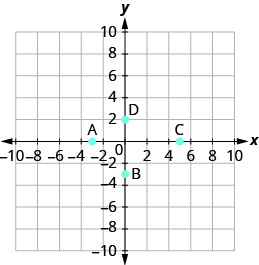
Name the ordered pair of each point shown:
- Answer
- A: (4,0), B: (0,3), C: (−3,0), D: (0,−5)
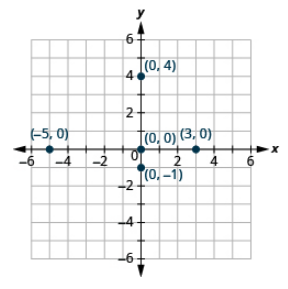
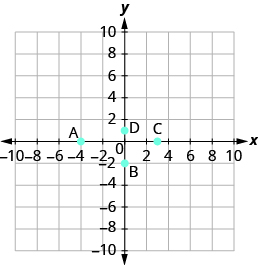
Name the ordered pair of each point shown:
- Answer
- A: (−3,0), B: (0,−3), C: (5,0), D: (0,2)
Contributors and Attributions
Lynn Marecek (Santa Ana College) and MaryAnne Anthony-Smith (Formerly of Santa Ana College). This content is licensed under Creative Commons Attribution License v4.0 "Download for free at http://cnx.org/contents/fd53eae1-fa2...49835c3c@5.191."