
1.1E: Functions and Function Notation
- Page ID
- 30238
Exercise 1.1
- The amount of garbage, G, produced by a city with population p is given by \(G = f(p)\). G is measured in tons per week, and \(p\) is measured in thousands of people. a. The town of Tola has a population of 40,000 and produces 13 tons of garbage each week. Express this information in terms of the function \(f\).
b. Explain the meaning of the statement \(f(5)=2\). - The number of cubic yards of dirt, D, needed to cover a garden with area a square feet is given by \(D=g(a)\). a. A garden with area 5000 ft \({}^{2}\) requires 50 cubic yards of dirt. Express this information in terms of the function \(g\).
b. Explain the meaning of the statement \(g(100)=1\). - Let \(f(t)\) be the number of ducks in a lake t years after 1990. Explain the meaning of each statement:
a. \(f\left(5\right)=30\) b. \(f\left(10\right)=40\) - Let \(h(t)\) be the height above ground, in feet, of a rocket t seconds after launching. Explain the meaning of each statement:
a. \(h(1)=200\) b. \(h(2)=350\) - Select all of the following graphs which represent \(y\) as a function of \(x\).
a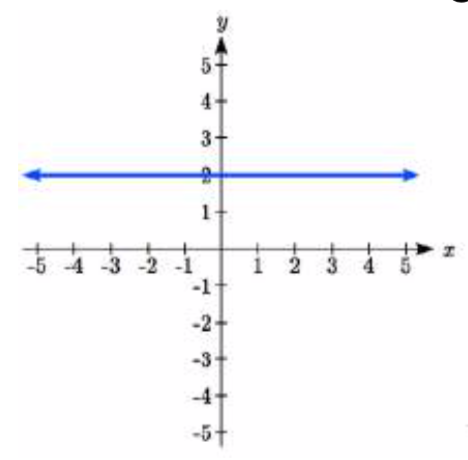 b
b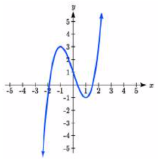 c
c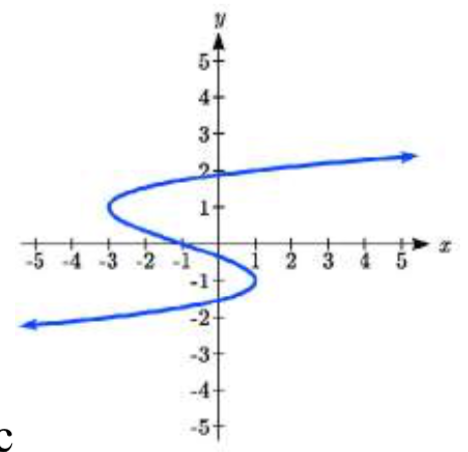
d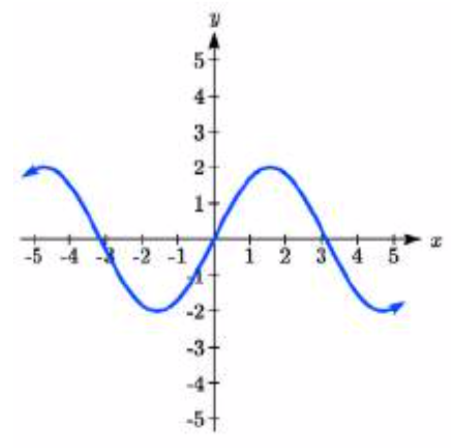 e
e f
f 
- Select all of the following graphs which represent \(y\) as a function of \(x\).
a b
b  c
c 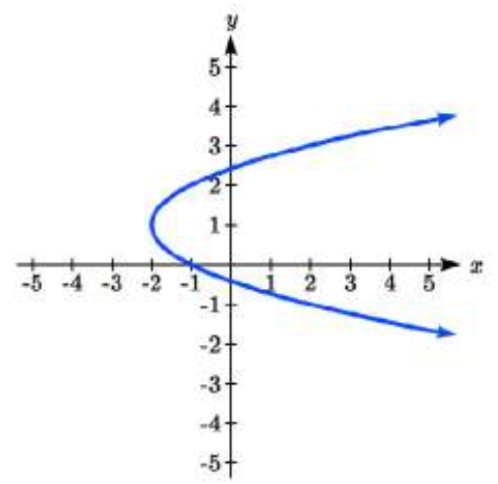
d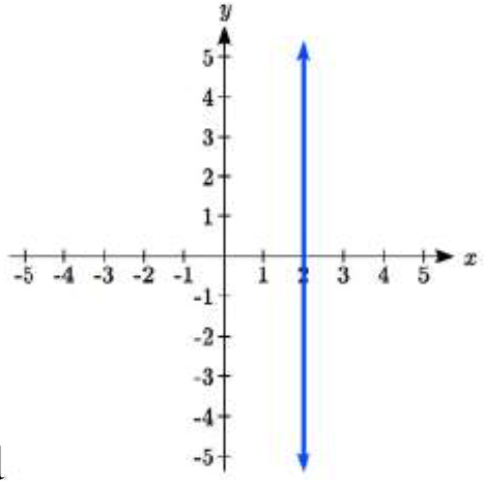 e
e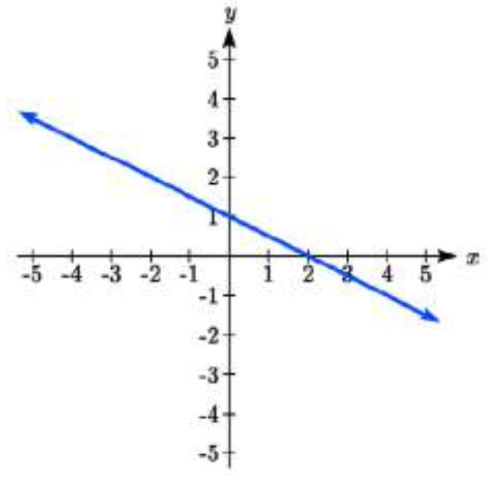 f
f 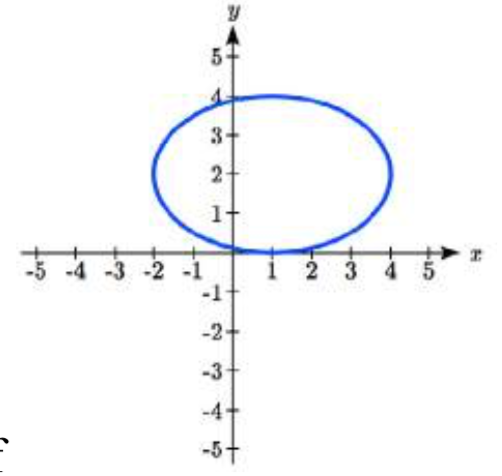
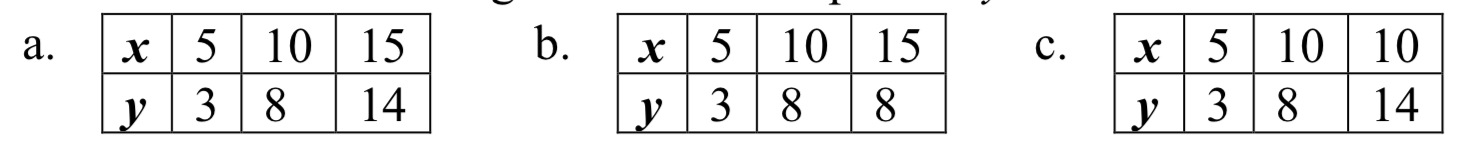
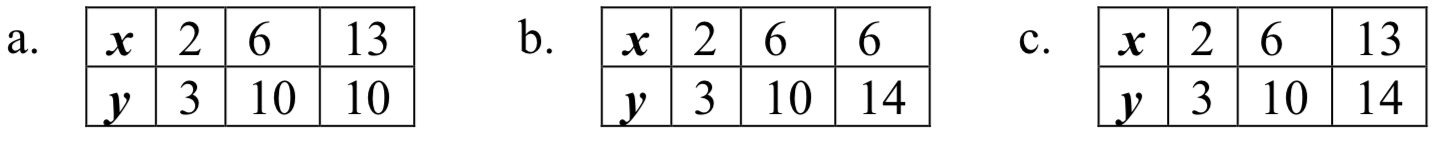
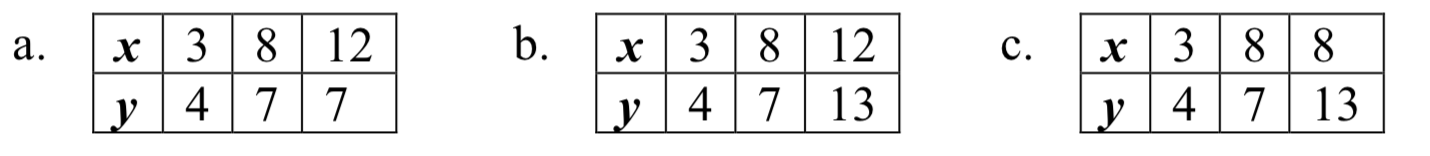
- Select all of the following tables which represent \(y\) as a function of \(x\).
- Select all of the following tables which represent \(y\) as a function of \(x\).
- Select all of the following tables which represent \(y\) as a function of \(x\).
- Select all of the following tables which represent \(y\) as a function of \(x\).
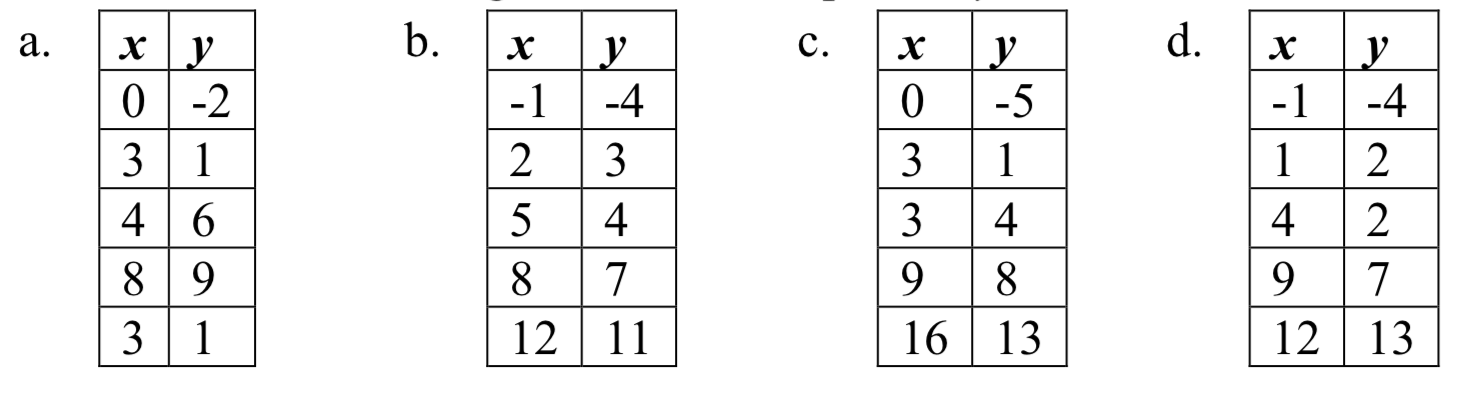
- Select all of the following tables which represent \(y\) as a function of \(x\) and are one-to-one.
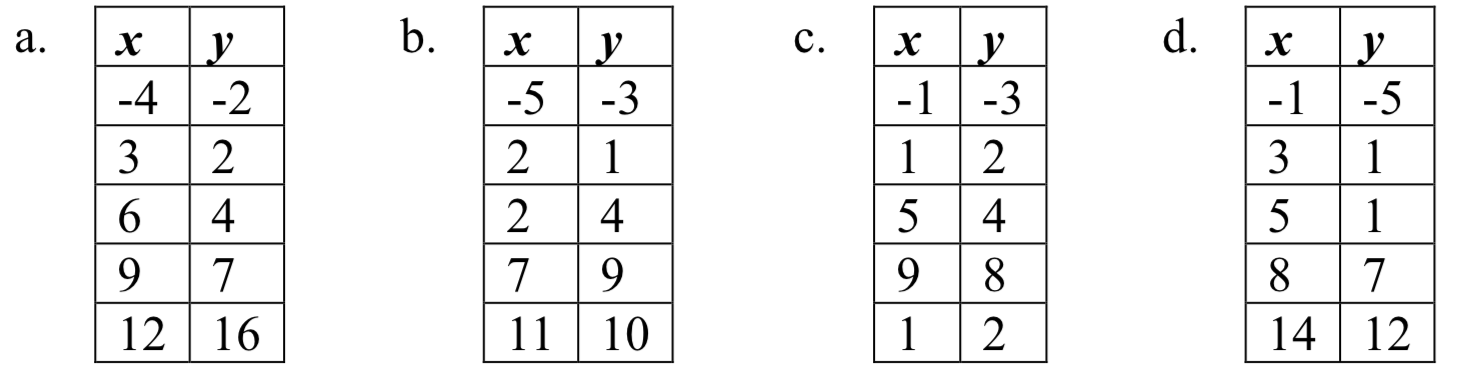
- Select all of the following tables which represent \(y\) as a function of \(x\) and are one-to-one.
- Select all of the following graphs which are one-to-one functions.
a. b.
b. c.
c. 
d . e .
e .  f.
f. 
- Select all of the following graphs which are one-to-one functions.
a b
b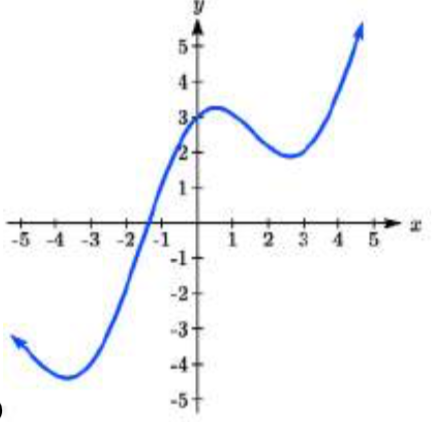 c
c 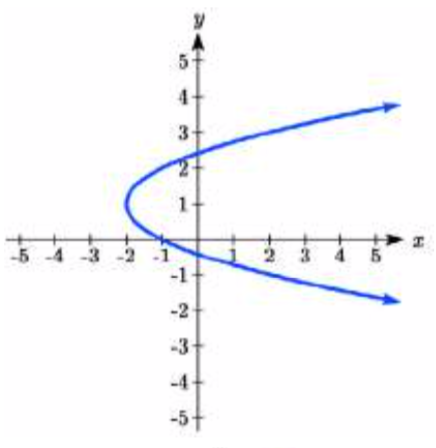
d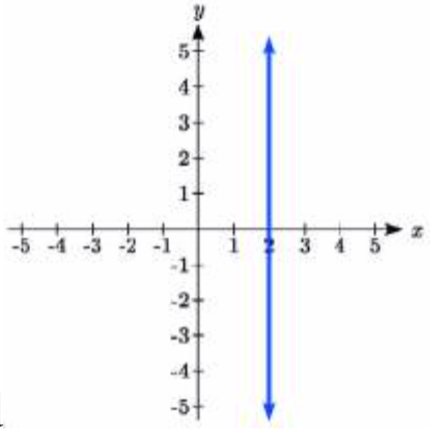 e
e 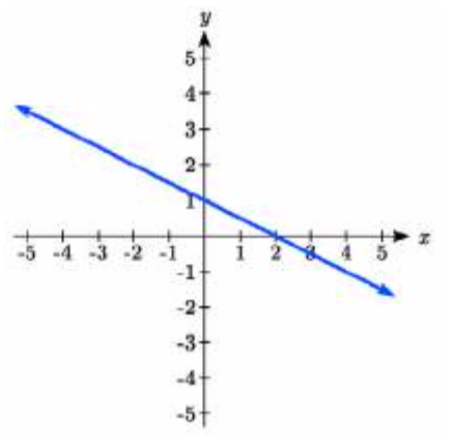 f
f 
- Given function \(f(x)\) graphed, evaluate \(f(1)\) and \(f(3)\)
- Given function \(f(x)\) graphed, evaluate \(f(1)\) and \(f(3)\)
- Given the function \(g(x)\) graphed here,
a. Evaluate \(g(2)\)
b. Solve \(g(x) = 2\)
- Given the function \(f(x)\) graphed here,
a. Evaluate \(f(4)\)
b. Solve \(f(x) = 4\)
- Based on the table below,
a. Evaluate \(f(3)\) b. Solve \(f(x) = 1\)\(x\) 0 1 2 3 4 5 6 7 8 9 \(f(x)\) 74 28 1 53 56 3 36 45 14 47 - Based on the table below,
a. Evaluate \(f(8)\) b. Solve \(f(x) = 1\)\(x\) 0 1 2 3 4 5 6 7 8 9 \(f(x)\) 62 8 7 38 86 73 70 39 75 34 For 21-34 functions, evaluate: \(f(-2)\), \(f(-1)\), \(f(0)\), \(f(1)\), and \(f(2)\)
- \(f(x) = 4 - 2x\)
- \(f(x) = 8 - 3x\)
- \(f(x) = 8x^2 - 7x + 3\)
- \(f(x) = 6x^2 - 7x + 4\)
- \(f(x) = -x^3 + 2x\)
- \(f(x) = 5x^4 + x^2\)
- \(f(x) = 3 + \sqrt{x + 3}\)
- \(f(x) = 4 - \sqrt[3]{x - 2}\)
- \(f(x) = (x - 2)(x + 3)\)
- \(f(x) = (x + 3) (x - 1)^2\)
- \(f(x) = \dfrac{x - 3}{x + 1}\)
- \(f(x) = \dfrac{x - 2}{x + 2}\)
- \(f(x) = 2^x\)
- \(f(x) = 3^x\)
- Suppose \(f(x) = x^2 + 8x - 4\). Compute the following:
a. \(f(-1) + f(1)\)
b. \(f(-1) - f(1)\) - Suppose \(f(x) = x^2 + x + 3\). Compute the following:
a. \(f(-2) + f(4)\)
b. \(f(-2) - f(4)\) - Let \(f(t) = 3t + 5\)
a. Evaluate \(f(0)\)
b. Solve \(f(t) = 0\) - Let \(g(p) = 6 - 2p\)
a. Evaluate \(g(0)\)
b. Solve \(g(p) = 0\) - Match each function name with its equation.
a. \(y=x\) i. Cube root
b. \(y=x^{3}\) ii. Reciprocal
c. \(y=\sqrt[3]{x}\) iii. Linear
d. \(y=\dfrac{1}{x}\) iv. Square Root
e. \(y=x^{2}\) v. Absolute Value
f. \(y=\sqrt{x}\) vi. Quadratic
g. \(y = |x|\)
h. \(y = \dfrac{1}{x^2}\) - Match each graph with its equation.
a. \(y=x\)
b. \(y=x^{3}\)
c. \(y=\sqrt[3]{x}\)
d. \(y=\dfrac{1}{x}\)
e. \(y=x^{2}\)
f. \(y=\sqrt{x}\)
g. \(y = |x|\)
h. \(y = \dfrac{1}{x^2}\)
- Match each table with its equation.
a. \(y=x^{2}\)
b. \(y=x\)
c. \(y=\sqrt{x}\)
d. \(y=1/x\)
e. \(y=|x|\)
f. \(y=x^{3}\)
- Match each equation with its table
a. Quadratic
b. Absolute Value
c. Square Root
d. Linear
e. Cubic
f. Reciprocal
- Write the equation of the circle centered at (3, -9) with radius 6.
- Write the equation of the circle centered at (9, -8) with radius 11.
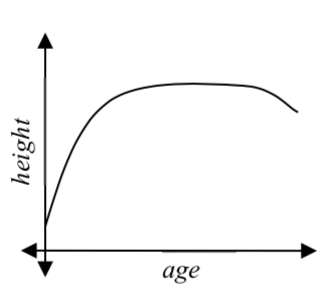
- Sketch a reasonable graph for each of the following functions. [UW] a. Height of a person depending on age.
b. Height of the top of your head as you jump on a pogo stick for 5 seconds.
c. The amount of postage you must put on a first class letter, depending on the weight of the letter. - Sketch a reasonable graph for each of the following functions. [UW]
a. Distance of your big toe from the ground as you ride your bike for 10 seconds.
b. Your height above the water level in a swimming pool after you dive off the high board.
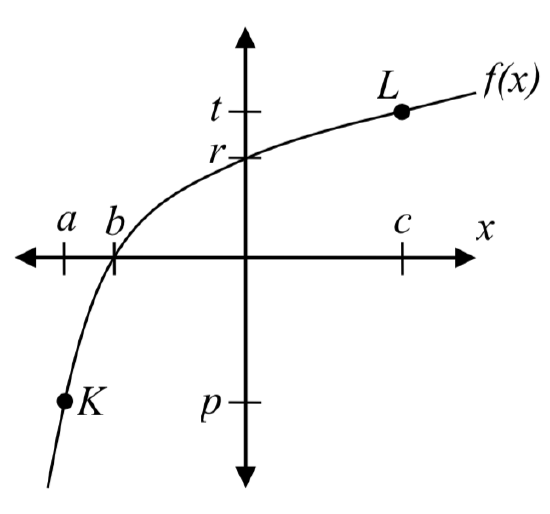
c. The percentage of dates and names you’ll remember for a history test, depending on the time you study. - Using the graph shown,
a. Evaluate \(f(c)\)
b. Solve \(f(x)=p\)
c. Suppose \(f(b)=z\). Find \(f(z)\)
d. What are the coordinates of points \(L\) and \(K\)?
- Dave leaves his office in Padelford Hall on his way to teach in Gould Hall. Below are several different scenarios. In each case, sketch a plausible (reasonable) graph of the function \(s = d(t)\) which keeps track of Dave’s distance s from Padelford Hall at time \(t\). Take distance units to be “feet” and time units to be “minutes.” Assume Dave’s path to Gould Hall is long a straight line which is 2400 feet long. [UW]
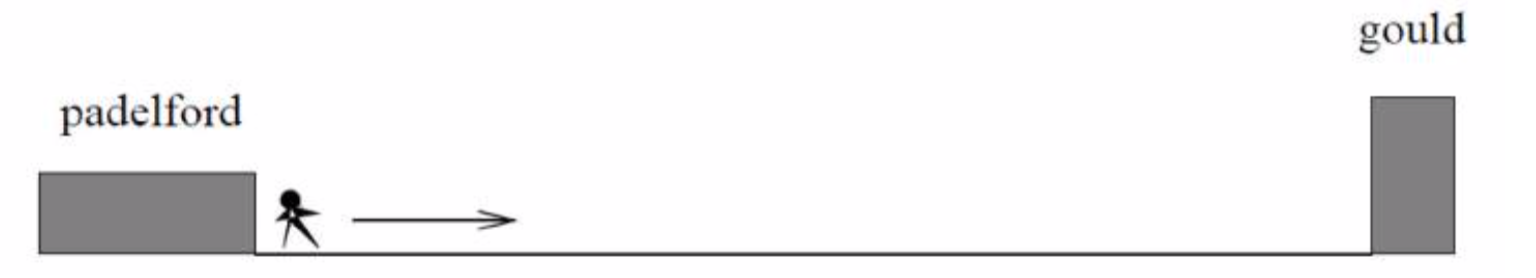
a. Dave leaves Padelford Hall and walks at a constant spend until he reaches Gould Hall 10 minutes later.
b. Dave leaves Padelford Hall and walks at a constant speed. It takes him 6 minutes to reach the half-way point. Then he gets confused and stops for 1 minute. He then continues on to Gould Hall at the same constant speed he had when he originally left Padelford Hall.
c. Dave leaves Padelford Hall and walks at a constant speed. It takes him 6 minutes to reach the half-way point. Then he gets confused and stops for 1 minute to figure out where he is. Dave then continues on to Gould Hall at twice the constant speed he had when he originally left Padelford Hall.
d. Dave leaves Padelford Hall and walks at a constant speed. It takes him 6 minutes to reach the half-way point. Then he gets confused and stops for 1 minute to figure out where he is. Dave is totally lost, so he simply heads back to his office, walking the same constant speed he had when he originally left Padelford Hall.
e. Dave leaves Padelford heading for Gould Hall at the same instant Angela leaves Gould Hall heading for Padelford Hall. Both walk at a constant speed, but Angela walks twice as fast as Dave. Indicate a plot of “distance from Padelford” vs. “time” for the both Angela and Dave.
f. Suppose you want to sketch the graph of a new function \(s = g(t)\) that keeps track of Dave’s distance s from Gould Hall at time t. How would your graphs change in (a) - (e)?
- Answer
-
1. (a) \(f(40) = 13\), because the input 40 (in thousands of people) gives the output 13 (in tons of garbage)
(b) \(f(5) = 2\), means that 5000 people produce 2 tons of garbage per week.
3. (a) In 1995 (5 years after 1990) there were 30 ducks in the lake
b. In 2000 (10 years after 1990) there were 40 ducks in the lake5. Graphs (a) (b) (d) and (e) represent \(y\) as a function of \(x\) because for every value of \(x\) there is only one value for \(y\). Graphs (c) and (f) are not functions because they contain points that have more than one output for a given input, or values for \(x\) that have 2 or more values for \(y\).
7. Tables (a) and (b) represent \(y\) as a function of \(x\) because for every value of \(x\) there is only one value for \(y\). Table (c) is not a function because for the input \(x = 10\), there are two different outputs for \(y\).
9. Tables (a) (b) and (d) represent \(y\) as a function of \(x\) because for every value of \(x\) there is only one value for \(y\). Table (c) is not a function because for the input \(x=3\), there are two different outputs for \(y\).
11. Table (b) represents \(y\) as a function of \(x\) and is one-to-one because there is a unique output for every input, and a unique input for every output. Table (a) is not one-to-one because two different inputs give the same output, and table (c) is not a function because there are two different outputs for the same input \(x=8\).
13. Graphs (b) (c) (e) and (f) are one-to-one functions because there is a unique input for every output. Graph (a) is not a function, and graph (d) is not one-to-one because it contains points which have the same output for two different inputs.
15. (a) \(f(1) = 1\), (b) \(f(3) = 1\)
17. (a) \(g(2) = 4\), (b) \(g(-3) = 2\)
19. (a) \(f(3) = 53\), (b) \(f(2) = 1\)
\(f(-2)\) \(f(-1)\) \(f(0)\) \(f(1)\) \(f(2)\) 21. 8 6 4 2 0 23. 49 18 3 4 21 25. 4 -1 0 1 -4 27. 4 4.414 4.732 5 5.236 29. -4 -6 -6 -4 0 31. 5 DNE -3 -1 -1/3 33. 1/4 1/2 1 2 4 35. a. -6
b. -1637. a. 5
b. \(-\dfrac{5}{3}\)39. a. iii
b. viii
d. ii
e. vi
f. iv
g. v
h. vii41. a. iv
b. ii
c. v
d. I
e. vi
f. iii43. \((x - 3)^2 + (y + 9)^2 = 36\)
45. a.
 b.
b. 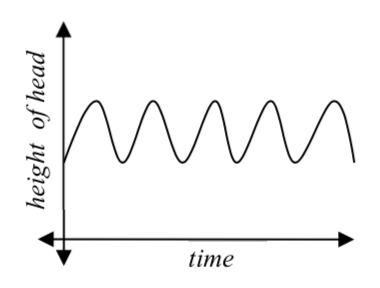 c.
c. 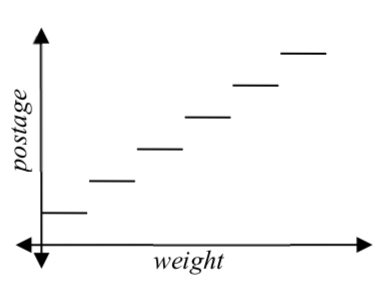
47. a. t
b. a
c. r
d. L: (c, t) and K: (a, p)