
6.2: Graphs of the Other Trig Functions


- Last updated
- Jul 13, 2022
- Save as PDF

( \newcommand{\kernel}{\mathrm{null}\,}\)
In this section, we will explore the graphs of the other four trigonometric functions. We’ll begin with the tangent function. Recall that in Chapter 5 we defined tangent as y/x or sine/cosine, so you can think of the tangent as the slope of a line through the origin making the given angle with the positive x axis.
At an angle of 0, the line would be horizontal with a slope of zero. As the angle increases towards π/2, the slo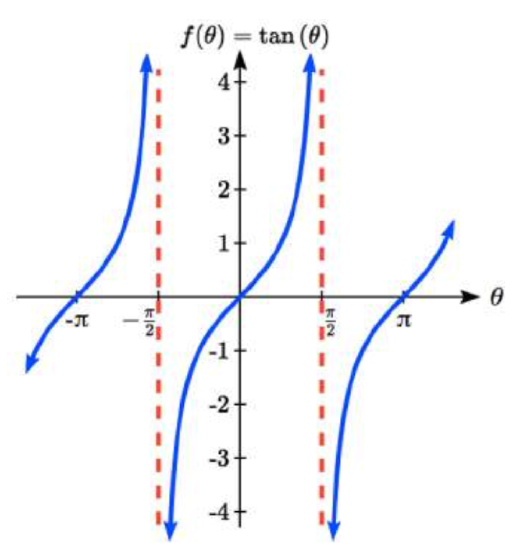 pe increases more and more. At an angle of π/2, the line would be vertical and the slope would be undefined. Immediately past π/2, the line would have a steep negative slope, giving a large negative tangent value. There is a break in the function at π/2, where the tangent value jumps from large positive to large negative.
We can use these ideas along with the definition of tangent to sketch a graph. Since tangent is defined as sine/cosine, we can determine that tangent will be zero when sine is zero: at -π, 0, π, and so on. Likewise, tangent will be undefined when cosine is zero: at -π/2, π/2, and so on.
The tangent is positive from 0 to π/2 and π to 3π/2, corresponding to quadrants 1 and 3 of the unit circle.
Using technology, we can obtain a graph of tangent on a standard grid.
Notice that the graph appears to repeat itself. For any angle on the circle, there is a second angle with the same slope and tangent value halfway around the circle, so the graph repeats itself with a period of π; we can see one continuous cycle from - π/2 to π/2, before it jumps and repeats itself.
The graph has vertical asymptotes and the tangent is undefined wherever a line at that angle would be vertical: at π/2, 3π/2, and so on. While the domain of the function is limited in this way, the range of the function is all real numbers.
FEATURES OF THE GRAPH OF TANGENT
The graph of the tangent function m(θ)=tan(θ)
- The period of the tangent function is π
- The domain of the tangent function is θ≠π2+kπ, where k is an integer
- The range of the tangent function is all real numbers, (−∞,∞)
With the tangent function, like the sine and cosine functions, horizontal stretches/compressions are distinct from vertical stretches/compressions. The horizontal stretch can typically be determined from the period of the graph. With tangent graphs, it is often necessary to determine a vertical stretch using a point on the graph.
Example 6.2.1
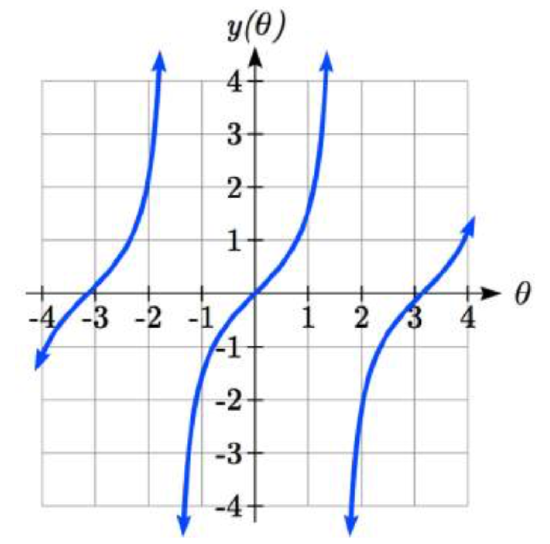
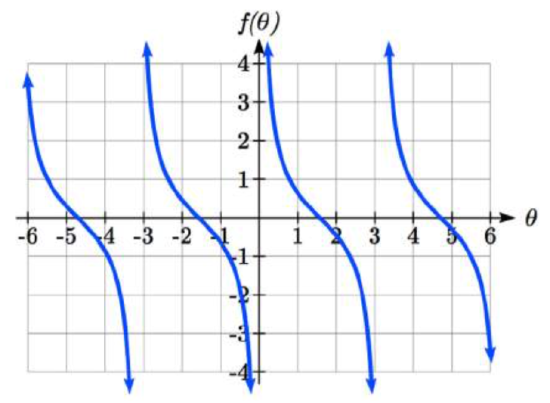
Find a formula for the function graphed here.
Solution
The graph has the shape of a tangent function, however the period appears to be 8. We can see one full continuous cycle from -4 to 4, suggesting a horizontal stretch. To stretch π to 8, the input values would have to be multiplied by8π. Since the constant k in f(θ)=atan(kθ)is the reciprocal of the horizontal stretch 8π, the equation must have form
f(θ)=atan(π8θ).
We can also think of this the same way we did with sine and cosine. The period of the tangent function is π but it has been transformed and now it is 8; remember the ratio of the “normal period” to the “new period” is π8and so this becomes the value on the inside of the function that tells us how it was horizontally stretched.
To find the vertical stretch a, we can use a point on the graph. Using the point (2, 2)
2=atan(π8⋅2)=atan(π4) Since tan(π4)=1,a=2
This function would have a formulaf(θ)=2tan(π8θ)
Exercise 6.2.1
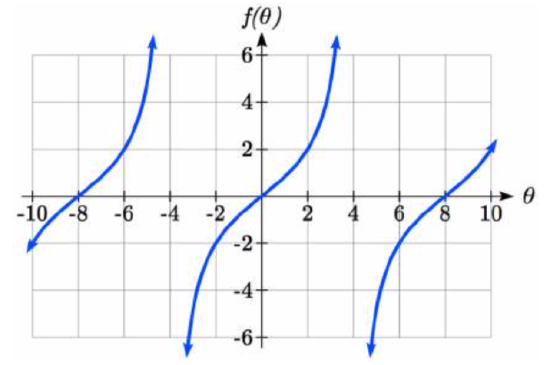
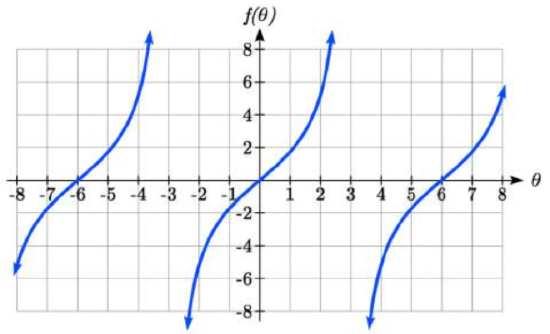
Sketch a graph of f(θ)=3tan(π6θ).
- Answer
-
For the graph of secant, we remember the reciprocal identity where sec(θ)=1cos(θ). Notice that the function is undefined when the cosine is 0, leading to a vertical asymptote in the graph at π/2/, 3π/2, etc. Since the cosine is always no more than one in absolute value, the secant, being the reciprocal, will always be no less than one in absolute value. Using technology, we can generate the graph. The graph of the cosine is shown dashed so you can see the relationship.
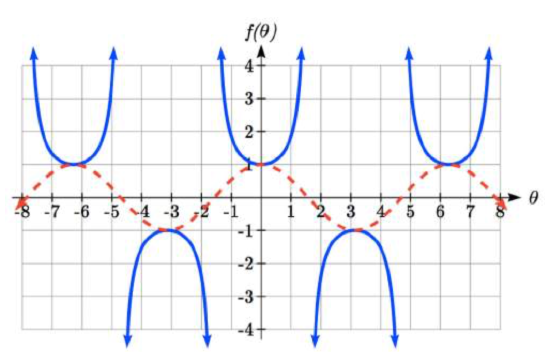
f(θ)=sec(θ)=1cos(θ)
The graph of cosecant is similar. In fact, since sin(θ)=cos(π2−θ), it follows that csc(θ)=sec(π2−θ), suggesting the cosecant graph is a horizontal shift of the secant graph. This graph will be undefined where sine is 0. Recall from the unit circle that this occurs at 0, π, 2π, etc. The graph of sine is shown dashed along with the graph of the cosecant.
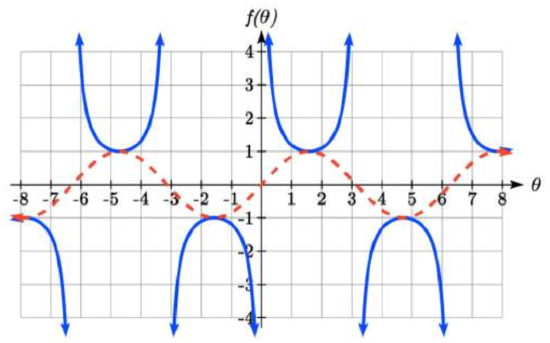
f(θ)=csc(θ)=1sin(θ)
FEATURES OF THE GRAPH OF SECANT AND COSECANT
The secant and cosecant graphs have period 2π like the sine and cosine functions.
- Secant has domain θ≠π2+kπ, where k is an integer
- Cosecant has domain θ≠kπ, where k is an integer
- Both secant and cosecant have range of (−∞,−1]⋃[1,∞)
Example 6.2.2
Sketch a graph of f(θ)=2csc(π2θ)+1. What is the domain and range of this function?
Solution
The basic cosecant graph has vertical asymptotes at the integer multiples of π. Because of the factor π2 inside the cosecant, the graph will be compressed by 2π, so the vertical asymptotes will be compressed to θ=2π⋅kπ=2k. In other words, the graph will have vertical asymptotes at the integer multiples of 2, and the domain will correspondingly be θ≠2k, where k is an integer.
The basic sine graph has a range of [-1, 1]. The vertical stretch by 2 will stretch this to [-2, 2], and the vertical shift up 1 will shift the range of this function to [-1, 3].
The basic cosecant graph has a range of (−∞,−1]⋃[1,∞). The vertical stretch by 2 will stretch this to (−∞,−2]⋃[2,∞), and the vertical shift up 1 will shift the range of this function to (−∞,−1]⋃[3,∞).
The resulting graph is shown to the right.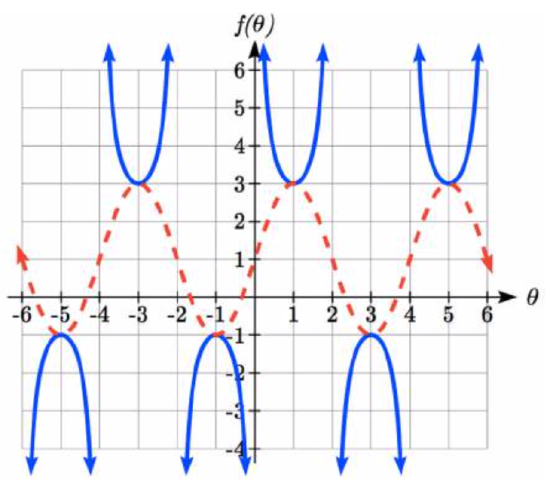
Notice how the graph of the transformed cosecant relates to the graph of f(θ)=2sin(π2θ)+1 shown dashed.
Exercise 6.2.2
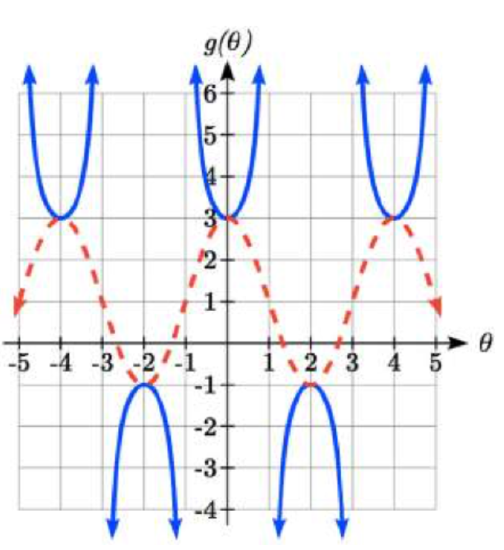
Given the graph of f(θ)=2cos(π2θ)+1 shown, sketch the graph of g(θ)=2sec(π2θ)+1 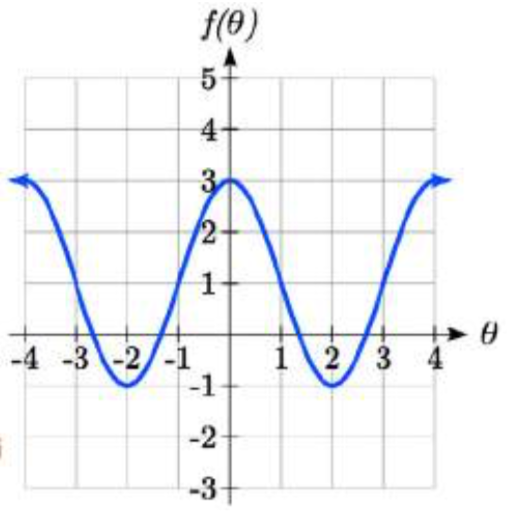 on the same axes.
- Answer
-
Finally, we’ll look at the graph of cotangent. Based on its definition as the ratio of cosine to sine, it will be undefined when the sine is zero: at at 0, π, 2π, etc. The resulting graph is similar to that of the tangent. In fact, it is a horizontal flip and shift of the tangent function, as we’ll see shortly in the next example.
FEATURES OF THE GRAPH OF COTANGENT
- The cotangent graph has period π
- Cotangent has domain θ≠kπ, where k is an integer
- Cotangent has range of all real numbers, (−∞,∞)
In Section 6.1, we determined that the sine function was an odd function and the cosine was an even function by observing the graph and establishing the negative angle identities for cosine and sine. Similarly, you may notice from its graph that the tangent function appears to be odd. We can verify this using the negative angle identities for sine and cosine:
tan(−θ)=sin(−θ)cos(−θ)=−sin(θ)cos(θ)=−tan(θ)
The secant, like the cosine it is based on, is an even function, while the cosecant, like the sine, is an odd function.
NEGATIVE ANGLE IDENTITIES TANGENT, COTANGENT, SECANT AND COSECANT
tan(−θ)=−tan(θ)
cot(−θ)=−cot(θ)
sec(−θ)=sec(θ)
csc(−θ)=−csc(θ)
Example 6.2.3
Prove that tan(θ)=−cot(θ−π2).
Solution
tan(θ)Using the definition of tangent
=sin(θ)cos(θ)Using the cofunction identities
=cos(π2−θ)sin(π2−θ)Using the definition of cotangent
=cot(π2−θ)Factoring a negative from the inside
=cot(−(θ−π2))Using the negative angle identity for cot
=−cot(θ−π2)
Important Topics of This Section
- The tangent and cotangent functions
- Period
- Domain
- Range
- The secant and cosecant functions
- Period
- Domain
- Range
- Transformations
- Negative Angle identities