
2.2: Graphs of Sinusoidal Functions


( \newcommand{\kernel}{\mathrm{null}\,}\)
Focus Questions
The following questions are meant to guide our study of the material in this section. After studying this section, we should understand the concepts mo- tivated by these questions and be able to write precise, coherent answers to these questions.
Let A,B,C, and D be constants with B>0 and consider the graph of f(t)=Asin(B(t−C))+D or f(t)=Acos(B(t−C))+D.
- How does the value of A affect the graph of f? How is A related to the amplitude of f?
- How does the value of B affect the graph of f? How is B related to the period of f?
- How does the value of C affect the graph of f?
- How does the value of D affect the graph of f?
- What does a phase shift do to a sine or cosine graph? How do we recognize a phase shift from the equation of the sinusoid?
- How do we accurately draw the graph of f(t)=Asin(B(t−C))+D or f(t)=Acos(B(t−C))+D without a calculator and how do we correctly describe the effects of the constants A,B,C, and D on the graph?
Beginning Activity
In this section, we will study the graphs of functions whose equations are f(t)=Asin(B(t−C))+D and f(t)=Acos(B(t−C))+D where A,B,C, and D are real numbers. These functions are called sinusoidal functions and their graphs are called sinusoidal waves. We will first focus on functions whose equations are y=sin(Bt) and y=cos(Bt). Now complete Part 1 or Part 2 of this beginning activity.
Part 1 – Using a Geogebra Applet
To begin our exploration, we will use a Geogebra applet called Period of a Sinusoid. The web address for this applet is http://gvsu.edu/s/LY
After you open the applet, notice that there is an input box at the top of the screen where you can input a function. For now, leave this set at g(t)=sin(t). The graph of the sine function should be displayed. The slider at the top can be used to change the value of B . When this is done, the graph of y=Asin(t) will be displayed for the current value of B along with the graph of y=sin(t).
- Use the slider to change the value of B. Explain in detail the difference between the graph of y=g(t)=sin(t) and y=f(t)=sin(Bt) for a constant B>0. Pay close attention to the graphs and determine the period when (a)B=2 (b)B=3 (c)B=4 (d)B=0.5. In particular, how does the period of y=sin(Bt) appear to depend on B? Note: Consider doing two separate cases: one when B>1 and the other when 0<B<1.
- Now click on the reset button in the upper right corner of the screen. This will reset the value of the B to its initial setting of B=1.
- Change the function to g(t)=cos(t)and repeat part (1) for the cosine function. Does changing the value of B affect the graph of y=cos(Bt) in the same way that changing the value for B affects the graph of t=sin(Bt)?
Part 2 – Using a Graphing Utility
Make sure your graphing utility is set to radian mode. Note: Most graphing utilities require the use of x (or X ) as the independent variable (input) for a function. We will use x for the independent variable when we discuss the use of a graphing utility.
- We will first examine the graph of y=sin(Bx) for three different values of B. Graph the three functions: y=sin(x) y=sin(2x) y=sin(4x) using the following settings for the viewing window: 0≤x≤4π and −1.5≤y≤1.5. If possible on your graphing utility, set it so that the tickmarks on the x-axis are space at π2 units. Examine these graphs closely and determine period for each sinusoidal wave. In particular, how does the period of y=sin(Bx) appear to depend on B?
- Clear the graphics screen. We will now examine the graph of y=sin(Bx) for three different values of B. Graph the following three functions: y=sin(x) y=sin(12x) y=sin(14x) using the following settings for the viewing window: 0≤x≤π and −1.5≤y≤1.5 If possible on your graphing utility, set it so that the tickmarks on the x-axis are spaced at π2 units. Examine these graphs closely and determine period for each sinusoidal wave. In particular, how does the period of y=sin(Bx) appear to depend on B?
- How does the graph of y=sin(Bx) appear to be related to the graph of y=sin(x). Note: Consider doing two separate cases: one when B>1 and the other when 0<B<1.
The Period of a Sinusoid
When we discuss an expression such as sin(t) or cos(t), we often refer to the expression inside the parentheses as the argument of the function. In the beginning activity, we examined situations in which the argument was Bt for some number B. We also saw that this number affects the period of the sinusoid. If we examined graphs close enough, we saw that the period of y=sin(Bt) and y=cos(Bt) is equal to 2πB. The graphs in Figure 2.11 illustrate this.
Notice that the graph of y=sin(2t) has one complete cycle over the interval [0,π] and so its period is π=2π2. The graph of y=sin(4t) has one complete cycle over the interval [0,π2] and so its period is π2=2π4. In these two cases, we had B>1 in y=sin(Bt). Do we get the same result when 0<B<1? Figure 2.12 shows graphs for y=sin(12t) and y=sin(14t)?
Notice that the graph of y=sin(12t) has one complete cycle over the interval [0,4π]
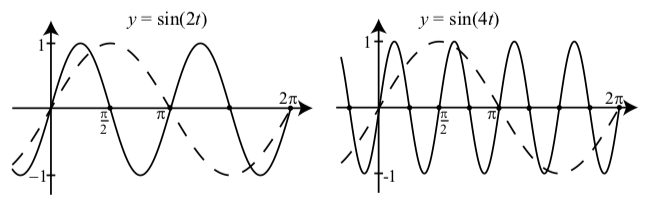
Figure 2.2.1: Graphs of y=sin(2t) and y=sin(4t). The graph of y=sin(t) is also shown (dashes).
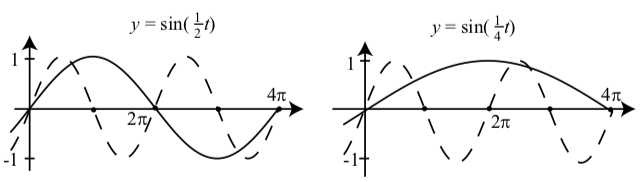
Figure 2.2.2: Graphs of y=sin(12t) and y=sin(14t). The graph of y=sin(t) is also shown (dashes).
The period of y=sin(12t) is 4π=2π12.
The graph of y=sin(14t) has one-half of a complete cycle over the interval [0,4π] and so the period of y=sin(14t) is 8π=2π14.
A good question now is, “Why are the periods of y=sin(Bt) and y=cos(Bt) equal to 2πB?” The idea is that when we multiply the independent variable t by a constant B, it can change the input we need to get a specific output. For example, the input of t=0 in y=sin(t) and y=sin(Bt) yield the same output. To complete one period in y=sin(Bt) we need to go through interval of length 2π so that our input is 2π. However, in order for the argument (Bt) in y=sin(Bt) to be 2π, we need Bt=2π and if we solve this for t, we get t=2πB. So the function given by y=sin(Bt) (or y=cos(Bt)) will complete one complete cycle when t varies from t=0 to t=2πB, and hence, the period is 2πB. Notice that if we use y=Asin(Bt) or y=Acos(Bt), the value of A only affects the amplitude of the sinusoid and does not affect the period.
If A is a real number and B is a positive real number, then the period of the functions given by y=Asin(Bt)and y=Acos(Bt) is 2πB.
Exercise 2.2.1
- Determine the amplitude and period of the following sinusoidal functions.: (a)y=3cos(13t) (b)y=−2sin(π2t)
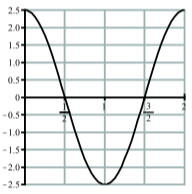
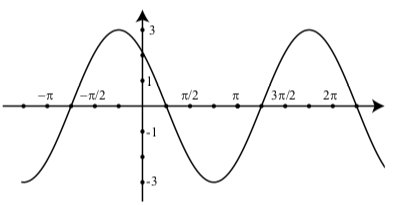
- The graph below is a graph of a sinusoidal function. Determine an equation for this function.
- Answer
-
1. (a) For y=3cos(13t), the amplitude is 3 and the period is 2π13=6π
(b) For y=−2sin(π2t),the amplitude is 2 and the period is 2πpi2=4.
2. From the graph, the amplitude is 2.5 and the period is 2. Using a cosine function, we have A=2.5 and 2πB=2. Solving for B gives B=π. So an equation is y=2.5cos(πt).
Phase Shift
We will now investigate the effect of subtracting a constant from the argument (independent variable) of a circular function. That is, we will investigate what effect the value of a real number C has the graph of y=sin(t−C) and y=cos(t−C).
Activity 2.10 (The Graph of y=sin(t−C))
Complete Part 1 or Part 2 of this activity.
Part 1 – Using a Geogebra Applet
We will use a Geogebra applet called Sinusoid – Phase Shift. The web address for this applet is http://gvsu.edu/s/Mu
After you open the applet, notice that there is an input box at the top of the screen where you can input a function. For now, leave this set at g(t)=sin(t). The graph of the sine function should be displayed. The slider at the top can be used to change the value of C. When this is done, the graph of y=Asin(t−C) will be displayed for the current value of C along with the graph of y=sin(t).
- Use the slider to change the value of C. Explain in detail the difference between the graph of y=g(t)=sin(t) and y=f(t)=sin(t−C) for a constant C. Pay close attention to the graphs and determine the horizontal shift when (a)C=1 (b)C=2 (c)C=3 (d)C=−1 (e)C=−2 (f)C=−3. In particular, describe the difference between the graph of y=sin(t−C) and the graph of y=sin(t)? Note: Consider doing two separate cases: one when C>0 and the other when C<0.
- Now click on the reset button in the upper right corner of the screen. This will reset the value of the C to its initial setting of C=0.
- Change the function to g(t)=cos(t) and repeat part (1) for the cosine function. Does changing the value of C affect the graph of y=cos(t−C) affect the sinusoidal wave in the same way that changing the value for C affects the graph of y=sin(t−C)?
Part 2 – Using a Graphing Utility
Make sure your graphing utility is set to radian mode.
- We will first examine the graph of y=sin(t−C) for two different values of C. Graph the three functions: y=sin(x) y=sin(x−1) y=sin(x−2) using the following settings for the viewing window: 0≤x≤4π and −1.5≤y≤1.5. Examine these graphs closely and describe the difference between the graph of y=sin(x−C) and the graph of y=sin(x) for these values of C .
- Clear the graphics screen. We will now examine the graph of y=sin(x−C) for two different values of C. Graph the following three functions: y=sin(x) y=sin(x+1)=sin(x−(−1)) y=sin(x) y=sin(x+2)=sin(x−(−2)) using the following settings for the viewing window: 0≤x≤π and −1.5≤y≤1.5. Examine these graphs closely and describe the difference between the graph of y=sin(t−C) and the graph of y=sin(t) for these values of C.
- Describe the difference between the graph of y=sin(x−C) and the graph of y=sin(x)? Note: Consider doing two separate cases: one when C>0 and the other when C<0.
By exploring the graphs in Activity 2.10, we should notice that when C>0, the graph of y=sin(t−C) is the graph of y=sin(t) horizontally translated to the right by C units. In a similar manner, the graph of y=cos(t−C) is the graph of y=cos(t) horizontally translated to the right by C units. When working with a sinusoidal graph, such a horizontal translation is called a phase shift. This is illustrated in Figure 2.13 , which shows the graphs of y=sin(t) and y=sin(t−π2). For reference, the graph of y=sin(t) is also shown.
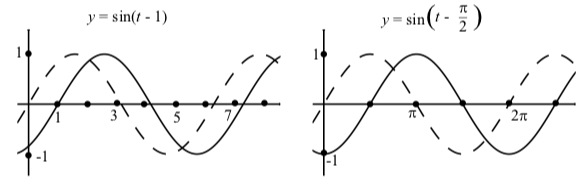
Figure 2.2.3: Graphs of y=sin(t−1) and y=sin(t−π2). The graph of y=sin(t) is also shown (dashes).
So, why are we seeing this phase shift? The reason is that the graph of y=sin(t) will go through one complete cycle over the interval defined by 0≤t≤2π. Similarly, the graph of y=sin(t−C) will go through one complete cycle over the interval defined by 0≤t−C≤2π. Solving for t, we see that C≤t≤2π+C. So we see that this cycle for y=sin(t) has been shifted by C units.
This argument also works when C<0 and when we use the cosine function instead of the sine function. Figure 2.14 illustrates this with y=cos(t−(−1)) and y=cos(t−(−π2)). Notice that we can rewrite these two equations as follows: y=cos(t−(−1)) y=cos(t+1)) y=cos(t−(−π2)) y=cos(t+π2)
We summarize the results for phase shift as follows:
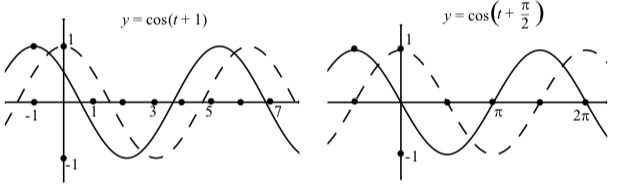
Figure 2.2.4: Graphs of y=cos(t+1)) and y=cos(t+π2). The graph of y=cos(t) is also shown (dashes).
For y=sin(t−C) and y=cos(t−C), where C is any nonzero real number:
- The graph of y=sin(t) (or y=cos(t)) is shifted horizontally |C| units. This is called the phase shift of the sinusoid.
- If C>0, the graph of y=sin(t) (or y=cos(t)) is shifted horizontally C units to the right. That is, there is a phase shift of C units to the right.
- If C<0, the graph of y=sin(t) (or y=cos(t)) is shifted horizontally C units to the left. That is, there is a phase shift of C units to the left.
Exercise 2.2.2
- Determine the amplitude and phase shift of the following sinusoidal functions. (a)y=3.2(sin(t−π3)) (b)y=4cos(t+π6)
- The graph below is a graph of a sinusoidal function (a) Determine an equation for this function. (b) Determine a second equation for this function.
- Answer
-
1. (a) For y=3.2(sin(t−π3)), the amplitude is 3.2 and the phase shift is π3
(b) For y=4cos(t+π6), notice that y=4cos(t−(−π6)). So the amplitude is 4 and the phase shift is −π6.2. There are several possible equations for this sinusoid. Some of these equations are:
y=3sin(t+3π4)
y=−3sin(t−π4)
y=3cos(t+π4)
y=−3cos(t−3π4)
A graphing utility can be used to verify that any of these equations produce the given graph.
Vertical Shift
We have one more transformation of a sinusoid to explore, the so-called vertical shift. This is one by adding a constant to the equation for a sinusoid and is explored in the following activity.
Activity 2.12 (The Vertical Shift of a Sinusoid)
Complete Part 1 or Part 2 of this activity.
Part 1 – Using a Geogebra Applet
We will now investigate the effect of adding a constant to a sinusoidal function. That is, we will investigate what effect the value of a real number D has the graph of y=Asin(B(t−C))+D and y=Acos(B(t−C))+D. Complete Part 1 or Part 2 of this activity. We will use a Geogebra applet called Exploring a Sinusoid. The web address for this applet is http://gvsu.edu/s/LX
After you open the applet, notice that there is an input box at the top of the screen where you can input a function. For now, leave this set at g(t)=sin(t). The graph of the sine function should be displayed. There are four sliders at the top that can be used to change the values of A,B,C, and D.
1. Leave the values A=1,B=1 and C=0 set. Use the slider for D to change the value of C. When this is done, the graph of y=sin(t)+D will be displayed for the current value of D along with the graph of y=sin(t).
(a)Use the slider to change the value of D. Explain in detail the difference between the graph of y=g(t)=sin(t) and y=f(t)=sin(t)+D for a constant D. Pay close attention to the graphs and determine the vertical shift when i.D=1. ii.D=2. iii.D=3. iv.D=−1. v.D=−2. vi.D=−3. In particular, describe the difference between the graph of y=sin(t)+D and the graph of y=sin(t)? Note: Consider doing two separate cases: one when D>0 and the other when D<0.
(b)Now click on the reset button in the upper right corner of the screen. This will reset the value of the C to its initial setting of C=0.
(c)Change the function to g(t)=cos(t) and repeat part (1) for the cosine function. Does changing the value of D affect the graph of y=cos(t)+D affect the sinusoidal wave in the same way that changing the value for D affects the graph of y=sin(t)+D ?
2. Now change the value of A to 0.5, the value of B to 2, and the value of C to 0.5. The graph of g(t)=cos(t) will still be displayed but we will now have f(t)=0.5cos(2(t−0.5))+D. Does changing the value of D affect the graph of y=0.5cos(2(t−0.5))+D affect the sinusoidal wave in the same way that changing the value for D affects the graph of y=cos(t)?
Part 2 – Using a Graphing Utility
Make sure your graphing utility is set to radian mode.
- We will first examine the graph of y=cos(t)+D for four different values of D. Graph the five functions: y=cos(x) y=cos(x)+1 y=cos(x)−1 y=cos(x)+2 y=cos(x)−2 using the following settings for the viewing window: 0≤x≤2π and −3≤y≤3. Examine these graphs closely and describe the difference between the graph of y=cos(x)+D and the graph of y=cos(x) for these values of D.
- Clear the graphics screen. We will now examine the graph of y=0.5cos(2(x−0.5)) for two different values of D. Graph the following three functions: y=0.5cos(2(x−0.5)) y=0.5cos(2(x−0.5))+2 y=0.5cos(2(x−0.5))−2 using the following settings for the viewing window: 0≤x≤2π and −3≤y≤3. Examine these graphs closely and describe the difference between the graph of y=0.5cos(2(x−0.5))+D and the graph of y=0.5cos(2(x−0.5)) for these values of D.
By exploring the graphs in Activity 2.12, we should notice that the graph of something like y=Asin(B(t−C))+D is the graph of y=Asin(B(t−C)) shifted up D units when D>0 and shifted down |D| units when D<0. When working with a sinusoidal graph, such a vertical translation is called a vertical shift. This is illustrated in Figure 2.15 for a situation in which D>0.
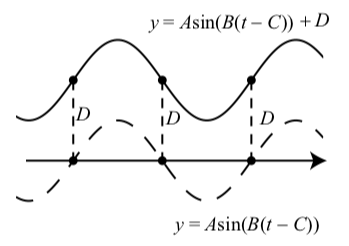
Figure 2.2.5: Graphs of y=Asin(B(t−C)) (dashes) and y=Asin(B(t−C))+D (solid) for D>0.
The y-axis is not shown in Figure 2.2.5 because this shows a general graph with a phase shift.
What we have done in Activity 2.12 is to start with a graph such as y=Asin(B(t−C)) and added a constant to the dependent variable to get y=Asin(B(t−C))+D. So when t stays the same, we are adding D to the the dependent variable. The effect is to translate the entire graph up by D units if D>0 and down by |D| units if D<0.
Amplitude, Period, Phase Shift, and Vertical Shift
The following is a summary of the work we have done in this section dealing with amplitude, period, phase shift, and vertical shift for a sinusoidal function.
Let A,B,C, and D be nonzero real numbers with B>0. For y=Asin(B(t−C))+D and y=Acos(B(t−C))+D
The amplitude of the sinusoidal graph is |A|.
- If |A|>1, then there is a vertical stretch of the pure sinusoid by a factor of |A|.
- If |A|>1, then there is a vertical contraction of the pure sinusoid by a factor of |A|.
The period of the sinusoidal graph is 2π.
- When B>1, there is a horizontal compression of the graphs.
- When 0<B<1, there is a horizontal stretches of the graph.
The phase shift of the sinusoidal graph is |C|.
- If C>0, there is a horizontal shift of C units to the right.
- If C<0, there is a horizontal shift of |C| units to the left.
The vertical shift of the sinusoidal graph is |D|.
- If D>0, the vertical shift is D units up.
- If D<0, the vertical shift is |D| units down.
Example 2.2.1: The Graph of a Sinusoid
This example will illustrate how to use the characteristics of a sinusoid and will serve as an introduction to the more general discussion that follows. The graph of y=3sin(4(t−π8))+2 will look like the following: Notice that the axes have not yet been drawn. We want to state the coordinates of the points P,Q,R,S, and T. There are several choices but we will make the point P as close to the origin as possible. Following are the important characteristics of this sinusoid:
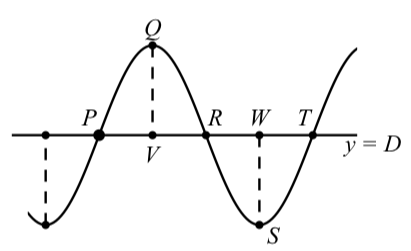
Figure 2.2.6: Graph of a Sinusoid
- The phase shift is π8.
- The amplitude is 3.
- The period is 2π4=π2
- The vertical shift is 2.
So for the graph in Figure 2.2.6, we can make the following conclusions.
- Since the vertical shift is 2, the horizontal line that is the center line of the sinusoid is y=2.
- Since the phase shift is π8 and this is a sine function, the coordinates of P are (π8,2).
- Since the period is π2, the t-coordinate of R is π8+12(π2)=3π8. So the coordinates of R are (3π8,2).
- Since the period is π2, the t-coordinate of T is π8+π2=5π8. So the coordinates of R are (5π8,2).
- Since the period is π2, the t-coordinate of Q is π8+14(π2)=π4.Also, since the amplitude is 3, the y-coordinate of Q is 2+3=5. So the coordinates of Q are (π4,5).
- Since the period is π2, the t-coordinate of S is π8+34(π2)=π2.Also, since the amplitude is 3, the y-coordinate of S is 2−3=−1. So the coordinates of S are (π2,−1).
We can verify all of these results by using a graphing utility to draw the graph of y=3sin(4(t−π8))+2 using 0≤t≤5π8 and −2 leqy≤6. If the utility allows, set the t-scale to one-quarter of a period, which is π8.
Important Notes about Sinusoids
- For y=Asin(B(t−C))+D and y=Acos(B(t−C))+D, the amplitude, the period, and the vertical shift will be the same.
- The graph for both functions will look like that shown in Figure 2.2.7. The difference between y=Asin(B(t−C))+D and y=Acos(B(t−C))+D will be the phase shift.
- The horizontal line shown is not the t-axis. It is the horizontal line y=D, which we often call the center line for the sinusoid.
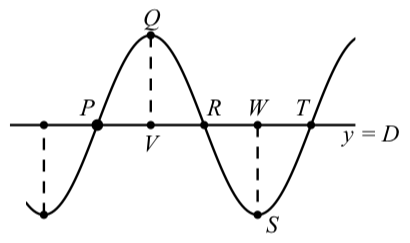
Figure 2.2.7: Graph of a Sinusoid
So to use the results about sinusoids and Figure 2.2.7, we have:
1. The amplitude, which we will call amp, is equal to the lengths of the segments QV and WS.
- The period, which we will call per, is equal to 2πB. In addition, the length of the segments PV,VR,RW, and WT are equal to 14per.
- For y=Asin(B(t−C))+D, we can use the point P for the phase shift. So the t-coordinate of the point P is C and P has coordinates (C,D). We can determine the coordinates of the other points as need by using the amplitude and period. For example:
The point Q has coordinates (C+14per,D+amp)
The point R has coordinates (C+12per,D)
The point S has coordinates (C+34per,D−amp)
The point T has coordinates (C+per,D)
- For y=Acos(B(t−C))+D, we can use the point Q for the phase shift. So the t-coordinate of the point Q is C and Q has coordinates (C,D+amp). We can determine the coordinates of the other points as need by using the amplitude and period. For example:
The point P has coordinates (C−14per,D)
The point R has coordinates (C+14per,D)
- The point S has coordinates (C+12per,D−amp)
The point T has coordinates (C+34per,D)
Please note that it is not necessary to try to remember all of the facts in items (3) and (4). What we should remember is how to use the concepts of one-quarter of a period and the amplitude illustrated in items (3) and (4). This will be done in the next two progress checks, which in reality are guided examples.
Exercise 2.2.3
The characteristics of a sinusoid can be helpful in setting an appropriate viewing window when producing a useable graph of a sinusoid on a graphing utility. This is especially true when the period is small or large. For example, consider the sinusoidal function y=6.3cos(50π(t+0.01))+2
1. What is the amplitude?
2. What is the phase shift?
3. What is the period?
4. What is the vertical shift?
5. Use this information to determine coordinates for the point Q in the following diagram.

6. Now determine the coordinates of points P,R,S, and T.
7. Use this information and a graphing utility to draw a graph of (slightly more than) one period of this sinusoid that shows the points P,Q, and T.
- Answer
-
- The amplitude is 6.3.
- The period is 2π50π=125
- We write y=6.3cos(50π(t−(−0.01)))+2 and see that the phase shift is −0.01 or 0.01 units to the left.
- The vertical shift is 2.
- Because we are using a cosine and the phase shift is −0.01, we can use −0.01 as the t-coordinate of Q. The y-coordinate will be the vertical shift plus the amplitude. So the y-coordinate is 8.3. Point Q has coordinates (−0.01,8.3)
- We now use the fact that the horizontal distance between P and Q is one-quarter of a period. Since the period is 125=0.04, we see that one-quarter of a period is 0.01. The point P also lies on the center line, which is y=2. So the coordinates of P are (−0.02,2).
We now use the fact that the horizontal distance between Q and R is one-quarter of a period. The point R is on the center line of the sinusoid and so R has coordinates (0,2).
The point S is a low point on the sinusoid. So its y-coordinate will be D minus the amplitude, which is 2−6.3=−4.3. Using the fact that the horizontal distance from R to S is one-quarter of a period, the coordinates of S are (0.01,−4.3). Since the point T is on the center line and the horizontal distance from S to T is one-quarter of a period, the coordinates of T are (0.03,2).
7. We will use a viewing window that is one-quarter of a period to the left of P and one-quarter of a period to the right of T. So we will use \(-0.03
leq t \leq 0.03\). Since the maximum value is 8.3 and the minimum value is −4.3, we will use −5≤y≤9.
Exercise 2.2.4
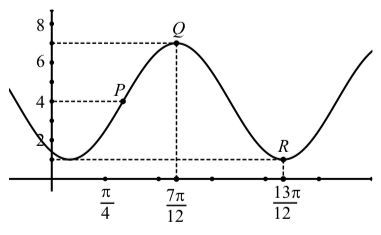
We will determine two equations for the sinusoid shown in Figure 2.2.8.
- Determine the coordinates of the points Q and R. The vertical distance between these two points is equal to two times the amplitude. Use the y-coordinates of these points to determine two times the amplitude and then the amplitude.
- The center line for the sinusoid is half-way between the high point Q and the low point R. Use the y-coordinates of Q and R to determine the center line y=D. This will be the vertical shift.
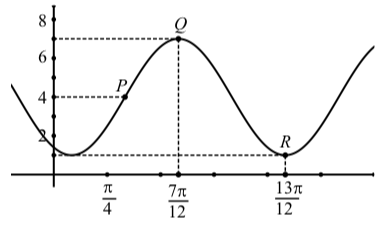
Figure 2.2.8: The Graph of a Sinusoid
- The horizontal distance between Q and R is equal to one-half of a period. Use the t-coordinates of Q and R to determine the length of one-half of a period and hence, the period. Use this to determine the value of B.
- We will now find an equation of the form y=Acos(B(t−C))+D. We still need the phase shift C. Use the point Q to determine the phase shift and hence, the value of C. We now have values for A,B,C, and D for the equation y=Acos(B(t−C))+D.
- To determine an equation of the form y=Asin(B(t−C′))+D., we will use the point P to determine the phase shift C′. (A different symbol was used because C′ will be different than C in part (4).) Notice that the y-coordinate of P is 4 and so P lies on the center line. We can use the fact that the horizontal distance between P and Q is equal to one-quarter of a period. Determine the t coordinate of P, which will be equal to C′. Now write the equation y=Asin(B(t−C′))+D. using the values of A,B,C′, and D that we have determined.
We can check the equations we found in parts (4) and (5) by graphing these equations using a graphing utility.
- Answer
-
1. The coordinates of Q are (7π12,7) and the coordinates of R are (13π12,1). So two times the amplitude is 7−1=6 and the amplitude is 3.
2. We add the amplitude to the lowest y-value to determine D. This gives D=1+3=4 and the center line is y=4.
3. The horizontal distance between Q and R is 13π12−7π12=6π12. So we see that one-half of a period is π2 and the period is π. So B=2ππ=2.
4. For y=Acos(B(t−c))+D, we can use the point Q to determine a phase shift of 7π12. So an equation for this sinusoid is y=3cos(2(t−7π12))+4.
5. The point P is on the center line and so the horizontal distance between P and Q is one-quarter of a period. So this horizontal distance is π4 and the t-coordinate of P is 7π12−π4=4π12=π3.
This can be the phase shift for y=Asin(B(t−C′))+D. So another equation for this sinusoid is y=3sin(2(t−π3))+4
Summary
In this section, we studied the following important concepts and ideas: For a sinusoidal function of the form f(t)=Asin(B(t−C))+D or f(t)=Acos(B(t−C))+D where A,B,C,and D are real numbers with B>0:
- The value of |A| is the amplitude of the sinusoidal function.
- The value of B determines the period of the sinusoidal function. the period is equal to 2π.
- The value of C is the phase shift (horizontal shift) of the sinusoidal function. The graph is shifted to the right if C>0 and shifted to the left if C<0.
- The value of D is the vertical shift of the sinusoid. The horizontal line y=D is the so-called center line for the graph of the sinusoidal function.
- The important notes about sinusoids on page 103.