
3.2: Graphs and Sociograms

( \newcommand{\kernel}{\mathrm{null}\,}\)
There are lots of different kinds of "graphs." Bar-charts, pie-charts, line and trend charts, and many other things are called graphs and/or graphics. Network analysis uses (primarily) one kind of graphic display that consists of points (or nodes) to represent actors and lines (or edges) to represent ties or relations. When sociologists borrowed this way of graphing things from the mathematicians, they re-named their graphics "socio-grams." Mathematicians know the kind of graphic displays by the names of "directed graphs" "signed graphs" or simply "graphs."
There are a number of variations on the theme of socio-grams, but they all share the common feature of using a labeled circle for each actor in the population we are describing, and line segments between pairs of actors to represent the observation that a tie exists between the two. Let's suppose that we are interested in summarizing who nominates whom as being a "friend" in a group of four people (Bob, Carol, Ted, and Alice). We would begin by representing each actor as a "node" with a label (sometimes notes are represented by labels in circles or boxes). Figure 3.1 shows a graph with four labeled nodes, but no connections.

Figure 3.1. Nodes for a simple graph
In this example, we've also indicated an "attribute" of each actor by coloring the node (black for males, red for females). Coloring, shading, or different shapes and sizes are often used to represent attributes of the individual nodes.
We collected our data about friendship ties by asking each member of the group (privately and confidentially) who they regarded as "close friends" from a list containing each of the other members of the group. Each of the four people could choose none to all three of the others as "close friends." As it turned out, in our (fictitious) case, Bob chose Carol and Ted, but not Alice; Carol chose only Ted; Ted chose Bob and Carol and Alice; and Alice chose only Ted. We would represent this information by drawing an arrow from the chooser to each of the chosen, as in figure 3.2.

Figure 3.2. A directed graph of friendship ties
To reduce visual clutter, a double-headed arrow has been used when the relationship between two node is "reciprocated" (i.e. each actor chooses the other).
Let's suppose that we had also taken note of a second kind of relation - whether persons share the relationship "spouse" with one another. In our example, Bob and Carol are spouses, as are Ted and Alice. We can also represent this kind of a "bonded tie" with a directed graph as in figure 3.3.

Figure 3.3. A directed graph of spousal ties
Where a tie is necessarily reciprocated (see the discussion of "bonded ties, below), a "simple" graph is often used instead of a "directed" graph. In a simple graph, relations are simply present of absent, and the relations are indicated by lines without arrow heads.
We can also represent multiple relations (multiplex relations) using graphs -- though with larger numbers of actors or many relations, the results may not be very easy to read. Let's combine the graphs of both "friendship" and "spousal" relations, as in figure 3.4.
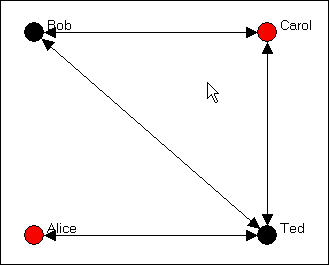
Figure 3.4. A directed graph of multiplex relations (friendship and spouse)
In this figure, a tie is shown between two nodes whenever there is either a friendship tie, or a spousal tie, or both. This helps us to see that Bob, Carol, and Ted form a "clique" (i.e. each is connected to each of the others), and Alice is a "pendant" (tied to the group by only one connection).
This particular way for drawing the multiplex relation, however, loses some information about which ties connect which actors. As an alternative, one might want to superimpose the two single-relation graphs, and show multiple lines (or different color lines, or some dashed lines) to show the different kinds of connections.