
2.3.3.3E: Scatter Plots (Exercises)


- Last updated
- Jan 17, 2020
- Save as PDF
( \newcommand{\kernel}{\mathrm{null}\,}\)
Does the scatter plot appear linear? Strong or weak? Positive or negative?
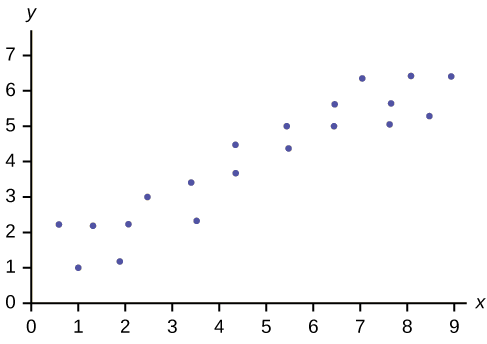 Figure 2.3.3.3E.4
Answer
The data appear to be linear with a strong, positive correlation.
Does the scatter plot appear linear? Strong or weak? Positive or negative?
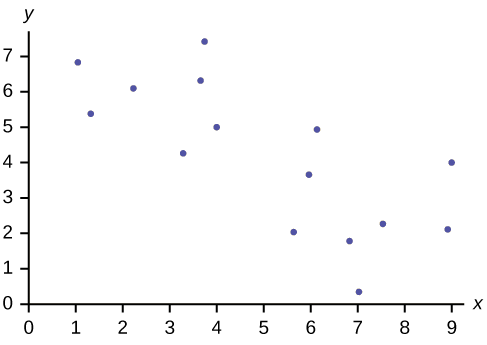 Figure 2.3.3.3E.5
Does the scatter plot appear linear? Strong or weak? Positive or negative?
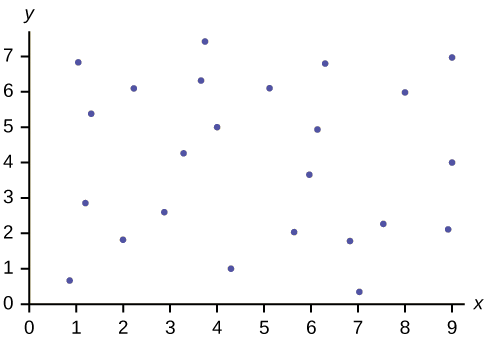 Figure 2.3.3.3E.6
Answer
The data appear to have no correlation.