
1.0: Prelude to Functions


- Last updated
- Jan 8, 2020
- Save as PDF

( \newcommand{\kernel}{\mathrm{null}\,}\)
Toward the end of the twentieth century, the values of stocks of internet and technology companies rose dramatically. As a result, the Standard and Poor’s stock market average rose as well. The Standard and Poor’s Index tracks the value of that initial investment of just under $100 over the 40 years. It shows that an investment that was worth less than $500 until about 1995 skyrocketed up to about $1100 by the beginning of 2000. That five-year period became known as the “dot-com bubble” because so many internet startups were formed. As bubbles tend to do, though, the dot-com bubble eventually burst. Many companies grew too fast and then suddenly went out of business. The result caused the sharp decline represented on the graph beginning at the end of 2000.
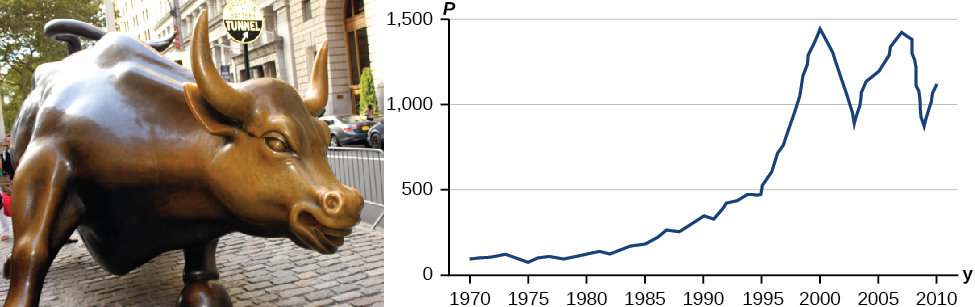
Figure 1.0.1: Figure of a Bull and a graph of market prices. Standard and Poor’s Index with dividends reinvested (credit "bull": modification of work by Prayitno Hadinata; credit "graph": modification of work by MeasuringWorth)
Notice, as we consider this example, that there is a definite relationship between the year and stock market average. For any year we choose, we can determine the corresponding value of the stock market average. In this chapter, we will explore these kinds of relationships and their properties.
Contributors
Jay Abramson (Arizona State University) with contributing authors. Textbook content produced by OpenStax College is licensed under a Creative Commons Attribution License 4.0 license. Download for free at https://openstax.org/details/books/precalculus.