
14.6.1: Describing Data


- Last updated
- Aug 12, 2022
- Save as PDF

( \newcommand{\kernel}{\mathrm{null}\,}\)
1.
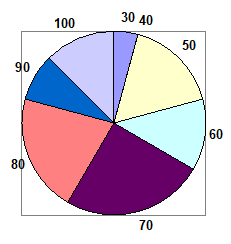
- Different tables are possible
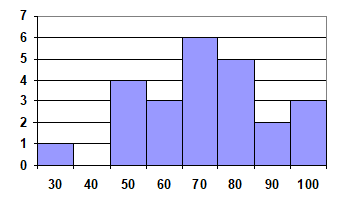
Score Frequency 3014005046037068059021003
- This is technically a bar graph, not a histogram:
3.
- 5+3+4+2+1=15
- 5/15=0.3333=33.33%
5. Bar is at 25%.25% of 20=5 students earned an A
7.
- (7.25+8.25+9.00+8.00+7.25+7.50+8.00+7.00)/8=$7.781
- In order, 7.50 and 8.00 are in middle positions. Median =$7.75
- 0.25∗8=2 Q1 is average of 2nd and 3rd data values: $7.3750.75∗8=6.Q3 is average of 6th and 7th data values: $8.125 5-number summary: $7.00,$7.375,$7.75,$8.125,$9.00
- 0.637
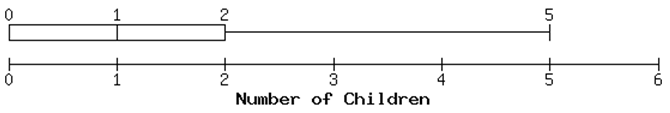
9.
- (5×0+3×1+4×2+2×3+1×5)/15=1.4667
- Median is 8th data value: 1 child
- 0.25×15=3.75. Q1 is 4 th data value: 0 children 0.75×15=11.25. Q 3 is 12th data value: 2 children 5 -number summary: 0,0 1,2,5
11. Kendra makes $90,000. Kelsey makes $40,000. Kendra makes $50,000 more.