11.1: Functions of Several Variables
- Page ID
- 104876

\( \newcommand{\vecs}[1]{\overset { \scriptstyle \rightharpoonup} {\mathbf{#1}} } \)
\( \newcommand{\vecd}[1]{\overset{-\!-\!\rightharpoonup}{\vphantom{a}\smash {#1}}} \)
\( \newcommand{\dsum}{\displaystyle\sum\limits} \)
\( \newcommand{\dint}{\displaystyle\int\limits} \)
\( \newcommand{\dlim}{\displaystyle\lim\limits} \)
\( \newcommand{\id}{\mathrm{id}}\) \( \newcommand{\Span}{\mathrm{span}}\)
( \newcommand{\kernel}{\mathrm{null}\,}\) \( \newcommand{\range}{\mathrm{range}\,}\)
\( \newcommand{\RealPart}{\mathrm{Re}}\) \( \newcommand{\ImaginaryPart}{\mathrm{Im}}\)
\( \newcommand{\Argument}{\mathrm{Arg}}\) \( \newcommand{\norm}[1]{\| #1 \|}\)
\( \newcommand{\inner}[2]{\langle #1, #2 \rangle}\)
\( \newcommand{\Span}{\mathrm{span}}\)
\( \newcommand{\id}{\mathrm{id}}\)
\( \newcommand{\Span}{\mathrm{span}}\)
\( \newcommand{\kernel}{\mathrm{null}\,}\)
\( \newcommand{\range}{\mathrm{range}\,}\)
\( \newcommand{\RealPart}{\mathrm{Re}}\)
\( \newcommand{\ImaginaryPart}{\mathrm{Im}}\)
\( \newcommand{\Argument}{\mathrm{Arg}}\)
\( \newcommand{\norm}[1]{\| #1 \|}\)
\( \newcommand{\inner}[2]{\langle #1, #2 \rangle}\)
\( \newcommand{\Span}{\mathrm{span}}\) \( \newcommand{\AA}{\unicode[.8,0]{x212B}}\)
\( \newcommand{\vectorA}[1]{\vec{#1}} % arrow\)
\( \newcommand{\vectorAt}[1]{\vec{\text{#1}}} % arrow\)
\( \newcommand{\vectorB}[1]{\overset { \scriptstyle \rightharpoonup} {\mathbf{#1}} } \)
\( \newcommand{\vectorC}[1]{\textbf{#1}} \)
\( \newcommand{\vectorD}[1]{\overrightarrow{#1}} \)
\( \newcommand{\vectorDt}[1]{\overrightarrow{\text{#1}}} \)
\( \newcommand{\vectE}[1]{\overset{-\!-\!\rightharpoonup}{\vphantom{a}\smash{\mathbf {#1}}}} \)
\( \newcommand{\vecs}[1]{\overset { \scriptstyle \rightharpoonup} {\mathbf{#1}} } \)
\(\newcommand{\longvect}{\overrightarrow}\)
\( \newcommand{\vecd}[1]{\overset{-\!-\!\rightharpoonup}{\vphantom{a}\smash {#1}}} \)
\(\newcommand{\avec}{\mathbf a}\) \(\newcommand{\bvec}{\mathbf b}\) \(\newcommand{\cvec}{\mathbf c}\) \(\newcommand{\dvec}{\mathbf d}\) \(\newcommand{\dtil}{\widetilde{\mathbf d}}\) \(\newcommand{\evec}{\mathbf e}\) \(\newcommand{\fvec}{\mathbf f}\) \(\newcommand{\nvec}{\mathbf n}\) \(\newcommand{\pvec}{\mathbf p}\) \(\newcommand{\qvec}{\mathbf q}\) \(\newcommand{\svec}{\mathbf s}\) \(\newcommand{\tvec}{\mathbf t}\) \(\newcommand{\uvec}{\mathbf u}\) \(\newcommand{\vvec}{\mathbf v}\) \(\newcommand{\wvec}{\mathbf w}\) \(\newcommand{\xvec}{\mathbf x}\) \(\newcommand{\yvec}{\mathbf y}\) \(\newcommand{\zvec}{\mathbf z}\) \(\newcommand{\rvec}{\mathbf r}\) \(\newcommand{\mvec}{\mathbf m}\) \(\newcommand{\zerovec}{\mathbf 0}\) \(\newcommand{\onevec}{\mathbf 1}\) \(\newcommand{\real}{\mathbb R}\) \(\newcommand{\twovec}[2]{\left[\begin{array}{r}#1 \\ #2 \end{array}\right]}\) \(\newcommand{\ctwovec}[2]{\left[\begin{array}{c}#1 \\ #2 \end{array}\right]}\) \(\newcommand{\threevec}[3]{\left[\begin{array}{r}#1 \\ #2 \\ #3 \end{array}\right]}\) \(\newcommand{\cthreevec}[3]{\left[\begin{array}{c}#1 \\ #2 \\ #3 \end{array}\right]}\) \(\newcommand{\fourvec}[4]{\left[\begin{array}{r}#1 \\ #2 \\ #3 \\ #4 \end{array}\right]}\) \(\newcommand{\cfourvec}[4]{\left[\begin{array}{c}#1 \\ #2 \\ #3 \\ #4 \end{array}\right]}\) \(\newcommand{\fivevec}[5]{\left[\begin{array}{r}#1 \\ #2 \\ #3 \\ #4 \\ #5 \\ \end{array}\right]}\) \(\newcommand{\cfivevec}[5]{\left[\begin{array}{c}#1 \\ #2 \\ #3 \\ #4 \\ #5 \\ \end{array}\right]}\) \(\newcommand{\mattwo}[4]{\left[\begin{array}{rr}#1 \amp #2 \\ #3 \amp #4 \\ \end{array}\right]}\) \(\newcommand{\laspan}[1]{\text{Span}\{#1\}}\) \(\newcommand{\bcal}{\cal B}\) \(\newcommand{\ccal}{\cal C}\) \(\newcommand{\scal}{\cal S}\) \(\newcommand{\wcal}{\cal W}\) \(\newcommand{\ecal}{\cal E}\) \(\newcommand{\coords}[2]{\left\{#1\right\}_{#2}}\) \(\newcommand{\gray}[1]{\color{gray}{#1}}\) \(\newcommand{\lgray}[1]{\color{lightgray}{#1}}\) \(\newcommand{\rank}{\operatorname{rank}}\) \(\newcommand{\row}{\text{Row}}\) \(\newcommand{\col}{\text{Col}}\) \(\renewcommand{\row}{\text{Row}}\) \(\newcommand{\nul}{\text{Nul}}\) \(\newcommand{\var}{\text{Var}}\) \(\newcommand{\corr}{\text{corr}}\) \(\newcommand{\len}[1]{\left|#1\right|}\) \(\newcommand{\bbar}{\overline{\bvec}}\) \(\newcommand{\bhat}{\widehat{\bvec}}\) \(\newcommand{\bperp}{\bvec^\perp}\) \(\newcommand{\xhat}{\widehat{\xvec}}\) \(\newcommand{\vhat}{\widehat{\vvec}}\) \(\newcommand{\uhat}{\widehat{\uvec}}\) \(\newcommand{\what}{\widehat{\wvec}}\) \(\newcommand{\Sighat}{\widehat{\Sigma}}\) \(\newcommand{\lt}{<}\) \(\newcommand{\gt}{>}\) \(\newcommand{\amp}{&}\) \(\definecolor{fillinmathshade}{gray}{0.9}\)In Math 400 (Calculus I), and innumerable courses before it, we studied functions of one variable. A function of this type might represent the temperature over a given time interval, the position of a car as a function of time, or the altitude of a jet plane as it travels from New York to San Francisco. In each of these examples, the function has one independent variable.
Suppose, however, that we have a quantity that depends on more than one variable. For example, temperature can depend on location and the time of day, or a company’s profit model might depend on the number of units sold and the amount of money spent on advertising.
When dealing with a function of more than one independent variable, several questions naturally arise. For example, how do we calculate limits of functions of more than one variable? The definition of derivative we used before involved a limit. Does the new definition of derivative involve limits as well? Do the rules of differentiation apply in this context? How to we integrate such functions? All these questions that pertain, in particular to Math 420, are answered in this chapter.
Our first step is to explain what a function of more than one variable is, starting with functions of two independent variables. This step includes identifying the domain and range of such functions.
Functions of Two Variables
The definition of a function of two variables is very similar to the definition for a function of one variable. The main difference is that, instead of mapping values of one variable to values of another variable, we map ordered pairs of variables to another variable.
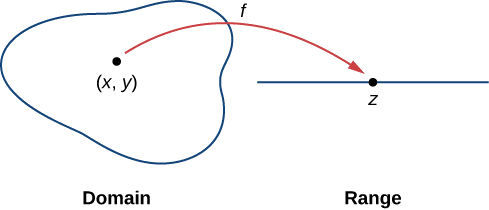
A function of two variables \(z=f(x,y)\) maps each ordered pair \((x,y)\) in a subset \(D\) of the real plane \(R^2\) to a unique real number z. The set \(D\) is called the domain of the function. The range of \(f\) is the set of all real numbers z that has at least one ordered pair \((x,y)∈D\) such that \(f(x,y)=z\) as shown in Figure \(\PageIndex{1}\).
Determining the domain of a function of two variables involves taking into account any domain restrictions that may exist. Let’s take a look.
Find the domain and range of each of the following functions:
- \(f(x,y)=3x+5y+2\)
- \(g(x,y)=\sqrt{9−x^2−y^2}\)
Solution a.
This is an example of a function in two variables. There are no values or combinations of \(x\) and \(y\) that cause \(f(x,y)\) to be undefined, so the domain of \(f\) is \(R^2\). To determine the range, first pick a value for z. We need to find a solution to the equation \(f(x,y)=z,\) or \(3x−5y+2=z.\) One such solution can be obtained by first setting \(y=0\), which yields the equation \(3x+2=z\). The solution to this equation is \(x=\dfrac{z−2}{3}\), which gives the ordered pair \(\left(\dfrac{z−2}{3},0\right)\) as a solution to the equation \(f(x,y)=z\) for any value of \(z\). Therefore, the range of the function is all real numbers, or \(R\).
Note: we could do something similar by setting \(x=0\), or \(x\) or \(y\) to any real number.
Solution b.
For the function \(g(x,y)\) to have a real value, the quantity under the square root must be nonnegative:
\[ 9−x^2−y^2≥0. \nonumber\]
This inequality can be written in the form
\[ x^2+y^2≤9. \nonumber\]
Therefore, the domain of \(g(x,y)\) is \(\{(x,y)∈R^2∣x^2+y^2≤9\}\). The graph of this set of points can be described as a disk of radius 3 centered at the origin. The domain includes the boundary circle as shown in the following graph.

To determine the range of \(g(x,y)=\sqrt{9−x^2−y^2}\) we start with a point \((x_0,y_0)\) on the boundary of the domain, which is defined by the relation \(x^2+y^2=9\). It follows that \(x^2_0+y^2_0=9\) and
\[ \begin{align*} g(x_0,y_0) =\sqrt{9−x^2_0−y^2_0} \\[4pt] =\sqrt{9−(x^2_0+y^2_0)}\\[4pt] =\sqrt{9−9}\\[4pt] =0. \end{align*}\]
If \(x^2_0+y^2_0=0\) (in other words, \(x_0=y_0=0)\), then
\[ \begin{align*} g(x_0,y_0) =\sqrt{9−x^2_0−y^2_0}\\[4pt] =\sqrt{9−(x^2_0+y^2_0)}\\[4pt] =\sqrt{9−0}=3. \end{align*}\]
This is the maximum value of the function. Given any value \(c\) between \(0\) and \(3\), we can find an entire set of points inside the domain of \(g\) such that \(g(x,y)=c:\)
\[\begin{align*} \sqrt{9−x^2−y^2} =c \\[4pt] 9−x^2−y^2 =c^2 \\[4pt] x^2+y^2 =9−c^2. \end{align*}\]
Since \(9−c^2>0\), this describes a circle of radius \(\sqrt{9−c^2}\) centered at the origin. Any point on this circle satisfies the equation \(g(x,y)=c\). Therefore, the range of this function can be written in interval notation as \([0,3].\)
Find the domain and range of the function \(f(x,y)=\sqrt{36−9x^2−9y^2}\).
- Hint
-
Determine the set of ordered pairs that do not make the radicand negative.
- Solution
-
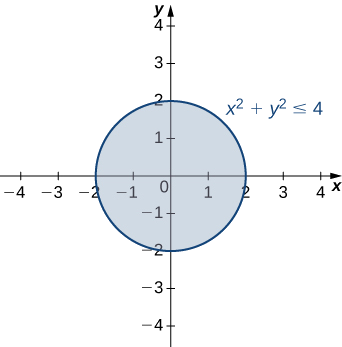
The domain is \(\{(x, y) | x^2+y^2≤4 \}\) the shaded circle defined by the inequality \(x^2+y^2≤4\), which has a circle of radius \(2\) as its boundary. The range is \([0,6].\)
Note: The remainder of this section is not necessary for Math 420. I am leaving it for those who may wish to have a better understanding of the concepts discussed here.
Graphing Functions of Two Variables
Suppose we wish to graph the function \(z=(x,y).\) This function has two independent variables (\(x\) and \(y\)) and one dependent variable \((z)\). When graphing a function \(y=f(x)\) of one variable, we use the Cartesian plane. We are able to graph any ordered pair \((x,y)\) in the plane, and every point in the plane has an ordered pair \((x,y)\) associated with it. With a function of two variables, each ordered pair \((x,y)\) in the domain of the function is mapped to a real number \(z\). Therefore, the graph of the function \(f\) consists of ordered triples \((x,y,z)\). The graph of a function \(z=(x,y)\) of two variables is called a surface.
To understand more completely the concept of plotting a set of ordered triples to obtain a surface in three-dimensional space, imagine the \((x,y)\) coordinate system laying flat. Then, every point in the domain of the function f has a unique z-value associated with it. If z is positive, then the graphed point is located above the xy-plane, if z is negative, then the graphed point is located below the xy-plane. The set of all the graphed points becomes the two-dimensional surface that is the graph of the function \(f\).
Create a graph of each of the following functions:
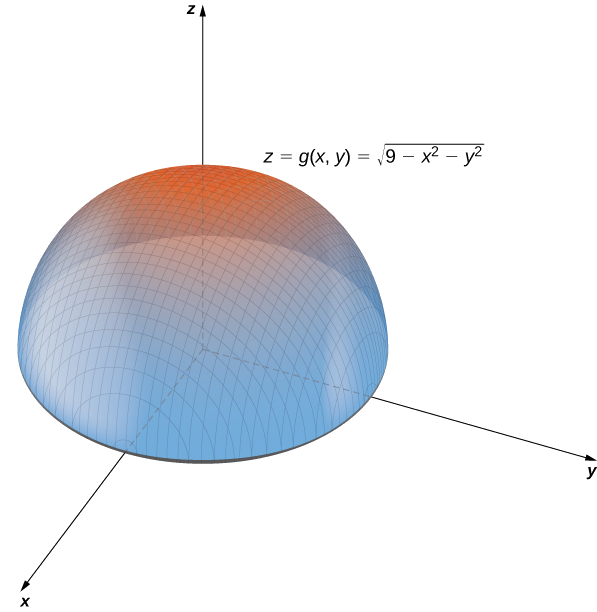
- \(g(x,y)=\sqrt{9−x^2−y^2}\)
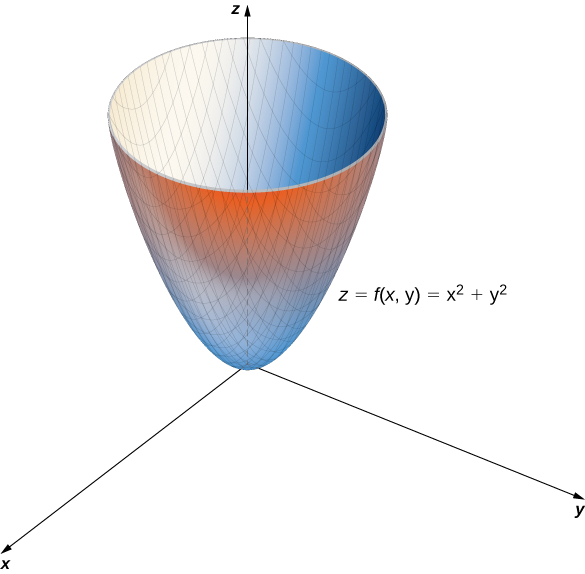
- \(f(x,y)=x^2+y^2\)
Solution
a. In Example \(\PageIndex{2}\), we determined that the domain of \(g(x,y)=\sqrt{9−x^2−y^2}\) is \(\{(x,y)∈R^2∣x^2+y^2≤9\}\) and the range is \(\{z∈R^2∣0≤z≤3\}\). When \(x^2+y^2=9\) we have \(g(x,y)=0\). Therefore any point on the circle of radius \(3\) centered at the origin in the \(xy\)-plane maps to \(z=0\) in \(R^3\). If \(x^2+y^2=8\), then \(g(x,y)=1,\) so any point on the circle of radius \(2\sqrt{2}\) centered at the origin in the \(xy\)-plane maps to \(z=1\) in \(R^3\). As \(x^2+y^2\) gets closer to zero, the value of \(z\) approaches \(3\). When \(x^2+y^2=0\), then \(g(x,y)=3\). This is the origin in the \(xy\)-plane If \(x^2+y^2\) is equal to any other value between \(0\) and \(9\), then \(g(x,y)\) equals some other constant between \(0\) and \(3\). The surface described by this function is a hemisphere centered at the origin with radius \(3\) as shown in the following graph.
b. This function also contains the expression \(x^2+y^2\). Setting this expression equal to various values starting at zero, we obtain circles of increasing radius. The minimum value of \(f(x,y)=x^2+y^2\) is zero (attained when \(x=y=0.\) When \(x=0\), the function becomes \(z=y^2\), and when \(y=0\), then the function becomes \(z=x^2\). These are cross-sections of the graph, and are parabolas. The name of the graph of \(f(x,y)=x^2+y^2\) is a paraboloid. The graph of \(f\) appears in the following graph.