
2.10E: Exercises


( \newcommand{\kernel}{\mathrm{null}\,}\)
Practice Makes Perfect
Verify Solutions to an Inequality in Two Variables
In the following exercises, determine whether each ordered pair is a solution to the given inequality.
Determine whether each ordered pair is a solution to the inequality y>x−1:
- (0,1)
- (−4,−1)
- (4,2)
- (3,0)
- (−2,−3)
Determine whether each ordered pair is a solution to the inequality y>x−3:
- (0,0)
- (2,1)
- (−1,−5)
- (−6,−3)
- (1,0)
- Answer
-
- yes
- no
- no
- yes
- no
Determine whether each ordered pair is a solution to the inequality y<x+2:
- (0,3)
- (−3,−2)
- (−2,0)
- (0,0)
- (−1,4)
Determine whether each ordered pair is a solution to the inequality y<x+5:
- (−3,0)
- (1,6)
- (−6,−2)
- (0,1)
- (5,−4)
- Answer
-
- yes
- no
- no
- yes
- yes
Determine whether each ordered pair is a solution to the inequality x+y>4:
- (5,1)
- (−2,6)
- (3,2)
- (10,−5)
- (0,0)
Determine whether each ordered pair is a solution to the inequality x+y>2:
- (1,1)
- (4,−3)
- (0,0)
- (−8,12)
- (3,0)
- Answer
-
- no
- no
- no
- yes
- yes
Recognize the Relation Between the Solutions of an Inequality and its Graph
In the following exercises, write the inequality shown by the shaded region.
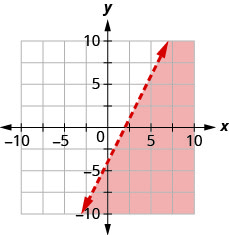
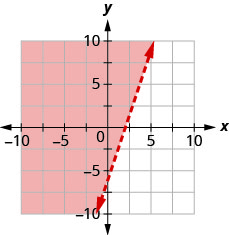
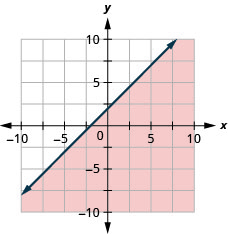
Write the inequality shown by the graph with the boundary line y=3x−4.
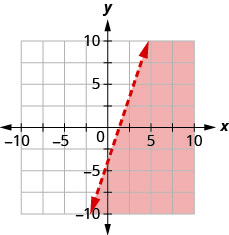
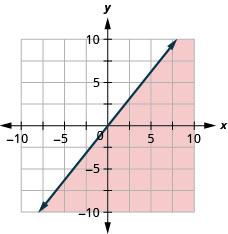
Write the inequality shown by the graph with the boundary line y=2x−4.
- Answer
-
y<2x−4
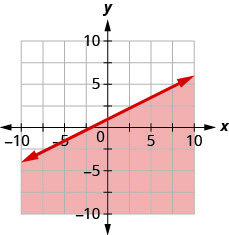
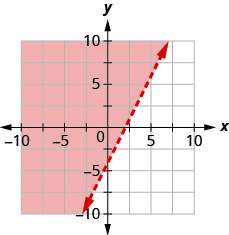
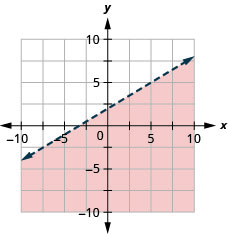
Write the inequality shown by the graph with the boundary line y=12x+1
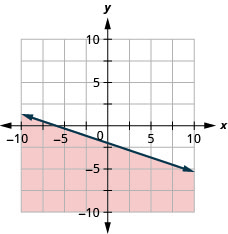
Write the inequality shown by the graph with the boundary line y=−13x−2
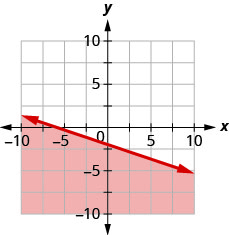
- Answer
-
y≤−13x−2
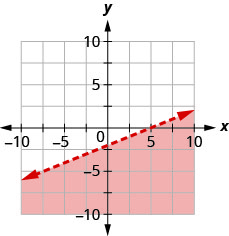
Write the inequality shown by the shaded region in the graph with the boundary line x+y=5.
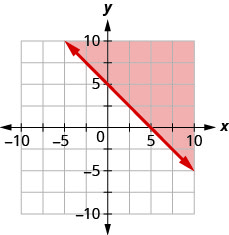
Write the inequality shown by the shaded region in the graph with the boundary line x+y=3.
- Answer
-
x+y≥3
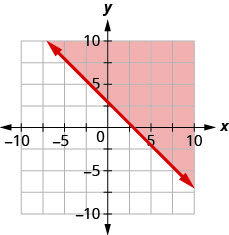
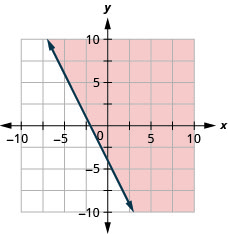
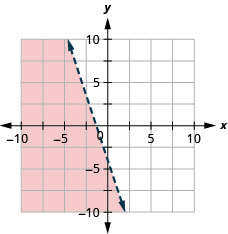
Write the inequality shown by the shaded region in the graph with the boundary line 2x+y=−4.
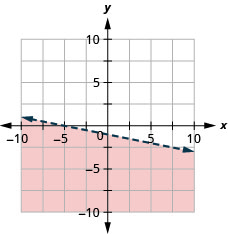
Write the inequality shown by the shaded region in the graph with the boundary line x+2y=−2.
- Answer
-
x+2y≥−2
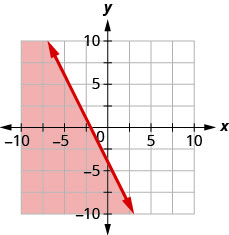
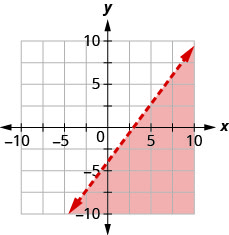
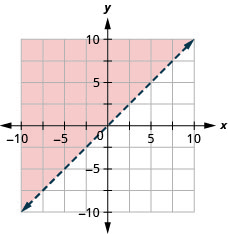
Write the inequality shown by the shaded region in the graph with the boundary line 3x−y=6.
Write the inequality shown by the shaded region in the graph with the boundary line 2x−y=4.
- Answer
-
2x−y<4
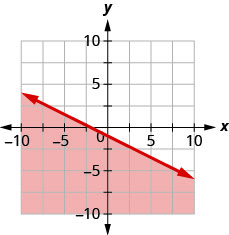
Write the inequality shown by the shaded region in the graph with the boundary line 2x−5y=10.
Write the inequality shown by the shaded region in the graph with the boundary line 4x−3y=12.
- Answer
-
4x−3y>12
Graph Linear Inequalities
In the following exercises, graph each linear inequality.
Graph the linear inequality y>23x−1
Graph the linear inequality y<35x+2
- Answer
-
Graph the linear inequality y≤−12x+4
Graph the linear inequality y≥−13x−2
- Answer
-
Graph the linear inequality x−y≤3
Graph the linear inequality x−y≥−2
- Answer
-
Graph the linear inequality 4x+y>−4
Graph the linear inequality x+5y<−5
- Answer
-
Graph the linear inequality 3x+2y≥−6
Graph the linear inequality 4x+2y≥−8
- Answer
-
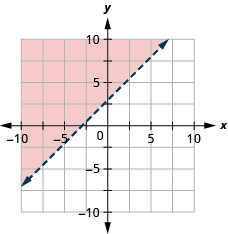
Graph the linear inequality y>4x
Graph the linear inequality y>x
- Answer
-
Graph the linear inequality y≤−x
Graph the linear inequality y≤−3x
- Answer
-
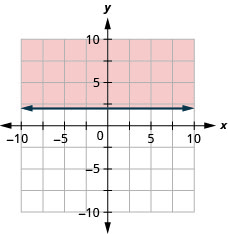
Graph the linear inequality y≥−2
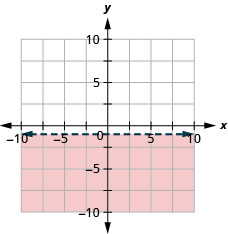
Graph the linear inequality y<−1
- Answer
-
Graph the linear inequality y<4
Graph the linear inequality y≥2
- Answer
-
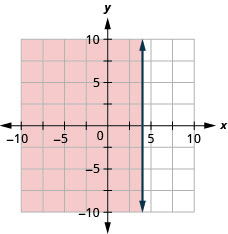
Graph the linear inequality x≤5
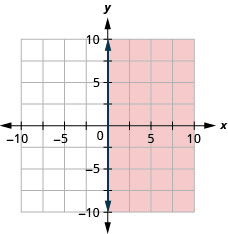
Graph the linear inequality x>−2
- Answer
-
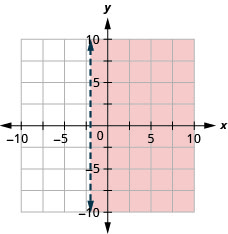
Graph the linear inequality x>−3
Graph the linear inequality x≤4
- Answer
-
Graph the linear inequality x−y<4
Graph the linear inequality x−y<−3
- Answer
-
Graph the linear inequality y≥32x
Graph the linear inequality y≤54x
- Answer
-
Graph the linear inequality y>−2x+1
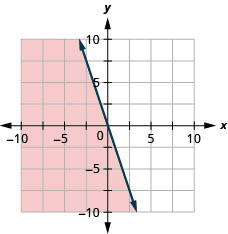
Graph the linear inequality y<−3x−4
- Answer
-
Graph the linear inequality x≤−1
Graph the linear inequality x≥0
- Answer
-
Everyday Math
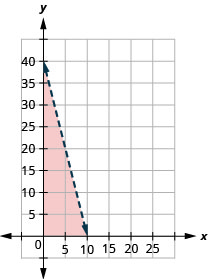
Money. Gerry wants to have a maximum of $100 cash at the ticket booth when his church carnival opens. He will have $1 bills and $5 bills. If x is the number of $1 bills and y is the number of $5 bills, the inequality x+5y≤100 models the situation.
- Graph the inequality.
- List three solutions to the inequality x+5y≤100 where both x and y are integers.
Shopping. Tula has $20 to spend at the used book sale. Hardcover books cost $2 each and paperback books cost $0.50 each. If x is the number of hardcover books Tula can buy and y is the number of paperback books she can buy, the inequality 2x+12y≤20 models the situation.
- Graph the inequality.
- List three solutions to the inequality 2x+12y≤20 where both x and y are whole numbers.
- Answer
-
1.
2. Answers will vary.
Writing Exercises
Lester thinks that the solution of any inequality with a > sign is the region above the line and the solution of any inequality with a < sign is the region below the line. Is Lester correct? Explain why or why not.
Explain why in some graphs of linear inequalities the boundary line is solid but in other graphs it is dashed.
Self Check
a. After completing the exercises, use this checklist to evaluate your mastery of the objectives of this section.
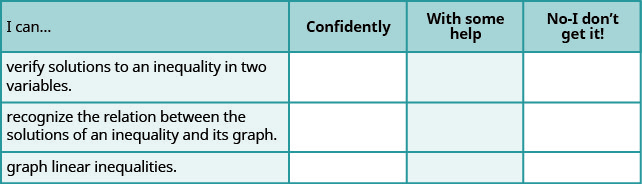
b. What does this checklist tell you about your mastery of this section? What steps will you take to improve?