
3.5E: Exercises for Section 3.4
( \newcommand{\kernel}{\mathrm{null}\,}\)
In exercises 1 - 3, the given functions represent the position of a particle traveling along a horizontal line.
a. Find the velocity and acceleration functions.
b. Determine the time intervals when the object is slowing down or speeding up.
1)
2)
- Answer
- a.
b. speeds up for
3)
4) A rocket is fired vertically upward from the ground. The distance
a. Find the velocity of the rocket 3 seconds after being fired.
b. Find the acceleration of the rocket 3 seconds after being fired.
- Answer
- a.
b.
5) A ball is thrown downward with a speed of 8 ft/s from the top of a 64-foot-tall building. After
a. Determine how long it takes for the ball to hit the ground.
b. Determine the velocity of the ball when it hits the ground.
6) The position function
a. Determine the velocity of the car when
b. Determine the velocity of the car when
- Answer
- a.
b.
7) The position of a hummingbird flying along a straight line in
a. Determine the velocity of the bird at
b. Determine the acceleration of the bird at
c. Determine the acceleration of the bird when the velocity equals 0.
8) A potato is launched vertically upward with an initial velocity of 100 ft/s from a potato gun at the top of an 85-foot-tall building. The distance in feet that the potato travels from the ground after
a. Find the velocity of the potato after
b. Find the speed of the potato at
c. Determine when the potato reaches its maximum height.
d. Find the acceleration of the potato at
e. Determine how long the potato is in the air.
f. Determine the velocity of the potato upon hitting the ground.
- Answer
- a. 84 ft/s, −84 ft/s
b. 84 ft/s
c.
d.
e.
f.
9) The position function
a. Determine the direction the train is traveling when
b. Determine the direction the train is traveling when
c. Determine the time intervals when the train is slowing down or speeding up.
10) The following graph shows the position
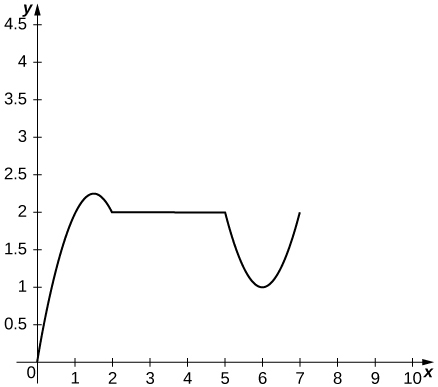
a. Use the graph of the position function to determine the time intervals when the velocity is positive, negative, or zero.
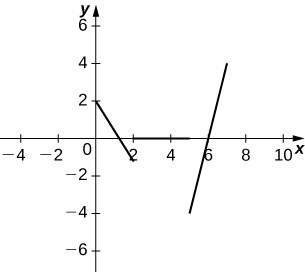
b. Sketch the graph of the velocity function.
c. Use the graph of the velocity function to determine the time intervals when the acceleration is positive, negative, or zero.
d. Determine the time intervals when the object is speeding up or slowing down.
- Answer
- a. Velocity is positive on
b.
c. Acceleration is positive on
d. The object is speeding up on
11) The cost function, in dollars, of a company that manufactures food processors is given by
a. Find the marginal cost function.
b. Find the marginal cost of manufacturing 12 food processors.
c. Find the actual cost of manufacturing the thirteenth food processor.
12) The price p (in dollars) and the demand
a. Find the revenue function
b. Find the marginal revenue function.
c. Find the marginal revenue at
- Answer
- a.
b.
c. $6 per item, $0 per item
13) [T] A profit is earned when revenue exceeds cost. Suppose the profit function for a skateboard manufacturer is given by
a. Find the exact profit from the sale of the thirtieth skateboard.
b. Find the marginal profit function and use it to estimate the profit from the sale of the thirtieth skateboard.
14) [T] In general, the profit function is the difference between the revenue and cost functions:
Suppose the price-demand and cost functions for the production of cordless drills is given respectively by
a. Find the marginal cost function.
b. Find the revenue and marginal revenue functions.
c. Find
d. Find the profit and marginal profit functions.
e. Find
- Answer
- a.
b.
c.
d.
e.
15) A small town in Ohio commissioned an actuarial firm to conduct a study that modeled the rate of change of the town’s population. The study found that the town’s population (measured in thousands of people) can be modeled by the function
a. Find the rate of change function
b. Find
c. Find
16) [T] A culture of bacteria grows in number according to the function
a. Find the rate of change of the number of bacteria.
b. Find
c. Interpret the results in (b).
d. Find
- Answer
- a.
b.
c. The bacteria population increases from time 0 to 10 hours; afterwards, the bacteria population decreases.
d.
17) The centripetal force of an object of mass m is given by
a. Find the rate of change of centripetal force with respect to the distance from the center of rotation.
b. Find the rate of change of centripetal force of an object with mass 1000 kilograms, velocity of 13.89 m/s, and a distance from the center of rotation of 200 meters.
The following questions concern the population (in millions) of London by decade in the 19th century, which is listed in the following table.
| Year Since 1800 | Population (millions) |
| 1 | 0.8975 |
| 11 | 1.040 |
| 21 | 1.264 |
| 31 | 1.516 |
| 41 | 1.661 |
| 51 | 2.000 |
| 61 | 2.634 |
| 71 | 3.272 |
| 81 | 3.911 |
| 91 | 4.422 |
Population of LondonSource: http://en.Wikipedia.org/wiki/Demographics_of_London
18) [T]
a. Using a calculator or a computer program, find the best-fit linear function to measure the population.
b. Find the derivative of the equation in a. and explain its physical meaning.
c. Find the second derivative of the equation and explain its physical meaning.
- Answer
- a.
b.
c.
19) [T]
a. Using a calculator or a computer program, find the best-fit quadratic curve through the data.
b. Find the derivative of the equation and explain its physical meaning.
c. Find the second derivative of the equation and explain its physical meaning.
For the following exercises, consider an astronaut on a large planet in another galaxy. To learn more about the composition of this planet, the astronaut drops an electronic sensor into a deep trench. The sensor transmits its vertical position every second in relation to the astronaut’s position. The summary of the falling sensor data is displayed in the following table.
| Time after dropping (s) | Position (m) |
| 0 | 0 |
| 1 | −1 |
| 2 | −2 |
| 3 | −5 |
| 4 | −7 |
| 5 | −14 |
20) [T]
a. Using a calculator or computer program, find the best-fit quadratic curve to the data.
b. Find the derivative of the position function and explain its physical meaning.
c. Find the second derivative of the position function and explain its physical meaning.
- Answer
- a.
b.
c.
21) [T]
a. Using a calculator or computer program, find the best-fit cubic curve to the data.
b. Find the derivative of the position function and explain its physical meaning.
c. Find the second derivative of the position function and explain its physical meaning.
d. Using the result from c. explain why a cubic function is not a good choice for this problem.
The following problems deal with the Holling type I, II, and III equations. These equations describe the ecological event of growth of a predator population given the amount of prey available for consumption.
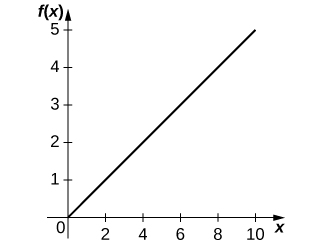
22) [T] The Holling type I equation is described by
a. Graph the Holling type I equation, given
b. Determine the first derivative of the Holling type I equation and explain physically what the derivative implies.
c. Determine the second derivative of the Holling type I equation and explain physically what the derivative implies.
d. Using the interpretations from b. and c. explain why the Holling type I equation may not be realistic.
- Answer
-
a.
b.
c.
d. This equation assumes that if there is more prey, the predator is able to increase consumption linearly. This assumption is unphysical because we would expect there to be some saturation point at which there is too much prey for the predator to consume adequately.
23) [T] The Holling type II equation is described by
a. Graph the Holling type II equation given
b. Take the first derivative of the Holling type II equation and interpret the physical meaning of the derivative.
c. Show that
d. Find and interpret the meaning of the second derivative. What makes the Holling type II function more realistic than the Holling type I function?
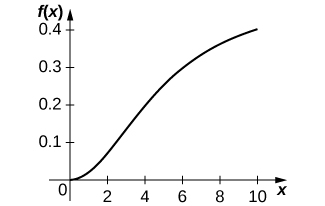
24) [T] The Holling type III equation is described by
a. Graph the Holling type III equation given
b. Take the first derivative of the Holling type III equation and interpret the physical meaning of the derivative.
c. Find and interpret the meaning of the second derivative (it may help to graph the second derivative).
d. What additional ecological phenomena does the Holling type III function describe compared with the Holling type II function?
- Answer
-
a.
b.
c.
d. At lower levels of prey, the prey is more easily able to avoid detection by the predator, so fewer prey individuals are consumed, resulting in less predator growth.
25) [T] The populations of the snowshoe hare (in thousands) and the lynx (in hundreds) collected over 7 years from 1937 to 1943 are shown in the following table. The snowshoe hare is the primary prey of the lynx.
| Population of snowshoe hare (thousands) | Population of lynx (hundreds) |
| 20 | 10 |
| 5 | 15 |
| 65 | 55 |
| 95 | 60 |
Snowshoe Hare and Lynx PopulationsSource: http://www.biotopics.co.uk/newgcse/predatorprey.html.
a. Graph the data points and determine which Holling-type function fits the data best.
b. Using the meanings of the parameters
c. Plot the resulting Holling-type I, II, and III functions on top of the data. Was the result from part a. correct?