
21.8: I1.08- Section 5 Part 2
( \newcommand{\kernel}{\mathrm{null}\,}\)
Example 6: Fitting a quadratic model
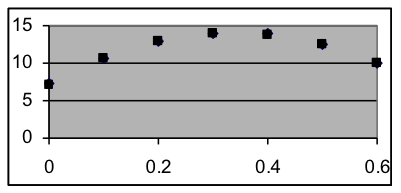
The height of a basketball above the floor is measured at 0.1-second intervals from when it leaves the player’s hand until it reaches the basket, with the results shown to the right.
|
|
Answer:
We will put this data into a copy of the Quadratic Model worksheet of Models.xls, then adjust the model parameters until the model fits the data well.
- Insert a new worksheet into Models.xls, labeling its tab “Basketball height model”. Then copy into this new worksheet the content of the read-only Quadratic Model Template worksheet.
- Change the label in A2 from “Input” to “Time” for this data. Change B2 from “Output” to “Height”.
- Select the numbers from the dataset (not the labels), and paste them into A3. For this data, the numbers should fill columns A and B from row 3 to row 9.
- Select cells C3, D3, and E3. Then spread them (and the formulas they already contain) down to row 9, matching the data. All three columns should now show numbers.
Make a scatter plot of columns A, B, & C. This will show the data and the model on the same graph. At first, the model points will be on a horizontal line through the origin, but they will move as the quadratic model parameters (in G3, G4, and G5) are adjusted. - Adjust G3, G4, and G5 to make the model approximately match the data.
- Set the shape parameter G5 to a positive number (start with 1) if the data curves upward, and to a negative number (start with –1) if the data curves downward. Adjust G4 to make the bend of the model similar to the bend in the data (larger numbers cause sharper bends), but don’t try to match the shape exactly until step [iii] below.
- Estimate x and y of the vertex of the data. Set G3 to the estimated x value and G4 to the y value.
- Now adjust G5 until the shape of the model is as close as possible to the shape of the data.
- Finally, adjust G3 and G4 to shift the model as needed so that it goes right through the data.
- Now that you have a good model, you can add additional input values (e.g. 0.25 into A10), then read the result from column C (spread the C9 formula down if a value does not appear in C10. (Because there is no data value for 0.25, B10 should remain blank and D10 and E10 should be erased.)
When the instructions above are followed for this data, the result should be approximately the spreadsheet shown below. This spreadsheet provides the information to answer the questions asked in the problem:
- A quadratic model matching this data is
- The vertex of the graph is at x=0.34, so the ball reached its peak at 0.34 seconds into the shot.
- The vertex of the graph is at y=14, so the height of the ball at its peak was 14 feet.
- The model predicts that the ball will have a height of 13.5 feet at 0.25 seconds.
QUADRATIC-MODEL SPREADSHEET FILLED OUT WITH DATA FROM THIS EXAMPLE
| A | B | C | D | E | F | G | H | |
| 1 | x | y data | y model | Data-Model | Quadratic model: y = –$G$5*(x-$G$3)^2+$G$4 | |||
| 2 | Time | Height | Prediction | deviation | y = –59*(x-0.34)^2+14 | |||
| 3 | 0.0 | 7.3 | 7.1796 | 0.0204 | 0.34 | x coordinate of vertex | ||
| 4 | 0.1 | 10.7 | 10.6016 | -0.0016 | 14 | y coordinate of vertex | ||
| 5 | 0.2 | 12.9 | 12.8436 | -0.0436 | -59 | shape coefficient | ||
| 6 | 0.3 | 14.0 | 13.9056 | -0.0056 | ||||
| 7 | 0.4 | 13.9 | 13.7876 | 0.0124 | ||||
| 8 | 0.5 | 12.6 | 12.4896 | 0.0104 | ||||
| 9 | 0.6 | 10.1 | 10.0116 | -0.0116 | ||||
| 10 | 0.25 | 13.5221 | ||||||
| 11 | ||||||||
| 12 | ||||||||
| 13 | ||||||||
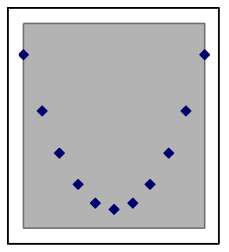
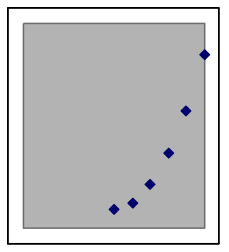
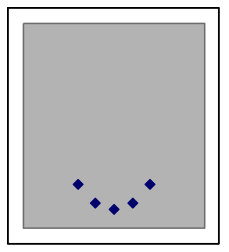
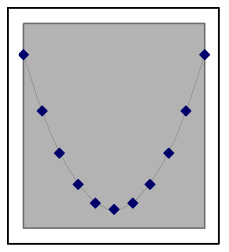
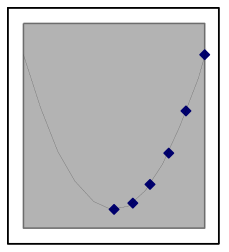
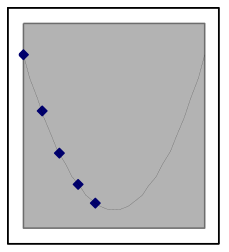
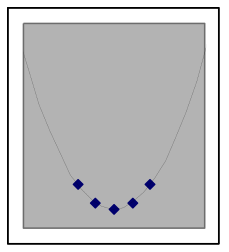
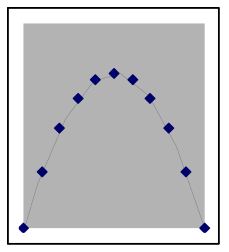
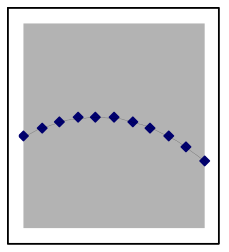
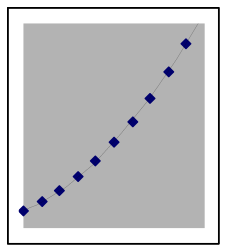
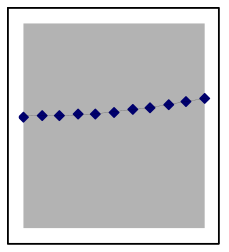
The shape of quadratic data can look different depending on where it is from on the parabola
A quadratic situation is easy to recognize when the data includes both sides of the peak or valley (as in the leftmost graph below), but if the data is all on one side you may need to look carefully to choose between a quadratic model and other nonlinear possibilities. Here are examples of how a quadratic model and data can match:
 |  |  |  |
 |  |  |  |
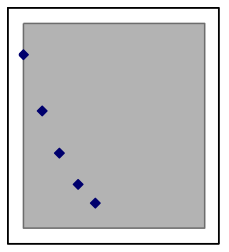
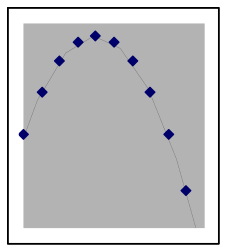
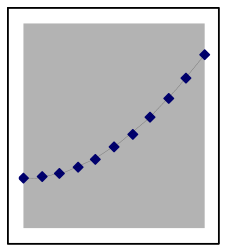
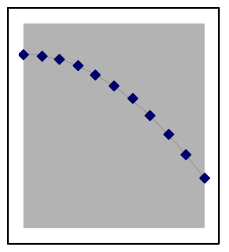
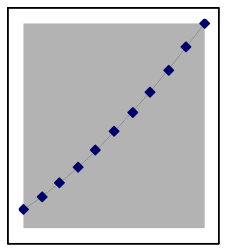
The above graphs are still quadratic if turned upside down, or uniformly stretched, compressed, or offset. Each of the graphs below also shows data points from different quadratic models. | |||
 |  |  |  |
 |  |  |  |
- Mathematics for Modeling. Authored by: Mary Parker and Hunter Ellinger. License: CC BY: Attribution