
3.2E: Exercises for Section 3.2

( \newcommand{\kernel}{\mathrm{null}\,}\)
For exercises 1 - 10, use the definition of a derivative to find
1)
2)
- Answer
3)
4)
- Answer
5)
6)
- Answer
7)
8)
- Answer
9)
10)
- Answer
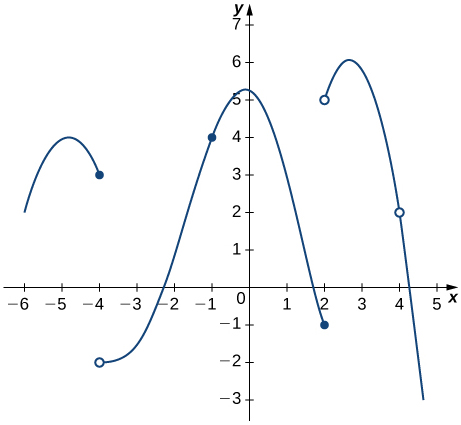
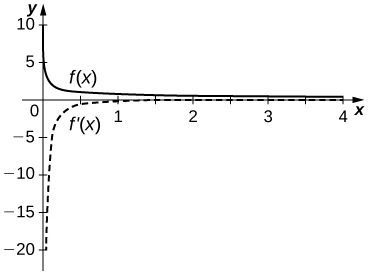
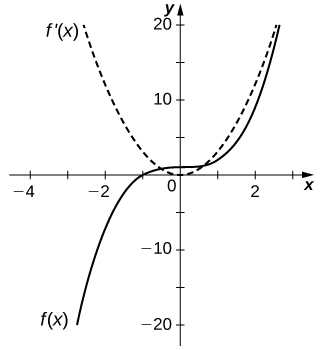
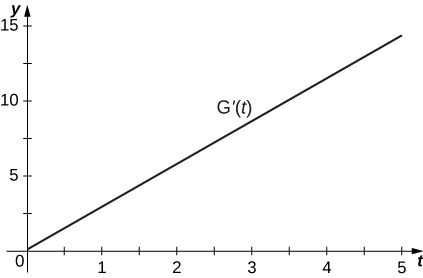
For the exercises 11 - 14, use the graph of
11)
12)
- Answer
-
13)
14)
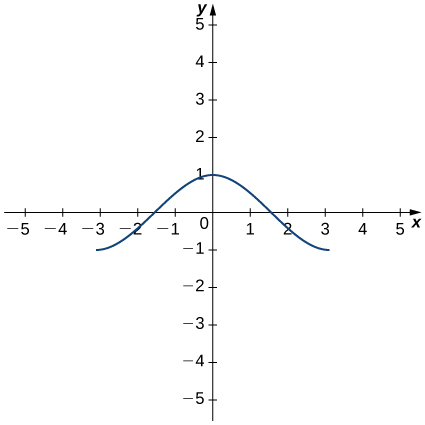
- Answer
-
For exercises 15 - 20, the given limit represents the derivative of a function
15)
16)
- Answer
17)
18)
- Answer
19)
20)
- Answer
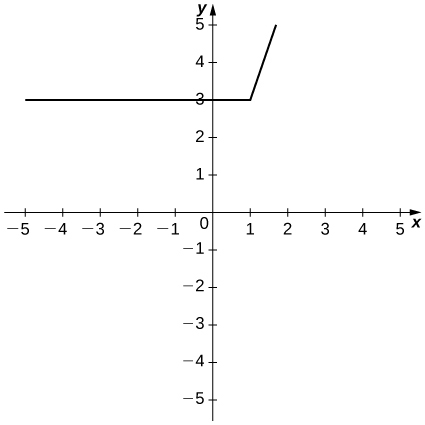
For the functions in exercises 21 - 24,
a. sketch the graph and
b. use the definition of a derivative to show that the function is not differentiable at
21)
22)
- Answer
-
a.
b.
23)
24)
- Answer
-
a.
b.
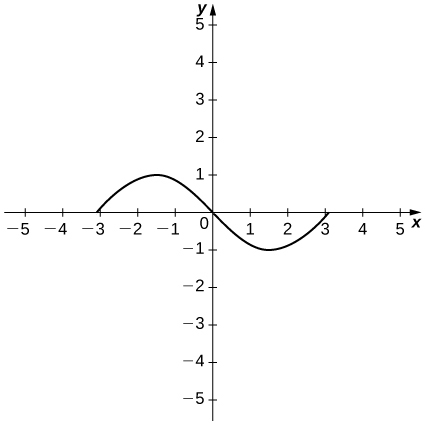
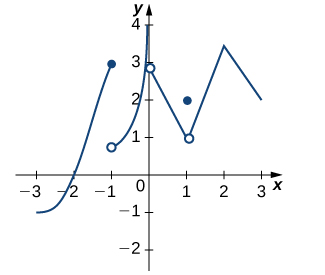
For the graphs in exercises 25 - 26,
a. determine for which values of
b. determine for which values of
25)
26)
- Answer
- a.
b.
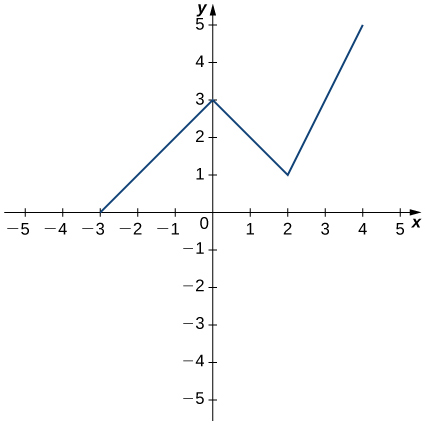
27) Use the graph to evaluate a.
For the functions in exercises 28 - 30, use
28)
- Answer
29)
30)
- Answer
For exercises 31 - 36, use a calculator to graph
31) [T]
32) [T]
- Answer
-
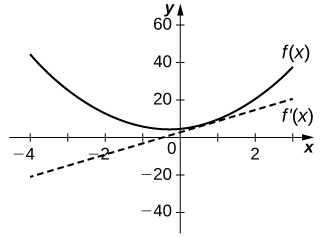
33) [T]
34) [T]
- Answer
-
35) [T]
36) [T]
- Answer
-
For exercises 37 - 42, describe what the two expressions represent in terms of each of the given situations. Be sure to include units.
a.
b.
37)
38)
- Answer
-
a. Average rate at which customers spent on concessions in thousands per customer.
b. Rate (in thousands per customer) at which
39)
40)
- Answer
-
a. Average grade received on the test with an average study time between two values.
b. Rate (in percentage points per hour) at which the grade on the test increased or decreased for a given average study time of
41)
42)
- Answer
-
a. Average change of atmospheric pressure between two different altitudes.
b. Rate (torr per foot) at which atmospheric pressure is increasing or decreasing at
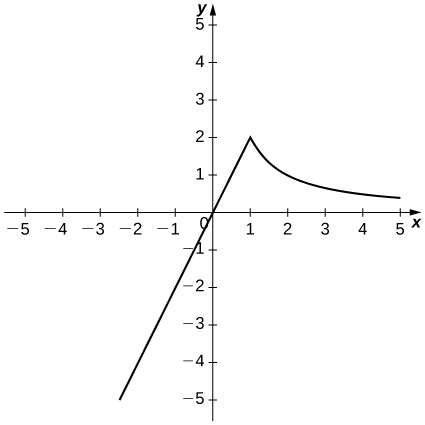
43) Sketch the graph of a function
a.
b.
c.
d.
e.
f.
44) Suppose temperature
a. Give a physical interpretation, with units, of
b. If we know that
- Answer
-
a. The rate (in degrees per foot) at which temperature is increasing or decreasing for a given height
b. The rate of change of temperature as altitude changes at
45) Suppose the total profit of a company is
a. What does
b. What does
c. Suppose that
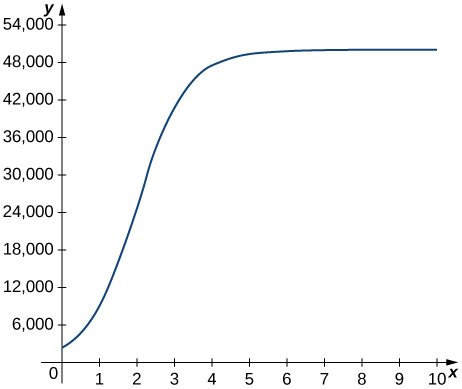
46) The graph in the following figure models the number of people
a. Describe what
b. What does the derivative tell us about how this town is affected by the flu outbreak?
- Answer
- a. The rate at which the number of people who have come down with the flu is changing
b. The rate is increasing sharply up to the third week, at which point it slows down and then becomes constant.
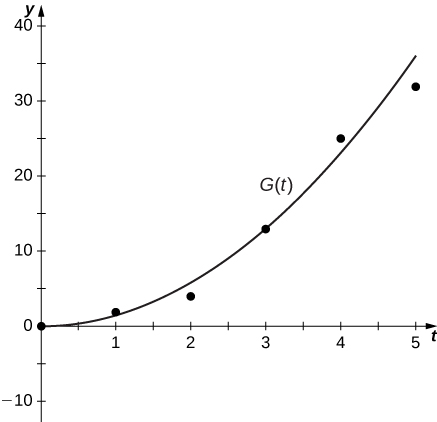
For exercises 47 - 52, use the following table, which shows the height
| Time (seconds) | Height (meters) |
| 0 | 0 |
| 1 | 2 |
| 2 | 4 |
| 3 | 13 |
| 4 | 25 |
| 5 | 32 |
47) What is the physical meaning of
48) [T] Construct a table of values for
- Answer
-
Time (seconds) 0 2 1 2 2 5.5 3 10.5 4 9.5 5 7
49) [T] The best linear fit to the data is given by
50) [T] The best quadratic fit to the data is given by
- Answer
-
51) [T] The best cubic fit to the data is given by
52) Using the best linear, quadratic, and cubic fits to the data, determine what
- Answer