
2.1E: Exercises for Section 6.1
( \newcommand{\kernel}{\mathrm{null}\,}\)
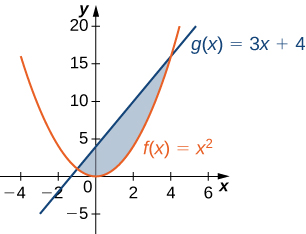
For exercises 1 - 2, determine the area of the region between the two curves in the given figure by integrating over the x-axis.
1) y=x2−3 and y=1
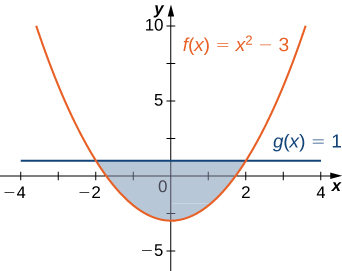
- Answer
- 323units2
2) y=x2 and y=3x+4
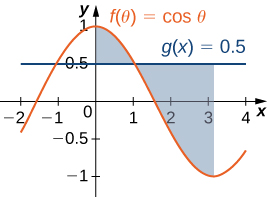
For exercises 3 - 4, split the region between the two curves into two smaller regions, then determine the area by integrating over the x-axis. Note that you will have two integrals to solve.
3) y=x3 and y=x2+x
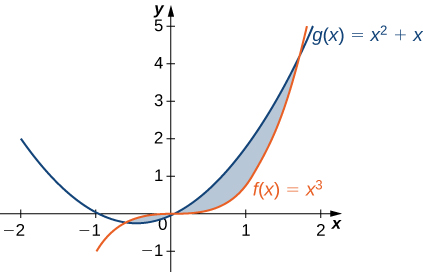
- Answer
- 1312units2
4) y=\cos θ and y=0.5, for 0≤θ≤π
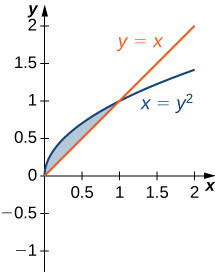
For exercises 5-6, determine the area of the region between the two curves by integrating over the y-axis.
5) x=y^2 and x=9
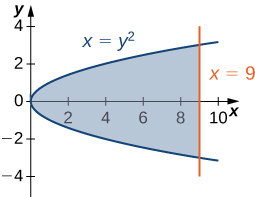
- Answer
- 36 \, \text{units}^2
6) y=x and x=y^2
For exercises 7 - 13, graph the equations and shade the area of the region between the curves. Determine its area by integrating over the x-axis.
7) y=x^2 and y=−x^2+18x
- Answer
-
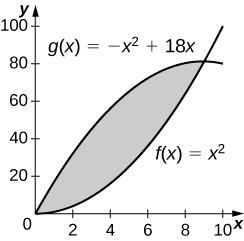
243 square units
8) y=\dfrac{1}{x}, \quad y=\dfrac{1}{x^2}, and x=3
9) y=\cos x and y=\cos^2x on x \in [−π,π]
- Answer
-
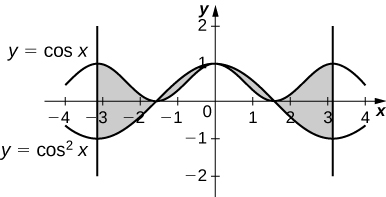
4 square units
10) y=e^x,\quad y=e^{2x−1}, and x=0
11) y=e^x, \quad y=e^{−x}, \quad x=−1 and x=1
- Answer
-
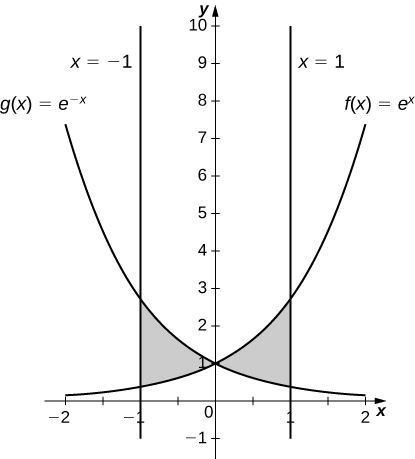
\dfrac{2(e−1)^2}{e}\, \text{units}^2
12) y=e, \quad y=e^x, and y=e^{−x}
13) y=|x| and y=x^2
- Answer
-
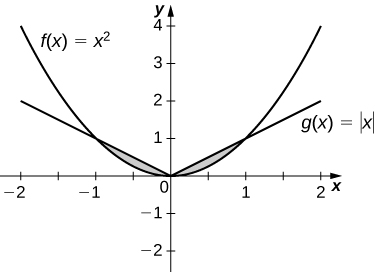
\dfrac{1}{3}\, \text{units}^2
For exercises 14 - 19, graph the equations and shade the area of the region between the curves. If necessary, break the region into sub-regions to determine its entire area.
14) y=\sin(πx),\quad y=2x, and x>0
15) y=12−x,\quad y=\sqrt{x}, and y=1
- Answer
-
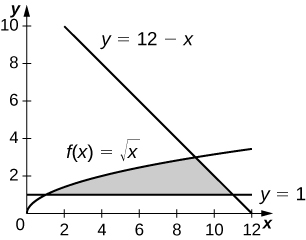
\dfrac{34}{3}\, \text{units}^2
16) y=\sin x and y=\cos x over x \in [−π,π]
17) y=x^3 and y=x^2−2x over x \in [−1,1]
- Answer
-
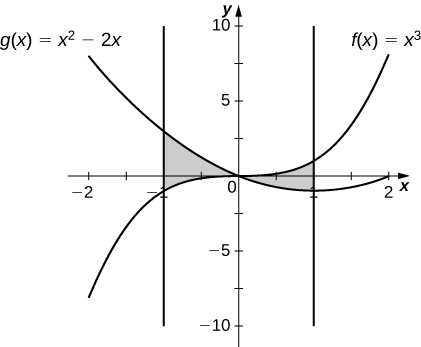
\dfrac{5}{2}\, \text{units}^2
18) y=x^2+9 and y=10+2x over x \in [−1,3]
19) y=x^3+3x and y=4x
- Answer
-
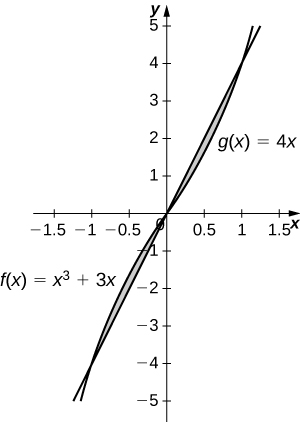
\dfrac{1}{2}\, \text{units}^2
For exercises 20 -25, graph the equations and shade the area of the region between the curves. Determine its area by integrating over the y-axis.
20) x=y^3 and x = 3y−2
21) x=2y and x=y^3−y
- Answer
-
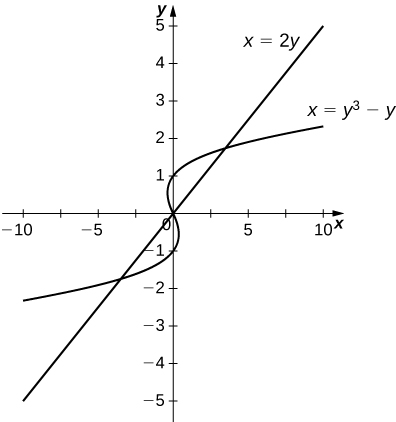
\dfrac{9}{2}\, \text{units}^2
22) x=−3+y^2 and x=y−y^2
23) y^2=x and x=y+2
- Answer
-
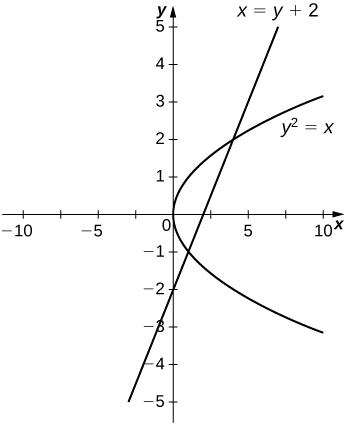
\dfrac{9}{2}\, \text{units}^2
24) x=|y| and 2x=−y^2+2
25) x=\sin y,\quad x=\cos(2y),\quad y=π/2, and y=−π/2
- Answer
-
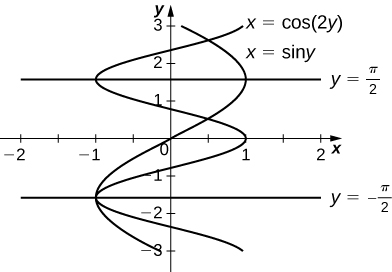
\dfrac{3\sqrt{3}}{2}\, \text{units}^2
For exercises 26 - 37, graph the equations and shade the area of the region between the curves. Determine its area by integrating over the x-axis or y-axis, whichever seems more convenient.
26) x=y^4 and x=y^5
27) y=xe^x,\quad y=e^x,\quad x=0, and x=1.
- Answer
-
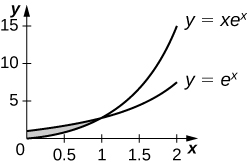
(e−2)\, \text{units}^2
28) y=x^6 and y=x^4
29) x=y^3+2y^2+1 and x=−y^2+1
- Answer
-

\dfrac{27}{4}\, \text{units}^2
30) y=|x| and y=x^2−1
31) y=4−3x and y=\dfrac{1}{x}
- Answer
-
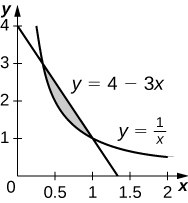
\left(\dfrac{4}{3}−\ln(3)\right)\, \text{units}^2
32) y=\sin x,\quad x=−π/6,\quad x=π/6, and y=\cos^3 x
33) y=x^2−3x+2 and y=x^3−2x^2−x+2
- Answer
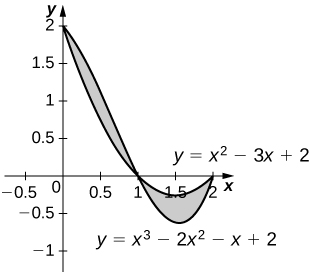
\dfrac{1}{2} square units
34) y=2\cos^3(3x),\quad y=−1,\quad x=\dfrac{π}{4}, and x=−\dfrac{π}{4}
35) y+y^3=x and 2y=x
- Answer
-
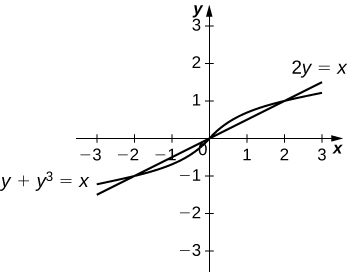
\dfrac{1}{2} square units
36) y=\sqrt{1−x^2} and y=x^2−1
37) y=\cos^{−1}x,\quad y=\sin^{−1}x,\quad x=−1, and x=1
- Answer
-
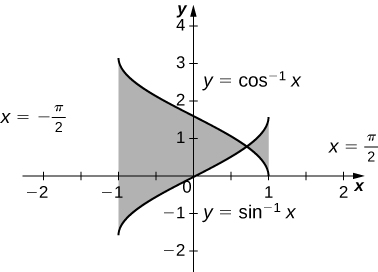
−2(\sqrt{2}−π) square units
For exercises 38 - 47, find the exact area of the region bounded by the given equations if possible. If you are unable to determine the intersection points analytically, use a calculator to approximate the intersection points with three decimal places and determine the approximate area of the region.
38) [T] x=e^y and y=x−2
39) [T] y=x^2 and y=\sqrt{1−x^2}
- Answer
- 1.067 square units
40) [T] y=3x^2+8x+9 and 3y=x+24
41) [T] x=\sqrt{4−y^2} and y^2=1+x^2
- Answer
- 0.852 square units
42) [T] x^2=y^3 and x=3y
43) [T] y=\sin^3x+2,\quad y=\tan x,\quad x=−1.5, and x=1.5
- Answer
- 7.523 square units
44) [T] y=\sqrt{1−x^2} and y^2=x^2
45) [T] y=\sqrt{1−x^2} and y=x^2+2x+1
- Answer
- \dfrac{3π−4}{12} square units
46) [T] x=4−y^2 and x=1+3y+y^2
47) [T] y=\cos x,\quad y=e^x,\quad x=−π,\quad and\quad x=0
- Answer
- 1.429 square units
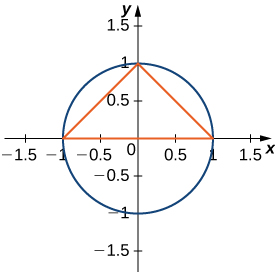
48) The largest triangle with a base on the x-axis that fits inside the upper half of the unit circle y^2+x^2=1 is given by y=1+x and y=1−x. See the following figure. What is the area inside the semicircle but outside the triangle?
49) A factory selling cell phones has a marginal cost function C(x)=0.01x^2−3x+229, where x represents the number of cell phones, and a marginal revenue function given by R(x)=429−2x. Find the area between the graphs of these curves and x=0. What does this area represent?
- Answer
- $33,333.33 total profit for 200 cell phones sold
50) An amusement park has a marginal cost function C(x)=1000e−x+5, where x represents the number of tickets sold, and a marginal revenue function given by R(x)=60−0.1x. Find the total profit generated when selling 550 tickets. Use a calculator to determine intersection points, if necessary, to two decimal places.
51) The tortoise versus the hare: The speed of the hare is given by the sinusoidal function H(t)=1−\cos((πt)/2) whereas the speed of the tortoise is T(t)=(1/2)\tan^{−1}(t/4), where t is time measured in hours and the speed is measured in miles per hour. Find the area between the curves from time t=0 to the first time after one hour when the tortoise and hare are traveling at the same speed. What does it represent? Use a calculator to determine the intersection points, if necessary, accurate to three decimal places.
- Answer
- 3.263 mi represents how far ahead the hare is from the tortoise
52) The tortoise versus the hare: The speed of the hare is given by the sinusoidal function H(t)=(1/2)−(1/2)\cos(2πt) whereas the speed of the tortoise is T(t)=\sqrt{t}, where t is time measured in hours and speed is measured in kilometers per hour. If the race is over in 1 hour, who won the race and by how much? Use a calculator to determine the intersection points, if necessary, accurate to three decimal places.
For exercises 53 - 55, find the area between the curves by integrating with respect to x and then with respect to y. Is one method easier than the other? Do you obtain the same answer?
53) y=x^2+2x+1 and y=−x^2−3x+4
- Answer
- \dfrac{343}{24} square units
54) y=x^4 and x=y^5
55) x=y^2−2 and x=2y
- Answer
- 4\sqrt{3} square units
For exercises 56 - 57, solve using calculus, then check your answer with geometry.
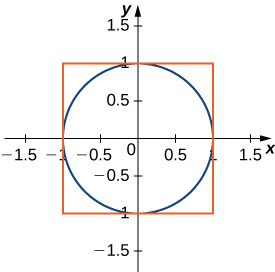
56) Determine the equations for the sides of the square that touches the unit circle on all four sides, as seen in the following figure. Find the area between the perimeter of this square and the unit circle. Is there another way to solve this without using calculus?
57) Find the area between the perimeter of the unit circle and the triangle created from y=2x+1,\,y=1−2x and y=−\dfrac{3}{5}, as seen in the following figure. Is there a way to solve this without using calculus?
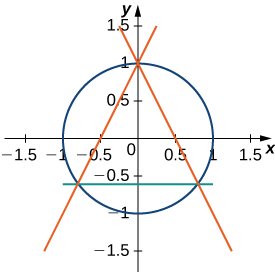
- Answer
- \left(π−\dfrac{32}{25}\right) square units
Contributors
Gilbert Strang (MIT) and Edwin “Jed” Herman (Harvey Mudd) with many contributing authors. This content by OpenStax is licensed with a CC-BY-SA-NC 4.0 license. Download for free at http://cnx.org.