
1.3E: Rates of Change and Behavior of Graphs
- Page ID
- 127004
- The table below gives the annual sales (in millions of dollars) of a product. What was the average rate of change of annual sales…
a) Between 2001 and 2002?
b) Between 2001 and 2004?year 1998 1999 2000 2001 2002 2003 2004 2005 2006 sales 201 219 233 243 249 251 249 243 233 - The table below gives the population of a town, in thousands. What was the average rate of change of population…
a) Between 2002 and 2004?
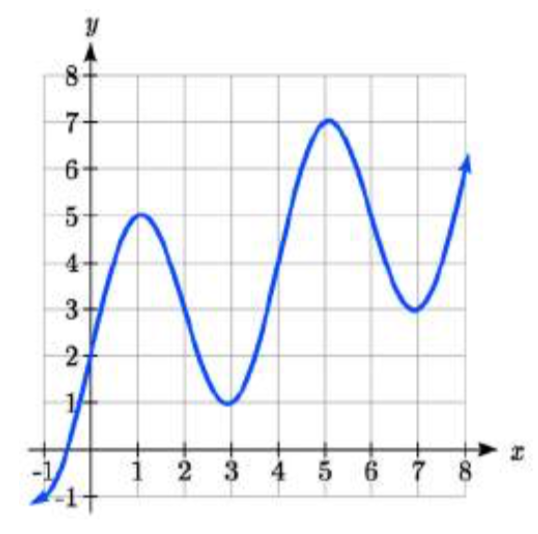
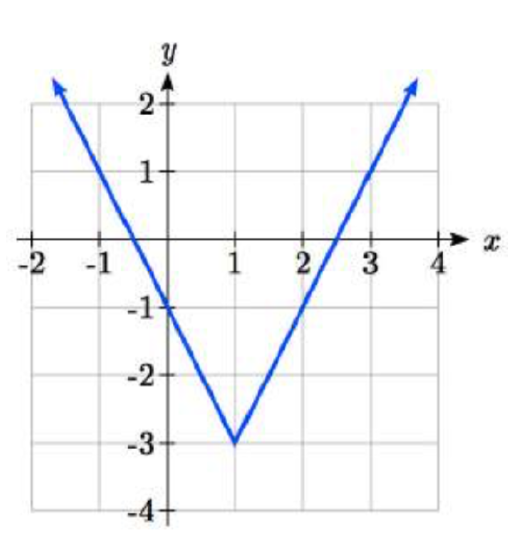
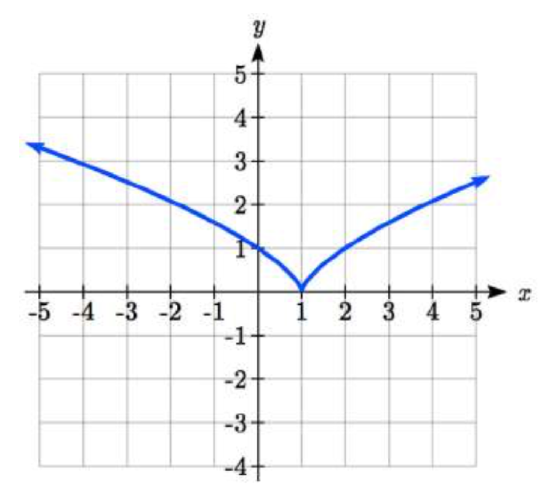
b) Between 2002 and 2006?year 2000 2001 2002 2003 2004 2005 2006 2007 2008 population 87 84 83 80 77 76 75 78 81 - Based on the graph shown, estimate the average rate of change from \(x = 1\) to \(x = 4\).
- Based on the graph shown, estimate the average rate of change from \(x = 2\) to \(x = 5\).
Find the average rate of change of each function on the interval specified. - \(f(x)=x^{2}\) on [1, 5]
- \(q(x)=x^{3}\) on [-4, 2]
- \(g(x)=3x^{3} -1\) on [-3, 3]
- \(h(x)=5 - 2x^{2}\) on [-2, 4]
- \(k(t)=6t^{2} +\dfrac{4}{t^{3} }\) on [-1, 3]
- \(p(t)=\dfrac{t^{2} - 4t + 1}{t^{2} + 3}\) on [-3, 1]
Find the average rate of change of each function on the interval specified. Your answers will be expressions involving a parameter (\(b\) or \(h\)). - \(f(x)= 4x^{2} -7\) on [1, \(b\)]
- \(g(x)= 2x^{2} -9\) on [4, \(b\)]
- \(h(x)= 3x + 4\) on [2, 2 + \(h\)]
- \(k(x)= 4x - 2\) on [3, 3 + \(h\)]
- \(a(t)=\dfrac{1}{t + 4}\) on [9, 9 + \(h\)]
- \(b(x)=\dfrac{1}{x + 3}\) on [1, 1 + \(h\)]
- \(j(x)=3x^{3}\) on [1, 1 + \(h\)]
- \(r(t)=4t^{3}\) on [2, 2 + \(h\)]
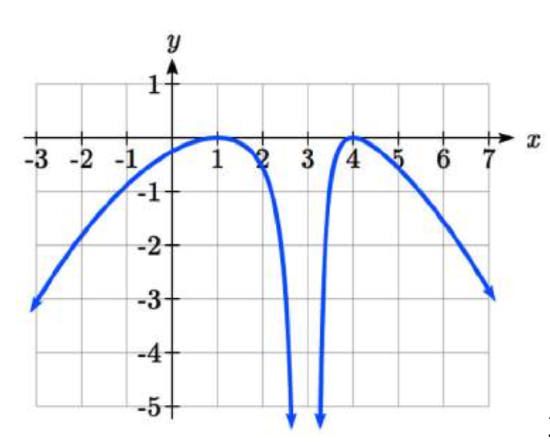
- \(f(x)=2x^{2} + 1\) on [\(x\), \(x + h\)]
- \(g(x)=3x^{2} - 2\) on [\(x\), \(x + h\)]
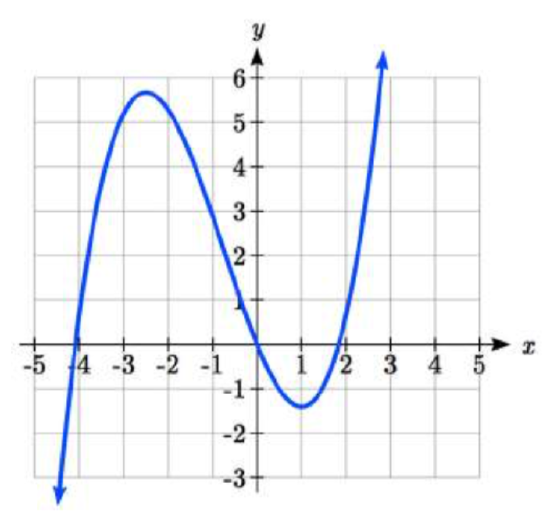
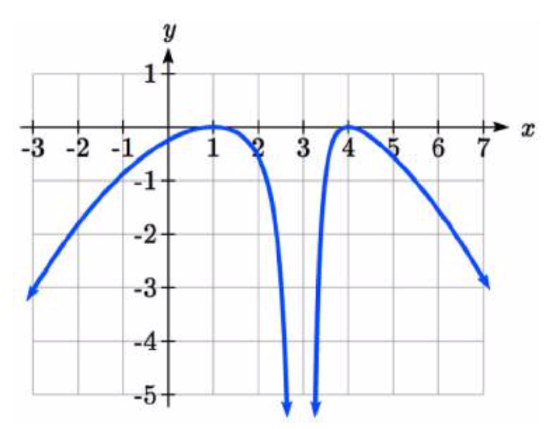
For each function graphed, estimate the intervals on which the function is increasing and decreasing. 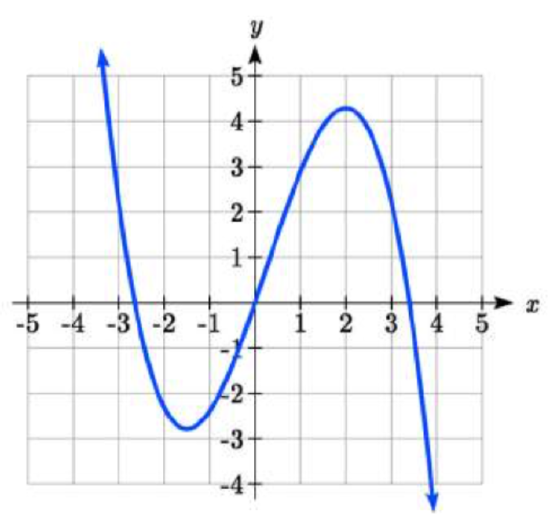
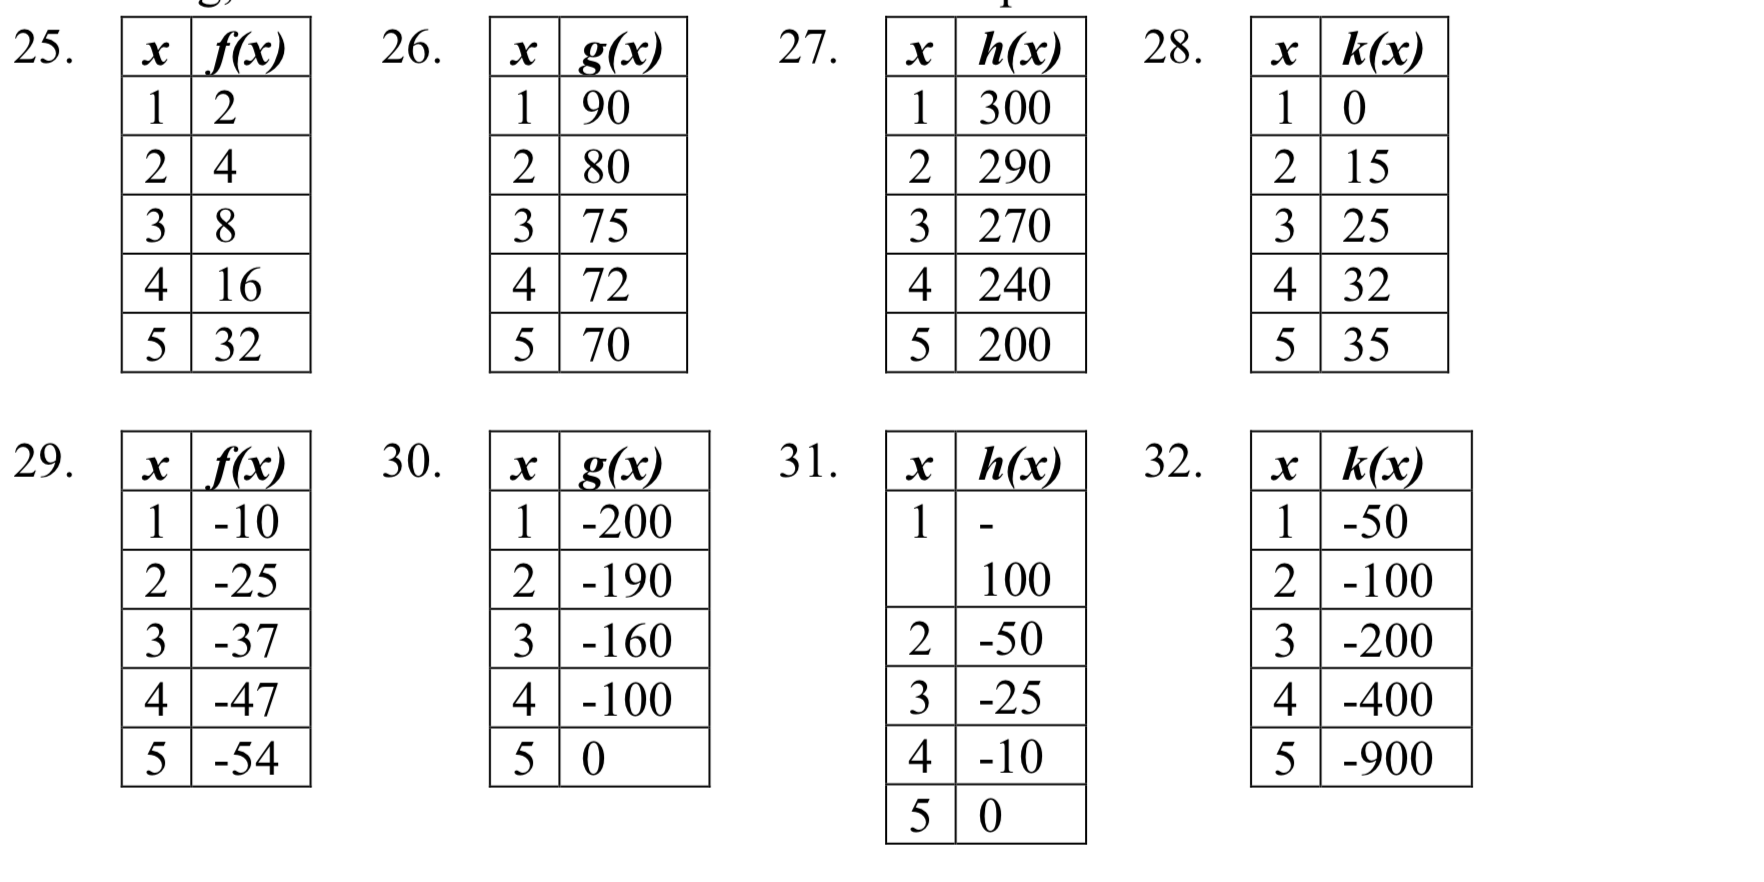
For each table below, select whether the table represents a function that is increasing or decreasing, and whether the function is concave up or concave down.
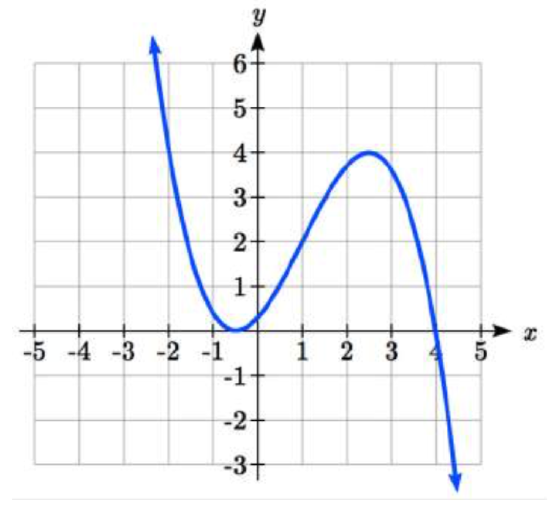
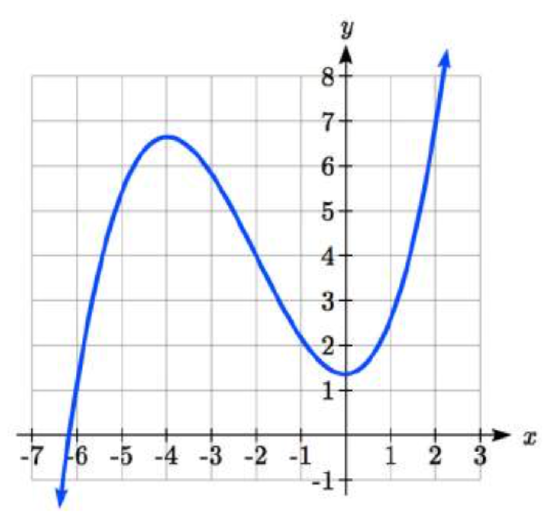
For each function graphed, estimate the intervals on which the function is concave up and concave down, and the location of any inflection points.
33. 
34. 
35. 
36. 
Use a graph to estimate the local extrema and inflection points of each function, and to estimate the intervals on which the function is increasing, decreasing, concave up, and concave down.
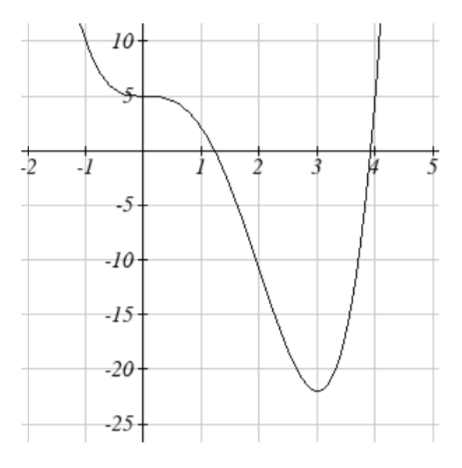
37. \(f(x) = x^4 - 4x^3 + 5\)
38. \(h(x) = x^5 + 5x^4 + 10x^3 + 10x^2 - 1\)
39. \(g(t) = t \sqrt{t + 3}\)
40. \(k(t) = 3t^{\dfrac{2}{3}} - t\)
41. \(m(x) = x^4 + 2x^3 - 12x^2 - 10x + 4\)
42. \(n(x) = x^4 - 8x^3 + 18x^2 - 6x + 2\)
- Answer
-
1. a) 6 million dollars per year
b) 2 million dollars per year3. \(\dfrac{4 - 5}{4 - 1} = -\dfrac{1}{3}\)
5. 6
7. 27
9. \(\dfrac{352}{27}\)
11. \(4b + 4\)
13. 3
15. \(-\dfrac{1}{13h + 169}\)
17. \(9 + 9h + 3h^2\)
19. \(4x + 2h\)
21. Increasing: (-1.5, 2). Decreasing: \((-\infty, -1.4) \cup (2, \infty)\)
23. Increasing: \((-\infty, 1) \cup (3,4)\). Decreasing: \((1, 3) \cup (4, \infty)\)
25. Increasing, concave up
27. Decreasing, concave down
29. Decreasing, concave up
31. Increasing, concave down
33. Concave up \((-\infty, 1)\). Concave down \((1, \infty)\). Inflection point at (1, 2)
 35. Concave down \(-\infty, 3) \cup (3, \infty)\)
37. Local minimum at (3, -22).
Inflection points at (0, 5) and (2, -11).
Increasing on \(3, \infty)\). Decreasing \((-\infty, 3)\)
Concave up \((-\infty, 0) \cup (2, \infty)\). Concave down (0, 2)39. Local minimum at \((-2, -2)\)
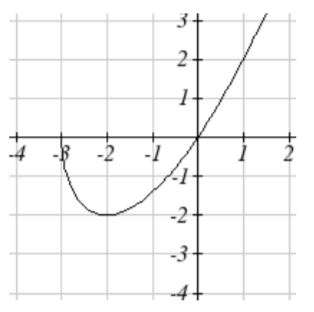
Decreasing (-3, -2)
Increasing \((-2, \infty)\)
Concave up \((-3, \infty)\)41. Local minimums at (-3.152, -47.626) and (2.041, -32.041)
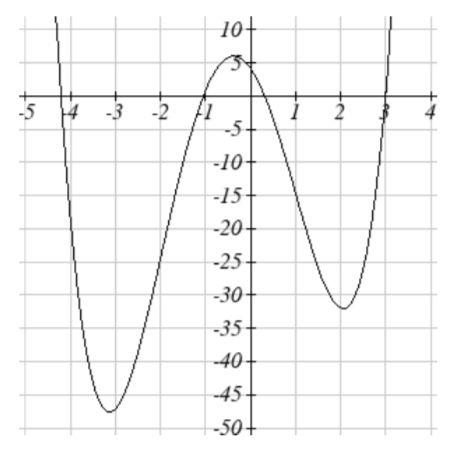
Local maximum at (-0.389, 5.979)
Inflection points at (-2, -24) and (1, -15)
Increasing \((-3.152, -0.389) \cup (2.041, \infty)\)
Decreasing \((-\infty, -3.152) \cup (-0.389, 2.041)\)
Concave up \((-\infty, -2) \cup (1, \infty)\)
Concave down (-2, 1