3.1.2.1: Exercises


- Last updated
- Dec 22, 2021
- Save as PDF

( \newcommand{\kernel}{\mathrm{null}\,}\)
- Create a Venn diagram to illustrate each of the following:
- (F∩E)∪D
- (D∪E)c∩F
- (Fc∩Ec)∩D
- (D∪E)∪F
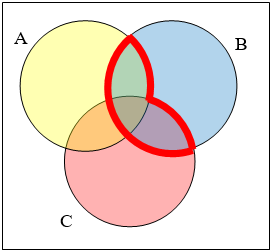
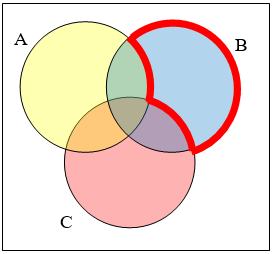
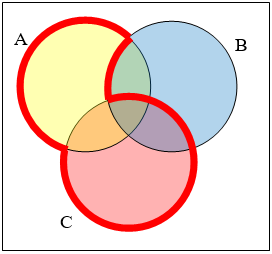
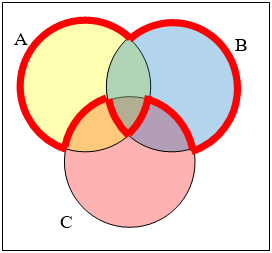
- Write an expression for the region outlined in red for the following Venn diagrams.
-
- Let A={1,2,3,4,5}B={1,3,5}C={4,6}. Find the cardinality of the given set.
- n(A)
- n(B)
- n(A∪C)
- n(A∩C)
- n(B∩C)
- The Venn diagram here shows the cardinality of each region in the diagram. Use this to find the cardinality of each given set.
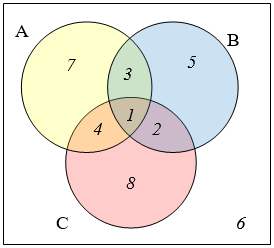
- n(A∩C)
- n(B∪C)
- n(A∩B∩Cc)
- n(A∩Bc∩C)
- If n(G)=20,n(H)=30,n(G∩H)=5, find n(G∪H)
- If n(G)=5,n(H)=8,n(G∩H)=4, find n(G∪H)
- A survey was given asking people whether they watch movies at home from Netflix, Hulu, or Amazon. Use the results to determine how many people use Redbox.
52 only use Netflix62 only use Hulu24 only use Amazon16 use only Amazon and Hulu48 use only Netflix and Hulu30 use only Amazon and Netflix10 use all three25 use none of these
- A survey asked buyers whether color, size, or brand influenced their choice of cell phone. The results are below. How many people were influenced by brand?
5 said only color8 said only size16 said only brand20 said only color and size42 said only color and brand53 said only size and brand102 said all three20 said none of these
- Use the given information to complete a Venn diagram, then determine: a) how many students have seen exactly one of these movies, and b) how many had seen only Star Wars.
18 had seen The Matrix (M)24 had seen Star Wars (SW)20 had seen Lord of the Rings (LotR)10 had seen M and SW14 had seen LotR and SW 12 had seen M and LotR6 had seen all three
- A survey asked people what alternative transportation modes they use. Using the data to complete a Venn diagram, then determine: a) what percent of people only ride the bus, and b) how many people don’t use any alternate transportation.
30% use the bus20% ride a bicycle25% walk5% use the bus and ride a bicycle10% ride a bicycle and walk12% use the bus and walk2% use all three