5.10.1: Exercises
- Page ID
- 85145

\( \newcommand{\vecs}[1]{\overset { \scriptstyle \rightharpoonup} {\mathbf{#1}} } \)
\( \newcommand{\vecd}[1]{\overset{-\!-\!\rightharpoonup}{\vphantom{a}\smash {#1}}} \)
\( \newcommand{\id}{\mathrm{id}}\) \( \newcommand{\Span}{\mathrm{span}}\)
( \newcommand{\kernel}{\mathrm{null}\,}\) \( \newcommand{\range}{\mathrm{range}\,}\)
\( \newcommand{\RealPart}{\mathrm{Re}}\) \( \newcommand{\ImaginaryPart}{\mathrm{Im}}\)
\( \newcommand{\Argument}{\mathrm{Arg}}\) \( \newcommand{\norm}[1]{\| #1 \|}\)
\( \newcommand{\inner}[2]{\langle #1, #2 \rangle}\)
\( \newcommand{\Span}{\mathrm{span}}\)
\( \newcommand{\id}{\mathrm{id}}\)
\( \newcommand{\Span}{\mathrm{span}}\)
\( \newcommand{\kernel}{\mathrm{null}\,}\)
\( \newcommand{\range}{\mathrm{range}\,}\)
\( \newcommand{\RealPart}{\mathrm{Re}}\)
\( \newcommand{\ImaginaryPart}{\mathrm{Im}}\)
\( \newcommand{\Argument}{\mathrm{Arg}}\)
\( \newcommand{\norm}[1]{\| #1 \|}\)
\( \newcommand{\inner}[2]{\langle #1, #2 \rangle}\)
\( \newcommand{\Span}{\mathrm{span}}\) \( \newcommand{\AA}{\unicode[.8,0]{x212B}}\)
\( \newcommand{\vectorA}[1]{\vec{#1}} % arrow\)
\( \newcommand{\vectorAt}[1]{\vec{\text{#1}}} % arrow\)
\( \newcommand{\vectorB}[1]{\overset { \scriptstyle \rightharpoonup} {\mathbf{#1}} } \)
\( \newcommand{\vectorC}[1]{\textbf{#1}} \)
\( \newcommand{\vectorD}[1]{\overrightarrow{#1}} \)
\( \newcommand{\vectorDt}[1]{\overrightarrow{\text{#1}}} \)
\( \newcommand{\vectE}[1]{\overset{-\!-\!\rightharpoonup}{\vphantom{a}\smash{\mathbf {#1}}}} \)
\( \newcommand{\vecs}[1]{\overset { \scriptstyle \rightharpoonup} {\mathbf{#1}} } \)
\( \newcommand{\vecd}[1]{\overset{-\!-\!\rightharpoonup}{\vphantom{a}\smash {#1}}} \)
\(\newcommand{\avec}{\mathbf a}\) \(\newcommand{\bvec}{\mathbf b}\) \(\newcommand{\cvec}{\mathbf c}\) \(\newcommand{\dvec}{\mathbf d}\) \(\newcommand{\dtil}{\widetilde{\mathbf d}}\) \(\newcommand{\evec}{\mathbf e}\) \(\newcommand{\fvec}{\mathbf f}\) \(\newcommand{\nvec}{\mathbf n}\) \(\newcommand{\pvec}{\mathbf p}\) \(\newcommand{\qvec}{\mathbf q}\) \(\newcommand{\svec}{\mathbf s}\) \(\newcommand{\tvec}{\mathbf t}\) \(\newcommand{\uvec}{\mathbf u}\) \(\newcommand{\vvec}{\mathbf v}\) \(\newcommand{\wvec}{\mathbf w}\) \(\newcommand{\xvec}{\mathbf x}\) \(\newcommand{\yvec}{\mathbf y}\) \(\newcommand{\zvec}{\mathbf z}\) \(\newcommand{\rvec}{\mathbf r}\) \(\newcommand{\mvec}{\mathbf m}\) \(\newcommand{\zerovec}{\mathbf 0}\) \(\newcommand{\onevec}{\mathbf 1}\) \(\newcommand{\real}{\mathbb R}\) \(\newcommand{\twovec}[2]{\left[\begin{array}{r}#1 \\ #2 \end{array}\right]}\) \(\newcommand{\ctwovec}[2]{\left[\begin{array}{c}#1 \\ #2 \end{array}\right]}\) \(\newcommand{\threevec}[3]{\left[\begin{array}{r}#1 \\ #2 \\ #3 \end{array}\right]}\) \(\newcommand{\cthreevec}[3]{\left[\begin{array}{c}#1 \\ #2 \\ #3 \end{array}\right]}\) \(\newcommand{\fourvec}[4]{\left[\begin{array}{r}#1 \\ #2 \\ #3 \\ #4 \end{array}\right]}\) \(\newcommand{\cfourvec}[4]{\left[\begin{array}{c}#1 \\ #2 \\ #3 \\ #4 \end{array}\right]}\) \(\newcommand{\fivevec}[5]{\left[\begin{array}{r}#1 \\ #2 \\ #3 \\ #4 \\ #5 \\ \end{array}\right]}\) \(\newcommand{\cfivevec}[5]{\left[\begin{array}{c}#1 \\ #2 \\ #3 \\ #4 \\ #5 \\ \end{array}\right]}\) \(\newcommand{\mattwo}[4]{\left[\begin{array}{rr}#1 \amp #2 \\ #3 \amp #4 \\ \end{array}\right]}\) \(\newcommand{\laspan}[1]{\text{Span}\{#1\}}\) \(\newcommand{\bcal}{\cal B}\) \(\newcommand{\ccal}{\cal C}\) \(\newcommand{\scal}{\cal S}\) \(\newcommand{\wcal}{\cal W}\) \(\newcommand{\ecal}{\cal E}\) \(\newcommand{\coords}[2]{\left\{#1\right\}_{#2}}\) \(\newcommand{\gray}[1]{\color{gray}{#1}}\) \(\newcommand{\lgray}[1]{\color{lightgray}{#1}}\) \(\newcommand{\rank}{\operatorname{rank}}\) \(\newcommand{\row}{\text{Row}}\) \(\newcommand{\col}{\text{Col}}\) \(\renewcommand{\row}{\text{Row}}\) \(\newcommand{\nul}{\text{Nul}}\) \(\newcommand{\var}{\text{Var}}\) \(\newcommand{\corr}{\text{corr}}\) \(\newcommand{\len}[1]{\left|#1\right|}\) \(\newcommand{\bbar}{\overline{\bvec}}\) \(\newcommand{\bhat}{\widehat{\bvec}}\) \(\newcommand{\bperp}{\bvec^\perp}\) \(\newcommand{\xhat}{\widehat{\xvec}}\) \(\newcommand{\vhat}{\widehat{\vvec}}\) \(\newcommand{\uhat}{\widehat{\uvec}}\) \(\newcommand{\what}{\widehat{\wvec}}\) \(\newcommand{\Sighat}{\widehat{\Sigma}}\) \(\newcommand{\lt}{<}\) \(\newcommand{\gt}{>}\) \(\newcommand{\amp}{&}\) \(\definecolor{fillinmathshade}{gray}{0.9}\)
- Is it possible to have a data set where the mean and median are not one of the data values?
- Diners were asked how much they would pay for a meal. Their responses were: $7.50, $8.25, $9.00, $8.00, $7.25, $7.50, $8.00, $7.00.
- Find the mean of the prices diners would be willing to pay for a meal.
- Find the median of the prices.
- Write the mode price, if any.
- You recorded the time in seconds it took for 8 participants to solve a puzzle. The times were: 15.2, 18.8, 19.3, 19.7, 20.2, 21.8, 22.1, 29.4.
- Find the mean of the times it took participants to solve a puzzle.
- Find the median of the times.
- Write the mode time, if any.
- A group of adults were asked how many children they have in their families. The bar graph to the right shows the number of adults who indicated each number of children.

- How many adults were surveyed?
- Compute the mean number of children for each adult in the group surveyed.
- Compute the median number of children for the group surveyed.
- Write the mode number of children, if any.
- Jasmine was interested in how many days it would take an order from Amazon to arrive at her door. The graph below shows the data she collected.

- How many Amazon orders did Jasmine make?
- Compute the mean number of shipping days for Jasmine's orders.
- Compute the median number of shipping days.
- Write the mode number of shipping days, if any.
- The ages of the U.S. Presidents who were inaugurated in the 20th century are given.
42; 51; 56; 55; 51; 54; 51; 60; 62; 43; 55; 56; 61; 52; 69; 64; 46
- Find the mean, median, and mode of these ages.
- What was a typical age for a U.S. President in the 20th century?
- Results for 40 students on a recent English exam are given.
83; 76; 98; 75; 56; 47; 67; 92; 69; 74; 72; 84; 96; 66; 51; 64; 58; 80; 85; 78; 58; 88; 90; 76; 74; 82; 76; 66; 50; 84; 66; 79; 83; 43; 54; 93; 77; 67; 54; 76
- Find the mean, median, and mode of these data values.
- If everyone whose score is at least average on this exam gets a C or higher, which average should be used?
- How many students had scores below average?
- Find the mean, median and mode for the following data set.
1.8; 4.0; 5.2; 2.9; 4.4; 4.4; 3.4; 4.9; 3.8; 2.7; 2.7
- The table shows the salaries of employees of a small company.
\(\begin{array}{|l|l|}
\hline \text { Salary } & \text { Frequency } \\
\hline $40,000 & 4 \\
\hline $43,000 & 3 \\
\hline $45,000 & 2 \\
\hline $75,000 & 1 \\
\hline
\end{array}\)- Find the mean, median, and mode of these salaries.
- b. Which number best represents a typical salary for the employees at the company?
- A class had the following scores on an exam.
\(\begin{array}{|l|l|}
\hline \text { Test Score } & \text { Frequency } \\
\hline 90 & 2 \\
\hline 80 & 4 \\
\hline 70 & 9 \\
\hline 60 & 5 \\
\hline 50 & 3 \\
\hline 40 & 1 \\
\hline 30 & 2 \\
\hline 0 & 4 \\
\hline
\end{array}\)- Find the mean, median, and mode score for the class.
- Which value do you think best represents how the class did?
- Comparable printers from three different companies were tested for printing speed in pages per minute (ppm). Each printer manufacturer claims that its printer has a faster average printing speed than its competitors. Results are shown in the table below.
Test 1 Test 2 Test 3 Test 4 Test 5 Printer X (ppm) 48 52 50 47 52 Printer Y (ppm) 50 48 54 48 52 Printer Z (ppm) 48 51 52 47 51 - Which average would the manufacturer of Printer X use to support its claim?
- Which average would the manufacturer of Printer Y use to support its claim?
- Which average would the manufacturer of Printer Z use to support its claim?
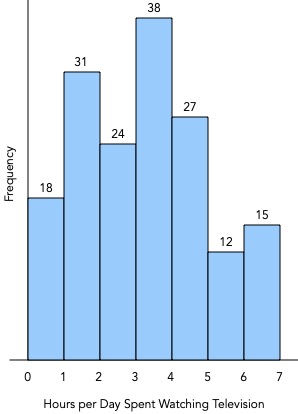
- The frequency histogram below shows the number of hours per day a random sample of teenagers spent watching television. Find the mean, median, and mode number of hours of television watched by these teenagers.
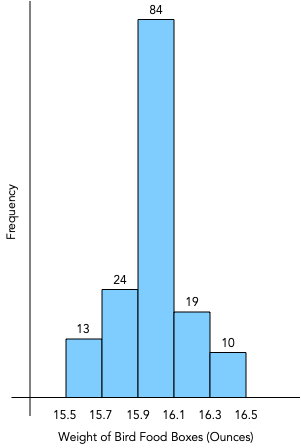
- A pet food company is testing the accuracy of the machine that fills its boxes with bird food. The weights of the sample boxes are shown in the frequency histogram. Find the mean, median, and mode of the weights of the bird food boxes.