2.1: Functions
- Page ID
- 139262
\( \newcommand{\vecs}[1]{\overset { \scriptstyle \rightharpoonup} {\mathbf{#1}} } \)
\( \newcommand{\vecd}[1]{\overset{-\!-\!\rightharpoonup}{\vphantom{a}\smash {#1}}} \)
\( \newcommand{\id}{\mathrm{id}}\) \( \newcommand{\Span}{\mathrm{span}}\)
( \newcommand{\kernel}{\mathrm{null}\,}\) \( \newcommand{\range}{\mathrm{range}\,}\)
\( \newcommand{\RealPart}{\mathrm{Re}}\) \( \newcommand{\ImaginaryPart}{\mathrm{Im}}\)
\( \newcommand{\Argument}{\mathrm{Arg}}\) \( \newcommand{\norm}[1]{\| #1 \|}\)
\( \newcommand{\inner}[2]{\langle #1, #2 \rangle}\)
\( \newcommand{\Span}{\mathrm{span}}\)
\( \newcommand{\id}{\mathrm{id}}\)
\( \newcommand{\Span}{\mathrm{span}}\)
\( \newcommand{\kernel}{\mathrm{null}\,}\)
\( \newcommand{\range}{\mathrm{range}\,}\)
\( \newcommand{\RealPart}{\mathrm{Re}}\)
\( \newcommand{\ImaginaryPart}{\mathrm{Im}}\)
\( \newcommand{\Argument}{\mathrm{Arg}}\)
\( \newcommand{\norm}[1]{\| #1 \|}\)
\( \newcommand{\inner}[2]{\langle #1, #2 \rangle}\)
\( \newcommand{\Span}{\mathrm{span}}\) \( \newcommand{\AA}{\unicode[.8,0]{x212B}}\)
\( \newcommand{\vectorA}[1]{\vec{#1}} % arrow\)
\( \newcommand{\vectorAt}[1]{\vec{\text{#1}}} % arrow\)
\( \newcommand{\vectorB}[1]{\overset { \scriptstyle \rightharpoonup} {\mathbf{#1}} } \)
\( \newcommand{\vectorC}[1]{\textbf{#1}} \)
\( \newcommand{\vectorD}[1]{\overrightarrow{#1}} \)
\( \newcommand{\vectorDt}[1]{\overrightarrow{\text{#1}}} \)
\( \newcommand{\vectE}[1]{\overset{-\!-\!\rightharpoonup}{\vphantom{a}\smash{\mathbf {#1}}}} \)
\( \newcommand{\vecs}[1]{\overset { \scriptstyle \rightharpoonup} {\mathbf{#1}} } \)
\( \newcommand{\vecd}[1]{\overset{-\!-\!\rightharpoonup}{\vphantom{a}\smash {#1}}} \)
The natural world is full of relationships between quantities that change. When we see these relationships, it is natural for us to ask “If I know one quantity, can I then determine the other?” This establishes the idea of an input quantity, or independent variable, and a corresponding output quantity, or dependent variable. From this we get the notion of a functional relationship in which the output can be determined from the input.
For some quantities, like height and age, there are certainly relationships between these quantities. Given a specific person and any age, it is easy enough to determine their height, but if we tried to reverse that relationship and determine age from a given height, that would be problematic, since most people maintain the same height for many years.
A function is a rule for a relationship between an input, or independent, quantity and an output, or dependent, quantity in which each input value uniquely determines one output value. We say “the output is a function of the input.”
To simplify writing out expressions and equations involving functions, a simplified notation is often used
FUNCTION NOTATION is used to indicate a functional relationship between two quantities as follows:
Function Name \((\) INPUT) \(=\) OUTPUT
So, the statement \(f(x)=y\) would refer to the function \(f\), and correspond to the ordered pair \((x, y)\), where \(x\) is the input variable, and \(y\) is the output variable.
Rather than write "height is a function of age", we could use the descriptive variable \(h\) to represent height and we could use the descriptive variable \(a\) to represent age.
"Height is a function of age"
If we name the function \(f\) we write " \(h\) is \(f\) of \(a\) " or more simply " \(h=f(a)\) "
We could instead name the function \(h\) and write " \(h(a)\) " which is read " \(h\) of \(a\) " and still means "height is a function of age".
Remember we can use any variable to name the function; the notation \(h(a)\) shows us that \(h\) depends on \(a\). The value " \(a\) " must be put into the function " \(h\) " to get a result. Be careful - the parentheses indicate that age is input into the function (Note: do not confuse these parentheses with multiplication!).
The number of days in a month is a function of the name of the month, so if we name the function f, we could write “days = f(month)” or d = f(m). If we simply name the function d, we could write d(m)
For example, d(March) = 31, since March has 31 days. The notation d(m) reminds us that the number of days, d is dependent on the name of the month, m. Here the number of days is the output, and the name of the month is the input.
A function P(n) gives the number of police officers in a town n years after 2000. What does P(5) = 300 tell us?
Solution
When we read P(5) = 300, we see the value for the input quantity of the function is 5, meaning 5 years after 2000. This gives us the year 2000 + 5 = 2005. The output value is 300, the number of police officers. So this tells us that in the year 2005 there were 300 police officers in the town.
When we work with functions, there are two typical things we do: evaluate and solve. Evaluating a function is what we do when we know an input, and use the function to determine the corresponding output. Evaluating will always produce one result, since each input of a function corresponds to exactly one output.
Solving equations involving a function is what we do when we know an output, and use the function to determine the inputs that would produce that output. Solving a function could produce more than one solution, since different inputs can produce the same output.
Using the table shown,
|
|
1 |
2 |
3 |
4 |
5 |
|---|---|---|---|---|---|
|
g(n) |
8 |
6 |
7 |
6 |
8 |
a) Evaluate g(3)
b) Determine n when g(n) = 6.
Solution
- Evaluating g(3) (read: “g of 3”) means that we need to determine the output value of the function g given the input value of n=3. Looking at the table, we see the output corresponding to n=3 is g(n)=7, allowing us to conclude g(3) = 7.
- Determine n when g(n) = 6. Here, we need to determine what input (n) value(s) produce an output value of 6. Looking at the table we see there are two solutions: n = 2 and n = 4. When we input 2 into the function g, our output is 6. When we input 4 into the function g, our output is also 6.
The function k(m) is given by the table below.
|
m |
-2 |
0 |
1 |
4 |
8 |
15 |
|---|---|---|---|---|---|---|
|
k(m) |
4 |
8 |
32 |
51 |
33 |
1 |
a. Evaluate k(4). b. Determine m when k(m)=8.
- Answer
-
a. 51 b. 0
Graphs as Functions
Oftentimes a graph of a relationship can be used to define a function. By convention, graphs are typically created with the input quantity along the horizontal axis and the output quantity along the vertical axis. The most common graph has y on the vertical axis and x on the horizontal axis, and we say y is a function of x, or y = f(x) when the function is named f.
Evaluating a function using a graph requires taking the given input and using the graph to look up the corresponding output. Solving a function equation using a graph requires taking the given output and looking on the graph to determine the corresponding input.
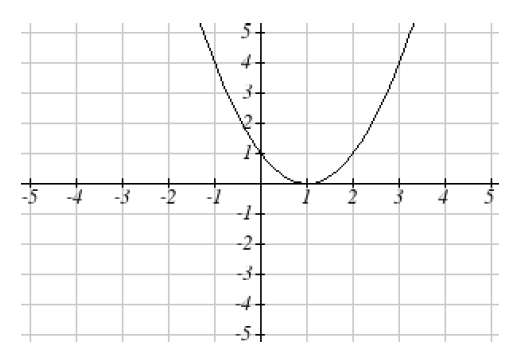
Given the graph below, a) Evaluate f(2) b) Determine x when f(x) = 4
Solution
- To evaluate \(f(2)\), we find the input of \(x=2\) on the horizontal axis. Moving up to the graph gives the point \((2,1)\), giving an output of \(y=1\). So \(f(2)=1\)
- To determine \(x\) when \(f(x)=4\), we find the value 4 on the vertical axis because if \(f(x)=4\) then 4 is the output. Moving horizontally across the graph gives two points with the output of 4 : \((-1,4)\) and \((3,4)\). These give the two solutions to \(f(x)=4\) : \(x=-1\) or \(x=3\). This means \(f(-1)=4\) and \(f(3)=4\), or when the input is -1 or 3 , the output is 4 .
The function f(x) is given below. a. Evaluate f(1) b. Determine x when f(x)=1.

- Answer
-
a. 0 b. 0 or 2
Formulas as Functions
When possible, it is very convenient to define relationships using formulas. If it is possible to express the output as a formula involving the input quantity, then we can define a function. As with tables and graphs, it is common to evaluate and solve functions involving formulas. Evaluating will require replacing the input variable in the formula with the value provided and calculating. Solving will require replacing the output variable in the formula with the value provided, and solving for the input(s) that would produce that output.
Given the function \(k(t)=2 t+5\)
a) Evaluate \(k(8)\)
b) Determine \(t\) when \(k(t)=1\)
Solution
a) To evaluate \(k(8)\), we plug in the input value 8 into the formula wherever we see the input variable \(t\), then simplify
\[
\begin{array}{c}
k(8)=2(8)+5 \\
k(8)=16+5 \\
\text { So } k(8)=21
\end{array}
\]
b) To determine \(t\) when \(k(t)=1\), we set the formula for \(k(t)\) equal to 1 , and solve for the input value that will produce that output
\[
\begin{array}{ll}
k(t)=1 & \text { substitute the original formula } k(t)=2 t+5 \\
2 t+5=1 & \text { Solve for } t \\
2 t=-4 & \\
t=-2 &
\end{array}
\]
When solving an equation using formulas, you can check your answer by using your solution in the original equation to see if your calculated answer is correct.
We want to know if \(k(t)=1\) is true when \(t=-2\).
\[
\begin{aligned}
k(-2) & =2(-2)+5 \\
& =-4+5 \\
& =1
\end{aligned}
\]
(which was the desired result).
Given the function \(g(m)=5 m+17\)
a. Evaluate \(g(9)\)
b. Determine \(m\) when \(g(m)=2\)
- Answer
-
a. 28 b. -3
Graphical Behavior of Functions
As part of exploring how functions change, it is interesting to explore the graphical
behavior of functions.
As we move from left to right (the inputs increase), we say a function is:
- INCREASING if the outputs get larger,
- DECREASING if the outputs get smaller,
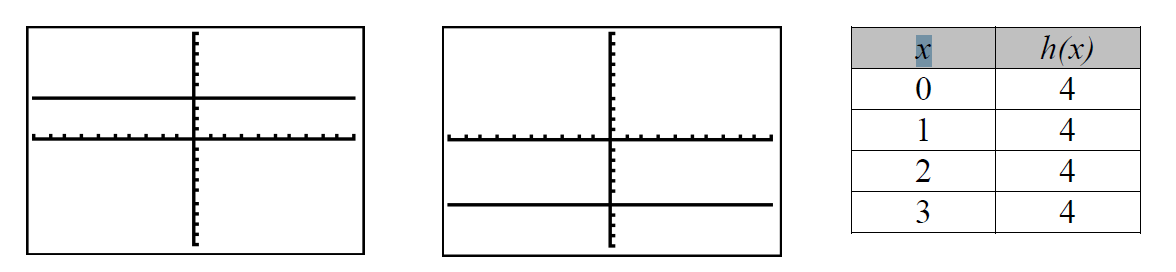
- CONSTANT if the outputs do not change.
NOTE: We read graphs just like we read a book…from left to right.
The following functions are INCREASING

The following functions are DECREASING

The following functions are CONSTANT