
2.4: Graphing Quadratic Functions Using Properties
- Page ID
- 48335
\( \newcommand{\vecs}[1]{\overset { \scriptstyle \rightharpoonup} {\mathbf{#1}} } \)
\( \newcommand{\vecd}[1]{\overset{-\!-\!\rightharpoonup}{\vphantom{a}\smash {#1}}} \)
\( \newcommand{\dsum}{\displaystyle\sum\limits} \)
\( \newcommand{\dint}{\displaystyle\int\limits} \)
\( \newcommand{\dlim}{\displaystyle\lim\limits} \)
\( \newcommand{\id}{\mathrm{id}}\) \( \newcommand{\Span}{\mathrm{span}}\)
( \newcommand{\kernel}{\mathrm{null}\,}\) \( \newcommand{\range}{\mathrm{range}\,}\)
\( \newcommand{\RealPart}{\mathrm{Re}}\) \( \newcommand{\ImaginaryPart}{\mathrm{Im}}\)
\( \newcommand{\Argument}{\mathrm{Arg}}\) \( \newcommand{\norm}[1]{\| #1 \|}\)
\( \newcommand{\inner}[2]{\langle #1, #2 \rangle}\)
\( \newcommand{\Span}{\mathrm{span}}\)
\( \newcommand{\id}{\mathrm{id}}\)
\( \newcommand{\Span}{\mathrm{span}}\)
\( \newcommand{\kernel}{\mathrm{null}\,}\)
\( \newcommand{\range}{\mathrm{range}\,}\)
\( \newcommand{\RealPart}{\mathrm{Re}}\)
\( \newcommand{\ImaginaryPart}{\mathrm{Im}}\)
\( \newcommand{\Argument}{\mathrm{Arg}}\)
\( \newcommand{\norm}[1]{\| #1 \|}\)
\( \newcommand{\inner}[2]{\langle #1, #2 \rangle}\)
\( \newcommand{\Span}{\mathrm{span}}\) \( \newcommand{\AA}{\unicode[.8,0]{x212B}}\)
\( \newcommand{\vectorA}[1]{\vec{#1}} % arrow\)
\( \newcommand{\vectorAt}[1]{\vec{\text{#1}}} % arrow\)
\( \newcommand{\vectorB}[1]{\overset { \scriptstyle \rightharpoonup} {\mathbf{#1}} } \)
\( \newcommand{\vectorC}[1]{\textbf{#1}} \)
\( \newcommand{\vectorD}[1]{\overrightarrow{#1}} \)
\( \newcommand{\vectorDt}[1]{\overrightarrow{\text{#1}}} \)
\( \newcommand{\vectE}[1]{\overset{-\!-\!\rightharpoonup}{\vphantom{a}\smash{\mathbf {#1}}}} \)
\( \newcommand{\vecs}[1]{\overset { \scriptstyle \rightharpoonup} {\mathbf{#1}} } \)
\(\newcommand{\longvect}{\overrightarrow}\)
\( \newcommand{\vecd}[1]{\overset{-\!-\!\rightharpoonup}{\vphantom{a}\smash {#1}}} \)
\(\newcommand{\avec}{\mathbf a}\) \(\newcommand{\bvec}{\mathbf b}\) \(\newcommand{\cvec}{\mathbf c}\) \(\newcommand{\dvec}{\mathbf d}\) \(\newcommand{\dtil}{\widetilde{\mathbf d}}\) \(\newcommand{\evec}{\mathbf e}\) \(\newcommand{\fvec}{\mathbf f}\) \(\newcommand{\nvec}{\mathbf n}\) \(\newcommand{\pvec}{\mathbf p}\) \(\newcommand{\qvec}{\mathbf q}\) \(\newcommand{\svec}{\mathbf s}\) \(\newcommand{\tvec}{\mathbf t}\) \(\newcommand{\uvec}{\mathbf u}\) \(\newcommand{\vvec}{\mathbf v}\) \(\newcommand{\wvec}{\mathbf w}\) \(\newcommand{\xvec}{\mathbf x}\) \(\newcommand{\yvec}{\mathbf y}\) \(\newcommand{\zvec}{\mathbf z}\) \(\newcommand{\rvec}{\mathbf r}\) \(\newcommand{\mvec}{\mathbf m}\) \(\newcommand{\zerovec}{\mathbf 0}\) \(\newcommand{\onevec}{\mathbf 1}\) \(\newcommand{\real}{\mathbb R}\) \(\newcommand{\twovec}[2]{\left[\begin{array}{r}#1 \\ #2 \end{array}\right]}\) \(\newcommand{\ctwovec}[2]{\left[\begin{array}{c}#1 \\ #2 \end{array}\right]}\) \(\newcommand{\threevec}[3]{\left[\begin{array}{r}#1 \\ #2 \\ #3 \end{array}\right]}\) \(\newcommand{\cthreevec}[3]{\left[\begin{array}{c}#1 \\ #2 \\ #3 \end{array}\right]}\) \(\newcommand{\fourvec}[4]{\left[\begin{array}{r}#1 \\ #2 \\ #3 \\ #4 \end{array}\right]}\) \(\newcommand{\cfourvec}[4]{\left[\begin{array}{c}#1 \\ #2 \\ #3 \\ #4 \end{array}\right]}\) \(\newcommand{\fivevec}[5]{\left[\begin{array}{r}#1 \\ #2 \\ #3 \\ #4 \\ #5 \\ \end{array}\right]}\) \(\newcommand{\cfivevec}[5]{\left[\begin{array}{c}#1 \\ #2 \\ #3 \\ #4 \\ #5 \\ \end{array}\right]}\) \(\newcommand{\mattwo}[4]{\left[\begin{array}{rr}#1 \amp #2 \\ #3 \amp #4 \\ \end{array}\right]}\) \(\newcommand{\laspan}[1]{\text{Span}\{#1\}}\) \(\newcommand{\bcal}{\cal B}\) \(\newcommand{\ccal}{\cal C}\) \(\newcommand{\scal}{\cal S}\) \(\newcommand{\wcal}{\cal W}\) \(\newcommand{\ecal}{\cal E}\) \(\newcommand{\coords}[2]{\left\{#1\right\}_{#2}}\) \(\newcommand{\gray}[1]{\color{gray}{#1}}\) \(\newcommand{\lgray}[1]{\color{lightgray}{#1}}\) \(\newcommand{\rank}{\operatorname{rank}}\) \(\newcommand{\row}{\text{Row}}\) \(\newcommand{\col}{\text{Col}}\) \(\renewcommand{\row}{\text{Row}}\) \(\newcommand{\nul}{\text{Nul}}\) \(\newcommand{\var}{\text{Var}}\) \(\newcommand{\corr}{\text{corr}}\) \(\newcommand{\len}[1]{\left|#1\right|}\) \(\newcommand{\bbar}{\overline{\bvec}}\) \(\newcommand{\bhat}{\widehat{\bvec}}\) \(\newcommand{\bperp}{\bvec^\perp}\) \(\newcommand{\xhat}{\widehat{\xvec}}\) \(\newcommand{\vhat}{\widehat{\vvec}}\) \(\newcommand{\uhat}{\widehat{\uvec}}\) \(\newcommand{\what}{\widehat{\wvec}}\) \(\newcommand{\Sighat}{\widehat{\Sigma}}\) \(\newcommand{\lt}{<}\) \(\newcommand{\gt}{>}\) \(\newcommand{\amp}{&}\) \(\definecolor{fillinmathshade}{gray}{0.9}\)Learning Objectives
By the end of this section, you will be able to:
- Recognize the graph of a quadratic function
- Find the axis of symmetry and vertex of a parabola
- Find the intercepts of a parabola
- Graph quadratic functions using properties
- Identify domain and range of quadratic functions
- Solve maximum and minimum applications
Prerequisite Skills
Before you get started, take this prerequisite quiz.
1. Sketch a graph of \(y=x^2\). Include at least 3 key points on the graph.
- Click here to check your answer
-

If you missed this problem, review Section 2.2. (Note that this will open in a new window.)
2. If \(f(x)=2x^2-x+1\), find each of the following:
a. \(f(3)\)
b. \(f(-2)\)
- Click here to check your answer
-
a. \(16\)
b. \(11\)
If you missed any part of this problem, review Section 2.1. (Note that this will open in a new window.)
Recognize the Graph of a Quadratic Function
Previously we very briefly looked at the function \(f(x)=x^{2}\), which we called the square function. It was one of the first non-linear functions we looked at. Now we will graph functions of the form \(f(x)=a x^{2}+b x+c\) if \(a \neq 0\). We call this kind of function a quadratic function.
Definition \(\PageIndex{1}\)
A quadratic function, where \(a, b\), and \(c\) are real numbers and \(a≠0\), is a function of the form
\(f(x)=a x^{2}+b x+c\)
We graphed the quadratic function \(f(x)=x^{2}\) by plotting points.
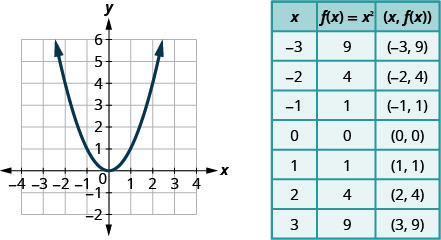
Every quadratic function has a graph that looks like this. We call this figure a parabola. Let’s practice graphing a parabola by plotting a few points.
Example \(\PageIndex{1}\)
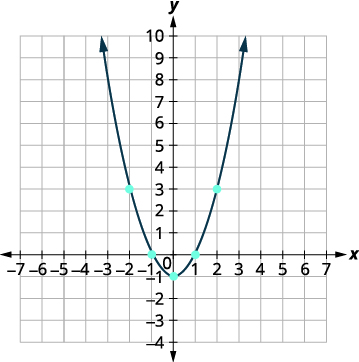
Graph: \(f(x)=x^{2}-1\).
Solution:
We will graph the function by plotting points.
|
Choose integer values for \(x\), |
 |
| Plot the points, and then connect them with a smooth curve. The result will be the graph of the function \(f(x)=x^{2}-1\). |
 |
Exercise \(\PageIndex{1}\)
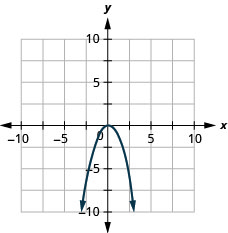
Graph \(f(x)=-x^{2}\).
- Answer
-
Exercise \(\PageIndex{2}\)
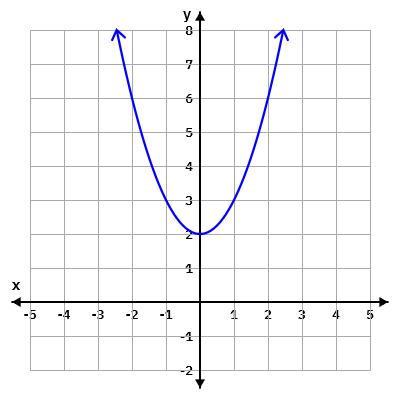
Graph \(f(x)=x^{2}+2\).
- Answer
-
All graphs of quadratic functions of the form \(f(x)=a x^{2}+b x+c\) are parabolas that open upward or downward.
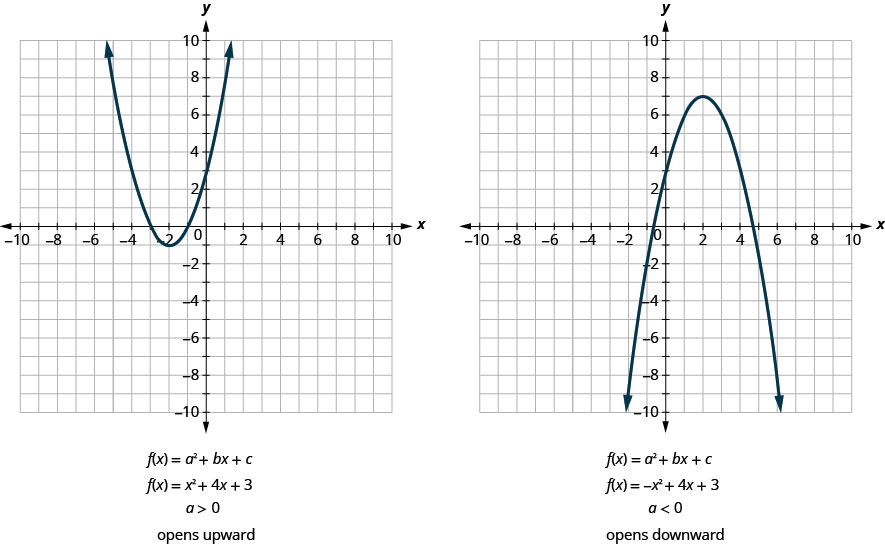
Notice that the only difference in the two equations is the negative sign in the quadratic term (\(ax^{2}\). When the quadratic term (\(ax^{2}\) is positive, the parabola opens upward. When the quadratic term (\(ax^{2}\) is negative, the parabola opens downward.
Definition \(\PageIndex{2}\)
Parabola Orientation
For the graph of the quadratic function \(f(x)=a x^{2}+b x+c\), if
Example \(\PageIndex{2}\)
Determine whether each parabola opens upward or downward:
- \(f(x)=-3 x^{2}+2 x-4\)
- \(f(x)=6 x^{2}+7 x-9\)
Solution:
a. Find the value of \(a\).
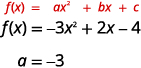
Since the \(a\) is negative, the parabola will open downward.
b. Find the value of \(a\).
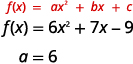
Since the \(a\) is positive, the parabola will open upward.
Exercise \(\PageIndex{3}\)
Determine whether the graph of each function is a parabola that opens upward or downward:
- \(f(x)=2 x^{2}+5 x-2\)
- \(f(x)=-3 x^{2}-4 x+7\)
- Answer
-
- up
- down
Exercise \(\PageIndex{4}\)
Determine whether the graph of each function is a parabola that opens upward or downward:
- \(f(x)=-2 x^{2}-2 x-3\)
- \(f(x)=5 x^{2}-2 x-1\)
- Answer
-
- down
- up
Finding the Axis of Symmetry, Vertex, Domain, and Range of a Parabola
Look again at Figure 9.6.10. Do you see that we could fold each parabola in half and then one side would lie on top of the other? The ‘fold line’ is a line of symmetry. We call it the axis of symmetry of the parabola.
We show the same two graphs again with the axis of symmetry.
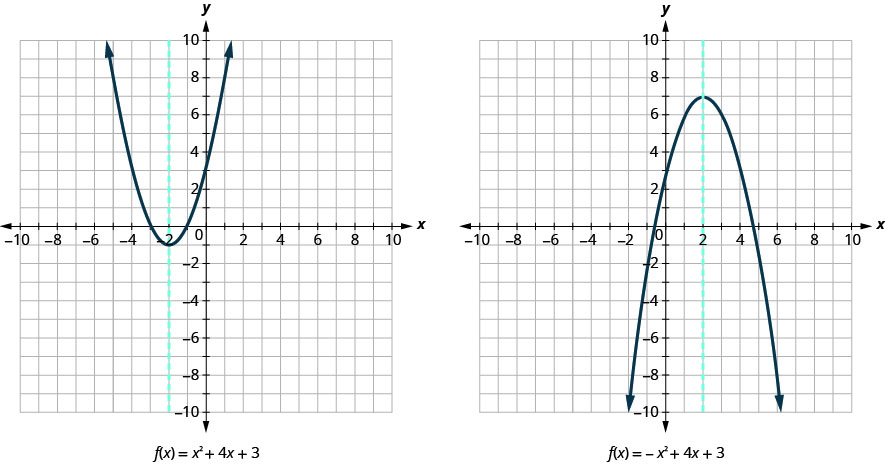
The equation of the axis of symmetry can be derived by using the Quadratic Formula. We will omit the derivation here and proceed directly to using the result. The equation of the axis of symmetry of the graph of \(f(x)=a x^{2}+b x+c\) is \(x=-\frac{b}{2 a}\).
So to find the equation of symmetry of each of the parabolas we graphed above, we will substitute into the formula \(x=-\frac{b}{2 a}\).
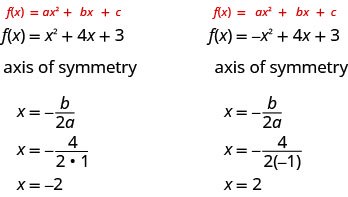
Notice that these are the equations of the dashed blue lines on the graphs.
The point on the parabola that is the lowest (parabola opens up), or the highest (parabola opens down), lies on the axis of symmetry. This point is called the vertex of the parabola.
We can easily find the coordinates of the vertex, because we know it is on the axis of symmetry. This means its
\(x\)-coordinate is \(-\frac{b}{2 a}\). To find the \(y\)-coordinate of the vertex we substitute the value of the \(x\)-coordinate into the quadratic function.

Axis of Symmetry and Vertex of a Parabola
The graph of the function \(f(x)=a x^{2}+b x+c\) is a parabola where:
- the axis of symmetry is the vertical line \(x=-\frac{b}{2 a}\).
- the vertex is a point on the axis of symmetry, so its \(x\)-coordinate is \(-\frac{b}{2 a}\)
- the \(y\)-coordinate of the vertex is found by substituting \(x=-\frac{b}{2 a}\) into the quadratic function.
Domain and Range of a Parabola
The graph of each parabola continues forever to the left and right. This means that the domain of any function in the form \(f(x)=a x^{2}+b x+c\) will be \((-\infty,\infty)\).
The range, however, will depend on the \(a\) value and the vertex. If \(a>0\), then the y-values will include the y-value of the vertex and everything higher. It will be expressed as \([f(-\frac{b}{2 a}),\infty)\). If \(a<0\), then the y-values will include everything lower than the maximum value, up to and including the maximum value. It will be expressed as \((-\infty,f(-\frac{b}{2 a})]\).
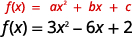
Example \(\PageIndex{3}\)
For the graph of \(f(x)=3 x^{2}-6 x+2\) find:
- the axis of symmetry
- the vertex
- the domain and range
Solution:
a.
 |
|
| The axis of symmetry is the vertical line \(x=-\frac{b}{2 a}\). | |
| Substitute the values \(a,b\) into the equation. | \(x=-\frac{-6}{2 \cdot 3}\) |
| Simplify. | \(x=1\) |
| The axis of symmetry is the line \(x=1\). |
b.
| \(f(x)=3 x^{2}-6 x+2\) | |
| The vertex is a point on the line of symmetry, so its \(x\)-coordinate will be \(x=1\). Find \(f(1)\). | 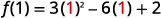 |
| Simplify. | 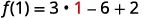 |
| The result is the \(y\)-coordinate. | \(f(1)=-1\) |
| The vertex is \((1,-1)\). |
c.
| \(f(x)=3 x^{2}-6 x+2\) | |
| The domain of any parabola in the form of \(f(x)=a x^{2}+b x+c\) always includes all real numbers: | \((-\infty,\infty)\) |
| The range depends on the \(a\) value and the vertex. | \(a=3\), so \(a\) is positive and the parabola opens upward. |
| The vertex is \((1,-1)\), so the parabola has a minimum y-value of \(-1\). | |
| The range is \([-1,\infty)\). |
Exercise \(\PageIndex{5}\)
For the graph of \(f(x)=-2 x^{2}+8 x+1\) find:
- the axis of symmetry
- the vertex
- the domain and range
- Answer
-
- \(x=2\)
- \((2,9)\)
- Domain: \((-\infty,\infty)\), Range: \((-\infty,9]\)
Exercise \(\PageIndex{6}\)
For the graph of \(f(x)=2 x^{2}-4 x-3\) find:
- the axis of symmetry
- the vertex
- the domain and range
- Answer
-
- \(x=1\)
- \((1,-5)\)
- Domain: \((-\infty,\infty)\), Range: \([-5,\infty)\)
Find the Intercepts of a Parabola
When we graphed linear equations, we often used the \(x\)- and \(y\)-intercepts to help us graph the lines. Finding the coordinates of the intercepts will help us to graph parabolas, too.
Remember, at the \(y\)-intercept the value of \(x\) is zero. So to find the \(y\)-intercept, we substitute \(x=0\) into the function.
Let’s find the \(y\)-intercepts of the two parabolas shown in Figure 9.6.20.

An \(x\)-intercept results when the value of \(f(x)\) is zero. To find an \(x\)-intercept, we let \(f(x)=0\). In other words, we will need to solve the equation \(0=a x^{2}+b x+c\) for \(x\).
\(\begin{aligned} f(x) &=a x^{2}+b x+c \\ 0 &=a x^{2}+b x+c \end{aligned}\)
While several methods exist to solve quadratic equations like this, we will rely on the quadratic formula for the purposes of this course.
Definition \(\PageIndex{3}\)
The quadratic formula states that if \(ax^{2}+bx+c=0\) and \(a \ne 0\),
then \(x=\frac{-b \pm \sqrt{b^{2}-4 a c}}{2 a}\), provided that \(b^{2}-4ac \ge 0\)
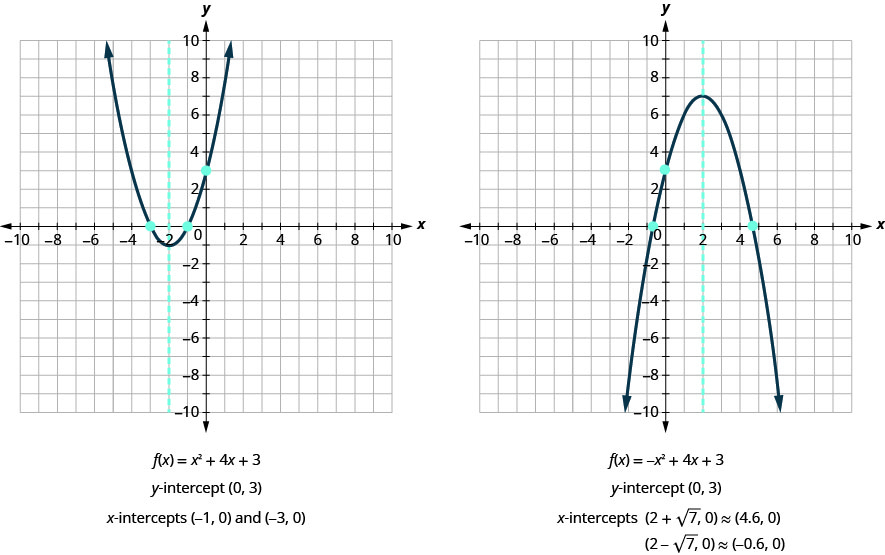
We can now find the \(x\)-intercepts of the two parabolas we looked at. First we will find the \(x\)-intercepts of the parabola whose function is \(f(x)=x^{2}+4 x+3\).
| \(f(x)=x^{2}+4 x+3\) | |
| Let \(f(x)=0\). | \(\color{red}0\color{black}=x^{2}+4 x+3\) |
| Use the Quadratic Formula to solve for \(x\). | \(x=\frac{-b \pm \sqrt{b^{2}-4 a c}}{2 a}\) |
| \(a=1, b=4, c=3\) | \(x=\frac{-4 \pm \sqrt{4^{2}-4(1)(3)}}{2(1)}\) |
| Simplify. | \(x=\frac{-4 \pm \sqrt{4}}{2}\) |
| \(x=\frac{-4 \pm 2 }{2}\) | |
| \(x=-2 \pm 1\) | |
| \(x=-1 and x=-3\) | |
| The \(x\)-intercepts are \((-1,0)\) and \((-3,0)\). |
Now we will find the \(x\)-intercepts of the parabola whose function is \(f(x)=-x^{2}+4 x+3\).
| \(f(x)=-x^{2}+4 x+3\) | |
| Let \(f(x)=0\). | \(\color{red}0 \color{black}=-x^{2}+4 x+3\) |
| Use the Quadratic Formula to solve for \(x\). | \(x=\frac{-b \pm \sqrt{b^{2}-4 a c}}{2 a}\) |
| \(a=-1, b=4, c=3\) | \(x=\frac{-4 \pm \sqrt{4^{2}-4(-1)(3)}}{2(-1)}\) |
| Simplify. | \(x=\frac{-4 \pm \sqrt{28}}{-2}\) |
| \(x=\frac{-4 \pm 2 \sqrt{7}}{-2}\) | |
| \(x=\frac{-2(2 \pm \sqrt{7})}{-2}\) | |
| \(x=2 \pm \sqrt{7}\) | |
| The \(x\)-intercepts are \((2+\sqrt{7}, 0)\) and \((2-\sqrt{7}, 0)\). |
We will use the decimal approximations of the \(x\)-intercepts, so that we can locate these points on the graph,
\((2+\sqrt{7}, 0) \approx(4.6,0) \quad(2-\sqrt{7}, 0) \approx(-0.6,0)\)
Do these results agree with our graphs? See Figure 9.6.34
Find the Intercepts of a Parabola
To find the intercepts of a parabola whose function is \(f(x)=a x^{2}+b x+c\):
\(y\)-intercept
Let \(x=0\) and solve for \(f(x)\).
\(x\)-intercepts
Let \(f(x)=0\) and solve for \(x\)
Example \(\PageIndex{4}\)
Find the intercepts of the parabola whose function is \(f(x)=x^{2}-2 x-8\).
Solution:
| To find the \(y\)-intercept, let \(x=0\) and solve for \(f(x)\). | \(f(x)=x^{2}-2 x-8\) |
| \(f(0)=\color{red}0\color{black}^{2}-2 \cdot \color{red}0 \color{black}-8\) | |
| \(f(0)=-8\) | |
| When \(x=0\), then \(f(0)=-8\). The \(y\)-intercept is the point \((0,-8)\). | |
| To find the \(x\)-intercept, let \(f(x)=0\) and solve for \(x\). | \(f(x)=x^{2}-2 x-8\) |
| \(0=x^{2}-2 x-8\) | |
| Use the Quadratic Formula to solve for \(x\). | \(x=\frac{-b \pm \sqrt{b^{2}-4 a c}}{2 a}\) |
| \(a=1, b=-2, c=-8\) | \(x=\frac{2 \pm \sqrt{(-2)^{2}-4(1)(-8)}}{2(1)}\) |
| Simplify. | \(x=\frac{2 \pm \sqrt{36}}{2}\) |
| \(x=\frac{2 \pm 6}{2}\) | |
| \(x=1 \pm 3\) | |
| \(x=4\) or \(x=-2\) | |
| When \(f(x)=0\), then \(x=4\) or \(x=-2\). The \(x\)-intercepts are the points \((4,0)\) and \((-2,0)\). |
Exercise \(\PageIndex{7}\)
Find the intercepts of the parabola whose function is \(f(x)=x^{2}+2 x-8\).
- Answer
-
\(y\) -intercept: \((0,-8) x\) -intercepts \((-4,0),(2,0)\)
Exercise \(\PageIndex{8}\)
Find the intercepts of the parabola whose function is \(f(x)=x^{2}-4 x-12\).
- Answer
-
\(y\) -intercept: \((0,-12) x\) -intercepts \((-2,0),(6,0)\)
Graph Quadratic Functions Using Properties
Now we have all the pieces we need in order to graph a quadratic function. We just need to put them together.
To Graph a Quadratic Function Using Properties
- Determine whether the parabola opens upward or downward.
- Find the equation of the axis of symmetry.
- Find the vertex.
- Find the \(y\)-intercept.
- Find the point symmetric to the \(y\)-intercept across the axis of symmetry.
- Find the \(x\)-intercepts.
- Find additional points if needed.
- Graph the parabola.
Example \(\PageIndex{6}\) How to Graph a Quadratic Function Using Properties
Graph \(f(x)=x^{2}-6x+8\) by using its properties.
Solution:
| Step 1: Determine whether the parabola opens upward or downward. |
Look \(a\) in the equation \(f(x)=x^{2}-6x+8\) Since \(a\) is positive, the parabola opens upward. |
\(f(x)=x^{2}-6x+8\) \(\color{red}{a=1, b=-6, c=8}\) The parabola opens upward. |
| Step 2: Find the axis of symmetry. |
\(f(x)=x^{2}-6x+8\) The axis of symmetry is the line \(x=-\frac{b}{2 a}\). |
Axis of Symmetry \(x=-\frac{b}{2 a}\) \(x=-\frac{(-6)}{2 \cdot 1}\) \(x=3\) The axis of symmetry is the line \(x=3\). |
| Step 3: Find the vertex. | The vertex is on the axis of symmetry. Substitute \(x=3\) into the function. |
Vertex \(f(x)=x^{2}-6x+8\) \(f(3)=(\color{red}{3}\color{black}{)}^{2}-6(\color{red}{3}\color{black}{)}+8\) \(f(3)=-1\) The vertex is \((3,-1)\). |
| Step 4: Find the \(y\)-intercept. |
We find \(f(0)\).
|
\(y\)-intercept \(f(x)=x^{2}-6 x+8\) \(f(0)=(\color{red}{0}\color{black}{)}^{2}-6(\color{red}{0}\color{black}{)}+8\) \(f(0)=8\) The \(y\)-intercept is \((0,8)\). |
| Step 5: Find the point symmetric to the \(y\)-intercept across the axis of symmetry. |
We use the axis of symmetry to find a point symmetric to the \(y\)-intercept. The \(y\)-intercept is \(3\) units left of the axis of symmetry, \(x=3\). A point \(3\) units to the right of the axis of symmetry has \(x=6\). |
The \(y\)-intercept is \((0,8)\). Point symmetric to \(y\)-intercept: The point is \((6,8)\). |
| Step 6: Find the \(x\)-intercepts. |
We solve \(f(x)=0\). We can solve this quadratic equation by using the quadratic formula. |
\(x\)-intercepts \(f(x)=x^{2}-6 x+8\) \(\color{red}{0}\color{black}{=}x^{2}-6x+8\) \(x=\frac{6 \pm \sqrt{(-6)^{2}-4(1)(8)}}{2(1)}\) \(x=\frac{6 \pm 2}{2}\) \(x=2\) or \(x=4\) The \(x\)-intercepts are \((2,0)\) and \((4,0)\). |
| Step 8: No additional points are necessary, so we now graph the parabola. | We graph the vertex, intercepts, and the point symmetric to the \(y\)-intercept. We connect these \(5\) points to sketch the parabola. | .png?revision=1) |
Exercise \(\PageIndex{11}\)
Graph \(f(x)=x^{2}+2x-8\) by using its properties.
- Answer
-
Exercise \(\PageIndex{12}\)
Graph \(f(x)=x^{2}-8x+12\) by using its properties.
- Answer
-

Exercise \(\PageIndex{13}\)
Graph \(f(x)=-3 x^{2}-6 x+5\) by using its properties.
- Answer
-
Solve Maximum and Minimum Applications
Knowing that the vertex of a parabola is the lowest or highest point of the parabola gives us an easy way to determine the minimum or maximum value of a quadratic function. The y-coordinate of the vertex is the minimum value of a parabola that opens upward. It is the maximum value of a parabola that opens downward. See Figure 9.6.124.
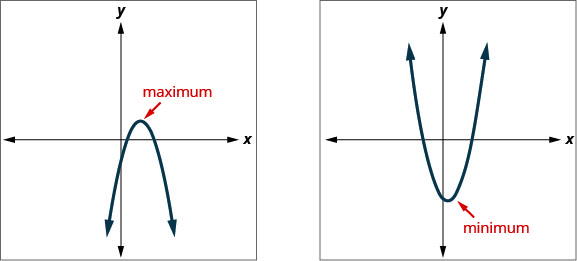
Minimum or Maximum Values of a Quadratic Function
The y-coordinate of the vertex of the graph of a quadratic function is the
- minimum value of the quadratic equation if the parabola opens upward.
- maximum value of the quadratic equation if the parabola opens downward.
Example \(\PageIndex{10}\)
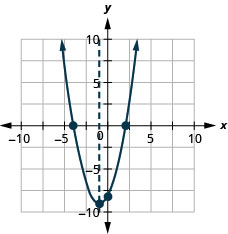
Find the minimum or maximum value of the quadratic function \(f(x)=x^{2}+2 x-8\).
Solution:
| \(f(x)=x^{2}+2 x-8\) | |
| Since \(a\) is positive, the parabola opens upward. The quadratic equation has a minimum. | |
| Find the equation of the axis of symmetry. | \(x=-\frac{b}{2 a}\) |
| \(x=-\frac{2}{2 \times 1}\) | |
| \(x=-1\) | |
| The equation of the axis of symmetry is \(x=-1\). | |
| The vertex is on the line \(x=-1\). | \(f(x)=x^{2}+2 x-8\) |
| Find \(f(-1)\). |  |
| \(f(-1)=1-2-8\) | |
| \(f(-1)=-9\) | |
| The vertex is \((-1,-9)\). | |
| Since the parabola has a minimum, the \(y\)-coordinate of the vertex is the minimum \(y\)-value of the quadratic equation. The minimum value of the quadratic is \(-9\) and it occurs when \(x=-1\). | |
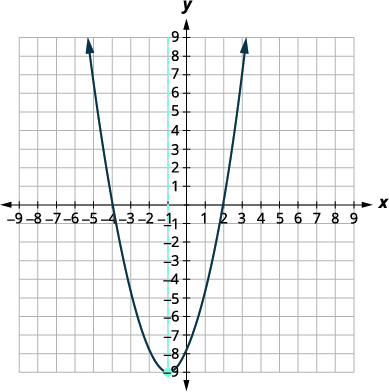 |
Show the graph to verify the result.
Exercise \(\PageIndex{14}\)
Find the maximum or minimum value of the quadratic function \(f(x)=x^{2}-8 x+12\).
- Answer
-
The minimum value of the quadratic function is \(−4\) and it occurs when \(x=4\).
Exercise \(\PageIndex{15}\)
Find the maximum or minimum value of the quadratic function \(f(x)=-4 x^{2}+16 x-11\).
- Answer
-
The maximum value of the quadratic function is \(5\) and it occurs when \(x=2\).
The maximum or minimum values have many business applications. For example, businesses may want to find their maximum profit or minimum cost.
Example \(\PageIndex{11}\)
A company that sells televisions has found their revenue to be determined by \(R(t)=-50t^{2}+2000t\), where \(t\) is the number of televisions sold.
- Find the value of \(t\) that will produce the maximum revenue.
- What is the maximum revenue?
Solution:
\(R(t)=-50t^{2}+2000t\)
a. Find the equation of the axis of symmetry.
\(\begin{array}{l}{t=-\frac{b}{2 a}} \\ {t=-\frac{2000}{2(-50)}} \\ {t=20}\end{array}\)
The equation of the axis of symmetry is \(t=20\).
The vertex is on the line \(t=20\).
The maximum occurs when \(t=20\) televisions.
b. To find the maximum revenue, find \(R(20)\).
\(\begin{array}{l}{R(t)=-50 t^{2}+2000 t} \\ {R(t)=-50(20)^{2}+2000(20)}\end{array}\)
Use a calculator to simplify.
\(R(t)=20000\)
The vertex is \((20, 20000)\).
When the company sells \(20\) televisions, they will have a revenue of $\(20,000\)
Exercise \(\PageIndex{16}\)
A bakery has found their profit to be determined by \(P(c)=-2c^{2}+304c-11307\), where \(c\) is the number of cupcakes baked each day.
- Find the value of \(c\) that will produce the maximum profit.
- What is the maximum profit?
- Answer
-
The bakery will earn a maximum profit of $\(245\) if \(76\) cupcakes are baked each day.
Finding the Break-Even Points
Intercepts also have many business applications. Remember that an x-intercept is the value of x when the function equals zero. The point at which revenue and cost are equal is known as the break-even point. This is also where the profit equals zero.
Example \(\PageIndex{12}\)
The television company from example 11 has found their profit to be determined by \(P(t)=-50t^{2}+1500t-4000\), where \(t\) is the number of televisions sold.
- Find the break-even points, rounding to the nearest whole number if necessary.
- What range of television sales will result in a profit? A loss?
Solution:
\(P(t)=-50t^{2}+1500t-4000\)
a. The break-even points exist when the profit is $\(0\). On the parabola, this exists when y is zero, or at the x-intercepts. Substitute \(0\) in for \(P(t)\).
\(P(t)=-50t^{2}+1500t-4000\)
\(0=-50t^{2}+1500t-4000\)
Use the quadratic formula to solve for \(t\).
\(t=\frac{-b \pm \sqrt{b^{2}-4 a c}}{2 a}\)
\(t=\frac{-1500 \pm \sqrt{(1500)^{2}-4 (-50)(-4000)}}{2 (-50)}\)
\(t=\frac{-1500 \pm \sqrt{1450000}}{-100}\)
\(t \approx \frac{-1500 \pm 1204.2}{-100}\)
\(t \approx \frac{-295.8}{-100}\) or \(t \approx \frac{-2704.2}{-100}\)
\(t \approx 2.958\) or \(t \approx 27.042\)
The x-intercepts of the parabola are approximately \((0, 3)\) and \((0, 27)\).
The company will break even, or make a profit of $\(0\), when either \(3\) or \(27\) televisions are sold.
b. Since the \(a\) value of the function is negative, the parabola will open downward. This means that the profit will be positive between the two x-intercepts and will be negative outside of the x-intercepts.
The company will make a profit by selling more than \(3\) and less than \(27\) televisions.
The company will lose money by selling less than than \(3\) or more than \(27\) televisions.
Exercise \(\PageIndex{17}\)
The bakery from exercise 16 has found their profit to be determined by \(P(c)=-2c^{2}+304c-11307\), where \(c\) is the number of cupcakes baked each day.
- Find the break-even points, rounding to the nearest whole number if necessary.
- What range of cupcake production will result in a profit? A loss?
- Answer
-
- The break-even points occur if the bakery makes \(65\) or \(87\) cupcakes each day.
- The bakery will earn a profit if it bakes more than \(65\) and less than \(87\) cupcakes each day; it will lose money if it bakes less than \(65\) or more than \(87\) cupcakes each day.
Key Concepts
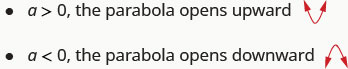
- Parabola Orientation
- For the graph of the quadratic function \(f(x)=a x^{2}+b x+c\), if
- \(a>0\), the parabola opens upward.
- \(a<0\), the parabola opens downward.
- For the graph of the quadratic function \(f(x)=a x^{2}+b x+c\), if
- Axis of Symmetry and Vertex of a Parabola The graph of the function \(f(x)=a x^{2}+b x+c\) is a parabola where:
- the axis of symmetry is the vertical line \(x=-\frac{b}{2 a}\).
- the vertex is a point on the axis of symmetry, so its \(x\)-coordinate is \(-\frac{b}{2 a}\).
- the \(y\)-coordinate of the vertex is found by substituting \(x=-\frac{b}{2 a}\) into the quadratic equation.
- Find the Intercepts of a Parabola
- To find the intercepts of a parabola whose function is \(f(x)=a x^{2}+b x+c\):
- \(y\)-intercept
- Let \(x=0\) and solve for \(f(x)\).
- \(x\)-intercepts
- Let \(f(x)=0\) and solve for \(x\).
- \(y\)-intercept
- To find the intercepts of a parabola whose function is \(f(x)=a x^{2}+b x+c\):
- How to graph a quadratic function using properties.
- Determine whether the parabola opens upward or downward.
- Find the equation of the axis of symmetry.
- Find the vertex.
- Find the \(y\)-intercept. Find the point symmetric to the y-intercept across the axis of symmetry.
- Find the \(x\)-intercepts. Find additional points if needed.
- Graph the parabola.
- Minimum or Maximum Values of a Quadratic Equation
- The \(y\)-coordinate of the vertex of the graph of a quadratic equation is the
- minimum value of the quadratic equation if the parabola opens upward.
- maximum value of the quadratic equation if the parabola opens downward.
Glossary
- quadratic function
- A quadratic function, where \(a, b\), and \(c\) are real numbers and \(a≠0\), is a function of the form \(f(x)=ax^{2}+bx+c\).