
2.2: Functions and Simple Graphs
- Page ID
- 36839

A large part of science may be described as the study of the dependence of one measured quantity on another measured quantity. The word function is used in this context in a special way. In previous examples, the word function may have been used as follows:
- The density of V. natriegens is a function of time.
- Light intensity is a function of depth below the surface in an ocean.
- Light intensity is a function of distance from the light source.
- The frequency of cricket chirps is a function of the ambient temperature.
- The percentage of females turtles from a clutch of eggs is a function of the incubation temperature.
2.2.1 Three definitions of “Function”.
Because of its prevalence and importance in science and mathematics, the word function has been defined several ways over the past three hundred years, and now is usually given a very precise formal meaning. More intuitive meanings are also helpful and we give three definitions of function, all of which will be useful to us.
The word variable means a symbol that represents any member of a given set, most often a set of numbers, and usually denotes a value of a measured quantity. Thus density of V. natriegens, time, percentage of females, incubation temperature, light intensity, depth and distance are all variables.
The terms dependent variable and independent variable are useful in the description of an experiment and the resulting functional relationship. The density of V. natriegens (dependent variable) is a function of time (independent variable). The percentage of females turtles from a clutch of eggs (dependent variable) is a function of the incubation temperature (independent variable).
Using the notion of variable, a function may be defined:
Definition 2.2.1 Function I Given two variables, x and y, a function is a rule that assigns to each value of x a unique value of y.
In this context, x is the independent variable, and y is the dependent variable. In some cases there is an equation that nicely describes the ‘rule’; in the percentage of females in a clutch of turtle eggs examples of the preceding section, there was not a simple equation that described the rule, but the rule met the definition of function, nevertheless.
The use of the words dependent and independent in describing variables may change with the context of the experiment and resulting function. For example, the data on the incubation of turtles implicitly assumed that the temperature was held constant during incubation. For turtles in the wild, however, temperature is not held constant and one might measure the temperature of a clutch of eggs as a function of time. Then, temperature becomes the dependent variable and time is the independent variable.
In Definition 2.2.1, the word ‘variable’ is a bit vague, and ‘a function is a rule’ leaves a question as to ‘What is a rule?’. A ‘set of objects’ or, equivalently, a ‘collection of objects’, is considered to be easier to understand than ‘variable’ and has broader concurrence as to its meaning. Your previous experience with the word function may have been that
Definition 2.2.2 Function II A function is a rule that assigns to each number in a set called the domain a unique number in a set called the range of the function.
Definition 2.2.2 is similar to Definition 2.2.1, except that ‘a number in a set called the domain’ has given meaning to independent variable and ‘a unique number in a set called the range’ has given meaning to dependent variable.
The word ‘rule’ is at the core of both definitions 2.2.1 Function I. and 2.2.2 Function II. and is still a bit vague. The definition of function currently considered to be the most concise is:
Definition 2.2.3 Function III A function is a collection of ordered number pairs no two of which have the same first number.
A little reflection will reveal that ‘a table of data’ is the motivation for Definition 2.2.3. A data point is actually a number pair. Consider the tables of data shown in Table 2.1 from V. natriegens growth and human population records. (16,0.036) is a data point. (64,0.169) is a data point. (1950,2.52) and ( 1980,4.45) are data points. These are basic bits of information for the functions. On the other hand, examine the data for cricket chirps in the same table, from Chapter 1. That also is a collection of ordered pairs, but the collection does not satisfy Definition 2.2.3. There are two ordered pairs in the table with the same first term – (66,102) and (66,103). Therefore the collection contains important information about the dependence of chirp frequency on temperature, although the collection does not constitute a function.
| V. natriegens Growth pH 6.25 | |
|---|---|
| Time (min) | Population Density |
| 0 | 0.022 |
| 16 | 0.036 |
| 32 | 0.060 |
| 48 | 0.101 |
| 64 | 0.169 |
| 80 | 0.266 |
| World Population | |
|---|---|
| Year | Population (billions) |
| 1940 | 2.30 |
| 1950 | 2.52 |
| 1960 | 3.02 |
| 1970 | 3.70 |
| 1980 | 4.45 |
| 1990 | 5.30 |
| 2000 | 6.06 |
| Cricket Chirps | |
|---|---|
| Temperature (\(^{\circ} F\)) | Chirps per Minute |
| 67 | 109 |
| 73 | 136 |
| 78 | 160 |
| 61 | 87 |
| 66 | 103 |
| 66 | 102 |
| 67 | 108 |
| 77 | 154 |
| 74 | 144 |
| 76 | 150 |
In a function that is a collection of ordered number pairs, the first number of a number pair is always a value of the independent variable and a member of the domain and the second number is always a value of the dependent variable and a member of the range. Almost always in recording the results of an experiment, the numbers in the domain are listed in the column on the left and the numbers in the range are listed in the column on the right. Formally,
Definition 2.2.4 Domain and Range For Definition 2.2.3 of function, the domain is defined as the set of all numbers that occur as the first number in an ordered pair of the function and the range of the function is the set of all numbers that occur as a second number in an ordered pair of the function.
Example 2.2.1 Data for the percentage of U.S. population in 1955 that had antibodies to the polio virus as a function of age is shown in Table 2.2.1.1. The data show an interesting fact that a high percentage of the population in 1955 had been infected with polio. A much smaller percentage were crippled or killed by the disease.
Although Table 2.2.1.1 is a function, it is only an approximation to a perhaps real underlying function. The order pair, (17.5, 72), signals that 72 percent of the people of age 17.5 years had antibodies to the polio virus. More accurately, (17.5,72) signals that of a sample of people who had ages in the interval from age 15 to less than 20, the percentage who tested positive to antibodies to the polio virus was greater than or equal to 71.5 and less than 72.5.
Table 2.2.1.1 is a useful representation of an enormous table of data that lists for a certain instance of time during 1955, for each U.S. citizen, their age (measured perhaps in hours (minutes?, seconds?)), and whether they had HIV antibodies, ’yes’ or ’no,’ This table would not be a function, but for each age, the percent of people of that age who were HIV positive would be a number and those age-percent pairs would form a function. The domain of that function would be the finite set of ages in the U.S. population.
| Age | 0.8 | 1.5 | 2.5 | 3.5 | 4.5 | 5.5 | 6.5 | 7.5 | 8.5 | 9.5 | 12.5 | 17.5 | 22.5 | 27.5 |
|---|---|---|---|---|---|---|---|---|---|---|---|---|---|---|
| % | 3 | 6 | 13 | 19 | 27 | 35 | 40 | 43 | 46 | 49 | 64 | 72 | 78 | 87 |
Remember that only a very few data ‘points’ were listed from the large number of possible points in each of the experiments we considered. There is a larger function in the background of each experiment.
Because many biological quantities change with time, the domain of a function of interest is often an interval of time. In some cases a biological reaction depends on temperature (percentage of females in a clutch of turtle eggs for example) so that the domain of a function may be an interval of temperatures. In cases of spatial distribution of a disease or light intensity below the surface of a lake, the domain may be an interval of distances.
It is implicit in the bacteria growth data that at any specific time, there is only one value of the bacterial density2 associated with that time. It may be incorrectly or inaccurately read, but a fundamental assumption is that there is only one correct density for that specific time. The condition that no two of the ordered number pairs have the same first term is a way of saying that each number in the domain has a unique number in the range associated with it.
All three of the definitions of function are helpful, as are brief verbal descriptions, and we will rely on all of them. Our basic definition, however, is the ordered pair definition, Definition 2.2.3.
2.2.2 Simple graphs.
Coordinate geometry associates ordered number pairs with points of the plane so that by Definition 2.2.3 a function is automatically identified with a point set in the plane called a simple graph:
Definition 2.2.5 Simple Graph
A simple graph is a point set, G, in the plane such that no vertical line contains two points of G.
The domain of G is the set of x-coordinates of points of G and the range of G is the set of all y-coordinates of points of G.
Note: For use in this book, every set contains at least one element.
The domain of a simple graph G is sometimes called the x-projection of G, meaning the vertical projection of G onto the x-axis and the range of G is sometimes called the y-projection of G meaning the horizontal projection of G onto the y-axis.
A review of the graphs of incubation temperature - percentage of females turtles in Figure 2.1.1 and Exercise Fig. 2.1.1 will show that in each graph at least one vertical line contains two points of the graph. Neither of these graphs is a simple graph, but the graphs convey useful information.
A circle is not a simple graph. As shown in Figure 2.2.1A there is a vertical line that contains two points of it. There are a lot of such vertical lines. The circle does contain a simple graph, and contains one that is ‘as large as possible’. The upper semicircle shown in Figure 2.2.1B is a simple graph. The points (-1,0) and (1,0) are filled to show that they belong to it. It is impossible to add any other points of the circle to this simple graph and still have a simple graph — thus it is ‘as large as possible’. An equation of the upper semicircle is
\[y=\sqrt{1-x^{2}}, \quad-1 \leq x \leq 1\]
The domain of this simple graph is [-1,1], and the range is [0,1]. Obviously the lower semicircle is a maximal simple graph also, and it has the equation
\[y=-\sqrt{1-x^{2}}, \quad-1 \leq x \leq 1\]
The domain is again [-1,1], and the range is [-1,0].
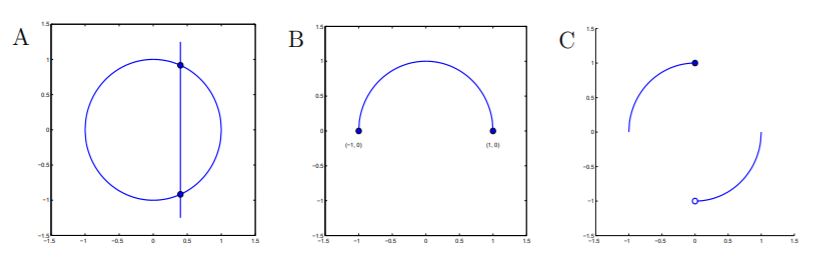
Figure \(\PageIndex{1}\): A. A circle; a vertical line contains two point of the circle so that it is not a simple graph. B. A subset of the circle that is a simple graph. C. Another subset of the circle that is a simple graph. The simple graphs in (b) and (c) are maximal in the sense that any point from the circle added to the graphs would create a set that is not a simple graph — the vertical line containing that point would also contain a point from the original simple graph.
There is yet a third simple graph contained in the circle, shown in Figure 2.2.1C, and it is ‘as large as possible’. An equation for that simple graph is
\[y=\left\{\begin{aligned}
\sqrt{1-x^{2}} & \text { if } &-1 \leq x \leq 0 \\
-\sqrt{1-x^{2}} & \text { if } & 0<x \leq 1
\end{aligned}\right.\]
The domain is [-1,1] and range is [-1,1] Because of the intuitive advantage of geometry, it is often useful to use simple graphs instead of equations or tables to describe functions, but again, we will use any of these as needed.
Exercises for Section 2.2 Functions and Simple Graphs.
Exercise 2.2.1 Which of the tables shown in Table Ex. 2.2.1 reported as data describing the growth of V. natriegens are functions?
| Time | Abs | Time | Abs | Time | Abs |
|---|---|---|---|---|---|
| 0 | 0.018 | 0 | 0.018 | 0 | 0.018 |
| 12 | 0.023 | 12 | 0.023 | 12 | 0.023 |
| 24 | 0.030 | 24 | 0.030 | 24 | 0.030 |
| 36 | 0.039 | 36 | 0.039 | 48 | 0.049 |
| 48 | 0.049 | 48 | 0.049 | 48 | 0.049 |
| 48 | 0.065 | 60 | 0.065 | 48 | 0.049 |
| 60 | 0.085 | 72 | 0.065 | 72 | 0.065 |
| 78 | 0.120 | 87 | 0.065 | 87 | 0.065 |
| 96 | 0.145 | 96 | 0.080 | 96 | 0.080 |
| 110 | 0.195 | 110 | 0.095 | 110 | 0.095 |
| 120 | 0.240 | 120 | 0.120 | 120 | 0.120 |
Exercise 2.2.2 For the following experiments, determine the independent variable and the dependent variable, and draw a simple graph or give a brief verbal description (your best guess) of the function relating the two.
- A rabbit population size is a function of the number of coyotes in the region.
- An agronomist, interested in the most economical rate of nitrogen application to corn, measures the corn yield in test plots using eight different levels of nitrogen application.
- An enzyme, E, catalyzes a reaction converting a substrate, S, to a product P according to \[\mathrm{E}+\mathrm{S} \rightleftharpoons \mathrm{ES} \rightleftharpoons \mathrm{E}+\mathrm{P}\] Assume enzyme concentration, [E], is fixed. A scientist measures the rate at which the product P accumulates at different concentrations, [S], of substrate.
- A scientist titrates a 0.1 M solution of HCl into 5 ml of an unknown basic solution containing litmus (litmus causes the color of the solution to change as the pH changes).
Exercise 2.2.3 A table for bacterial density for growth of V. natriegens is repeated in Exercise Table 2.2.3. There are two functions that relate population density to time in this table, one that relates population density to time and another that relates population to time index.
- Identify an ordered pair that belongs to both functions.
- One of the functions is implicitly only a partial list of the order pairs that belong to it. You may be of the opinion that both functions have that property, but some people may think one is more obviously only a sample of the data. Which one?
- What is the domain of the other function?
| pH 6.25 | ||
|---|---|---|
| Time (min) | Time Index \(t\) | Population Density \(B_t\) |
| 0 | 0 | 0.022 |
| 16 | 1 | 0.036 |
| 32 | 2 | 0.060 |
| 48 | 3 | 0.101 |
| 64 | 4 | 0.169 |
| 80 | 5 | 0.266 |
Exercise 2.2.4 Refer to the graphs in Figure Ex. 2.2.4.
- Which of the graphs are simple graphs?
- For those that are not simple graphs,
- Draw, using only the points of the graph, a simple graph that is ‘as large as possible’, meaning that no other points can be added and still have a simple graph.
- Draw a second such simple graph.
- Identify the domains and ranges of the two simple graphs you have drawn.
- How many such simple graphs may be drawn?
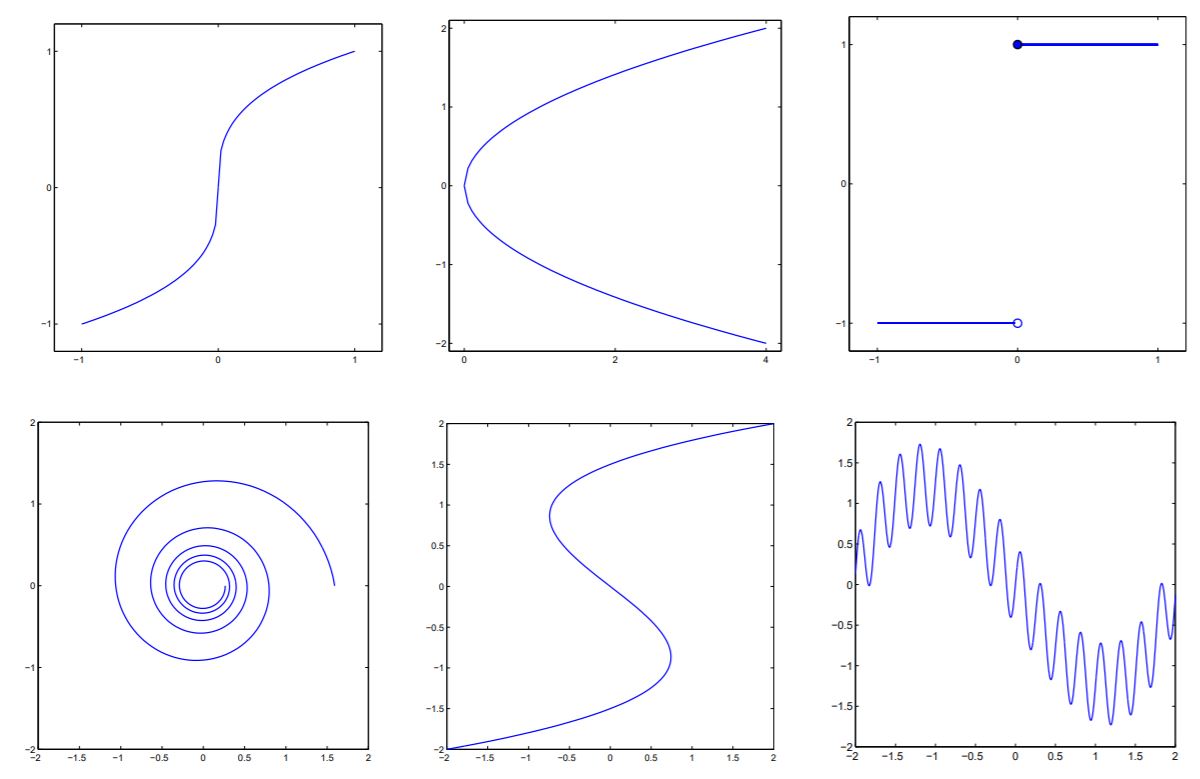
Figure for Exercise 2.2.4 Graphs for Exercise 2.2.4. Some are simple graphs; some are not simple graphs.
Exercise 2.2.5 Make a table showing the ordered pairs of a simple graph contained in the graph in Figure Ex. 2.2.5 and that has domain
\[\{-1.5,-1.0,-0.5,0.0,0.5,1.0,1.5\}\]
How many such simple graphs are contained in the graph of Figure Ex. 2.2.5 and that have this domain?
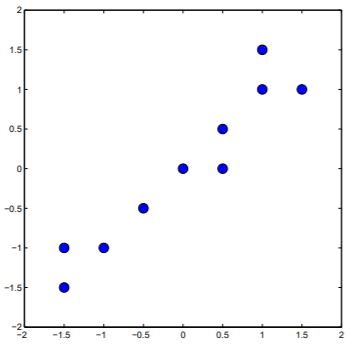
Figure for Exercise 2.2.5 Graph for Exercise 2.2.5.
Exercise 2.2.6
- Does every subset of the plane contain a simple graph?
- Does every subset of the plane contain two simple graphs?
- Is there a subset of the plane that contains two and only two simple graphs?
- Is there a line in the plane that is not the graph of a function?
- Is there a function whose graph is a circle?
- Is there a simple graph in the plane whose domain is the interval [0,1] (including 0 and 1) and whose range is the interval [0,3]?
- Is there a simple graph in the plane whose domain is [0,1] and whose range is the y-axis?
Exercise 2.2.7 A bit of a difficult exercise. For any location, \(\lambda\) on Earth, let Annual Daytime at \(\lambda\) , \(AD(\lambda)\), be the sum of the lengths of time between sunrise and sunset at \(\lambda\) for all of the days of the year. Find a reasonable formula for \(AD(\lambda)\). You may guess or find data to suggest a reasonable formula, but we found proof of the validity of our formula a bit arduous. As often happens in mathematics, instead of solving the actual problem posed, we found it best to solve a ’nearby’ problem that was more tractable. The 365.24... days in a year is a distraction, the elliptical orbit of Earth is a downright hinderance, and the wobble of Earth on its axis can be overlooked. Specifically, we find it helpful to assume that there are precisely 366 days in the year (after all this was true about 7 or 8 million years ago), the Earth’s orbit about the sun is a circle, the Earth’s axis makes a constant angle with the plane of the orbit, and that the rays from the sun to Earth are parallel. We hope you enjoy the question.
2.2.3 Functions in other settings.
There are extensions of the function concept to settings where the ordered pairs are not ordered number pairs. A prime example of this is the genetic code shown in Figure 2.3. The relation is a true function (no two ordered pairs have the same first term), and during the translation of proteins, the ribosome and the transfer RNA’s use this function reliably.
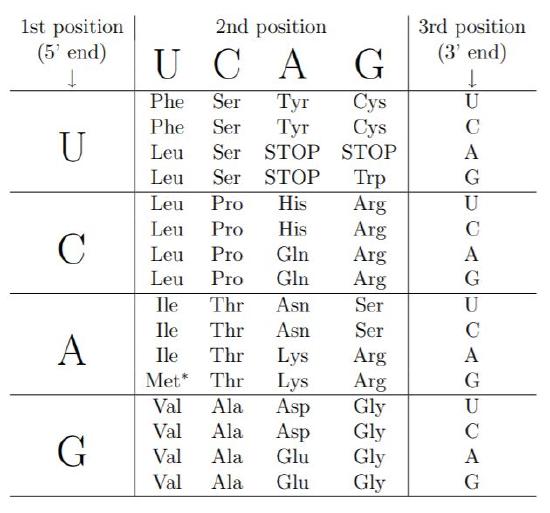
Figure \(\PageIndex{2}\): The genetic code (for human nuclear RNA). Sets of three nucleotides in RNA (codons) are translated into amino acids in the course of proteins synthesis. CAA codes for Gln (glutamine). ∗AUG codes for Met (methionine) and is also the START codon.
Explore 2.2.1 List three ordered pairs of the genetic code. What is the domain of the genetic code? What is the range of the genetic code?
The ordered pair concept is retained in the preceding example; the only change has been in the types of objects that are in the domain and range. When the objects get too far afield from simple numbers, the word transformation is sometimes used in place of function. The genetic code is a transformation of the codons into amino acids and start and stop signals.
Another commonly encountered extension of the kinds of objects in the domain of a function occurs when one physical or biological quantity is dependent on two others. For example, the widely known Charles’ Law in Chemistry can be stated as
\[P=\frac{n R T}{V}\]
where \(P\) = pressure in atmospheres, n = number of molecular weights of the gas, \(R\) = 0.0820 Atmospheres/degree Kelvin-mol = 8.3 /degree Kelvin-mol (the gas constant), \(T\) = temperature in kelvins, and \(V\) = volume in liters. For a fixed sample of gas, the pressure is dependent on two quantities, temperature and volume. The domain is the set of all feasible temperature-volume pairs, the range is the set of all feasible pressures. The function in this case is said to be a function of two variables. The ordered pairs in the function are of the form
\[((x, y), z), \quad \text{or} \quad(\text { (temperature, volume) }, \text { pressure })\]
There may also be multivalued transformations. For example, doctors prescribe antibiotics. For each bacterial infection, there may be more than one antibiotic effective against that bacterium; there may be a list of such antibiotics. The domain would be a set of bacteria, and the range would be a set of lists of antibiotics.
Exercises for Section 2.2.3 Functions in other settings.
Exercise 2.2.8 Describe the domain and range for each of the following transformations.
- Bird identification guide book.
- A judge sentences defendants to jail terms.
- The time between sunrise and sunset.
- Antibiotic side effects.
2 As measured, for example, by light absorbance in a spectrophotometer as discussed on page 4.