
Section 5.5: Tree Diagrams
- Page ID
- 215610
\( \newcommand{\vecs}[1]{\overset { \scriptstyle \rightharpoonup} {\mathbf{#1}} } \)
\( \newcommand{\vecd}[1]{\overset{-\!-\!\rightharpoonup}{\vphantom{a}\smash {#1}}} \)
\( \newcommand{\dsum}{\displaystyle\sum\limits} \)
\( \newcommand{\dint}{\displaystyle\int\limits} \)
\( \newcommand{\dlim}{\displaystyle\lim\limits} \)
\( \newcommand{\id}{\mathrm{id}}\) \( \newcommand{\Span}{\mathrm{span}}\)
( \newcommand{\kernel}{\mathrm{null}\,}\) \( \newcommand{\range}{\mathrm{range}\,}\)
\( \newcommand{\RealPart}{\mathrm{Re}}\) \( \newcommand{\ImaginaryPart}{\mathrm{Im}}\)
\( \newcommand{\Argument}{\mathrm{Arg}}\) \( \newcommand{\norm}[1]{\| #1 \|}\)
\( \newcommand{\inner}[2]{\langle #1, #2 \rangle}\)
\( \newcommand{\Span}{\mathrm{span}}\)
\( \newcommand{\id}{\mathrm{id}}\)
\( \newcommand{\Span}{\mathrm{span}}\)
\( \newcommand{\kernel}{\mathrm{null}\,}\)
\( \newcommand{\range}{\mathrm{range}\,}\)
\( \newcommand{\RealPart}{\mathrm{Re}}\)
\( \newcommand{\ImaginaryPart}{\mathrm{Im}}\)
\( \newcommand{\Argument}{\mathrm{Arg}}\)
\( \newcommand{\norm}[1]{\| #1 \|}\)
\( \newcommand{\inner}[2]{\langle #1, #2 \rangle}\)
\( \newcommand{\Span}{\mathrm{span}}\) \( \newcommand{\AA}{\unicode[.8,0]{x212B}}\)
\( \newcommand{\vectorA}[1]{\vec{#1}} % arrow\)
\( \newcommand{\vectorAt}[1]{\vec{\text{#1}}} % arrow\)
\( \newcommand{\vectorB}[1]{\overset { \scriptstyle \rightharpoonup} {\mathbf{#1}} } \)
\( \newcommand{\vectorC}[1]{\textbf{#1}} \)
\( \newcommand{\vectorD}[1]{\overrightarrow{#1}} \)
\( \newcommand{\vectorDt}[1]{\overrightarrow{\text{#1}}} \)
\( \newcommand{\vectE}[1]{\overset{-\!-\!\rightharpoonup}{\vphantom{a}\smash{\mathbf {#1}}}} \)
\( \newcommand{\vecs}[1]{\overset { \scriptstyle \rightharpoonup} {\mathbf{#1}} } \)
\(\newcommand{\longvect}{\overrightarrow}\)
\( \newcommand{\vecd}[1]{\overset{-\!-\!\rightharpoonup}{\vphantom{a}\smash {#1}}} \)
\(\newcommand{\avec}{\mathbf a}\) \(\newcommand{\bvec}{\mathbf b}\) \(\newcommand{\cvec}{\mathbf c}\) \(\newcommand{\dvec}{\mathbf d}\) \(\newcommand{\dtil}{\widetilde{\mathbf d}}\) \(\newcommand{\evec}{\mathbf e}\) \(\newcommand{\fvec}{\mathbf f}\) \(\newcommand{\nvec}{\mathbf n}\) \(\newcommand{\pvec}{\mathbf p}\) \(\newcommand{\qvec}{\mathbf q}\) \(\newcommand{\svec}{\mathbf s}\) \(\newcommand{\tvec}{\mathbf t}\) \(\newcommand{\uvec}{\mathbf u}\) \(\newcommand{\vvec}{\mathbf v}\) \(\newcommand{\wvec}{\mathbf w}\) \(\newcommand{\xvec}{\mathbf x}\) \(\newcommand{\yvec}{\mathbf y}\) \(\newcommand{\zvec}{\mathbf z}\) \(\newcommand{\rvec}{\mathbf r}\) \(\newcommand{\mvec}{\mathbf m}\) \(\newcommand{\zerovec}{\mathbf 0}\) \(\newcommand{\onevec}{\mathbf 1}\) \(\newcommand{\real}{\mathbb R}\) \(\newcommand{\twovec}[2]{\left[\begin{array}{r}#1 \\ #2 \end{array}\right]}\) \(\newcommand{\ctwovec}[2]{\left[\begin{array}{c}#1 \\ #2 \end{array}\right]}\) \(\newcommand{\threevec}[3]{\left[\begin{array}{r}#1 \\ #2 \\ #3 \end{array}\right]}\) \(\newcommand{\cthreevec}[3]{\left[\begin{array}{c}#1 \\ #2 \\ #3 \end{array}\right]}\) \(\newcommand{\fourvec}[4]{\left[\begin{array}{r}#1 \\ #2 \\ #3 \\ #4 \end{array}\right]}\) \(\newcommand{\cfourvec}[4]{\left[\begin{array}{c}#1 \\ #2 \\ #3 \\ #4 \end{array}\right]}\) \(\newcommand{\fivevec}[5]{\left[\begin{array}{r}#1 \\ #2 \\ #3 \\ #4 \\ #5 \\ \end{array}\right]}\) \(\newcommand{\cfivevec}[5]{\left[\begin{array}{c}#1 \\ #2 \\ #3 \\ #4 \\ #5 \\ \end{array}\right]}\) \(\newcommand{\mattwo}[4]{\left[\begin{array}{rr}#1 \amp #2 \\ #3 \amp #4 \\ \end{array}\right]}\) \(\newcommand{\laspan}[1]{\text{Span}\{#1\}}\) \(\newcommand{\bcal}{\cal B}\) \(\newcommand{\ccal}{\cal C}\) \(\newcommand{\scal}{\cal S}\) \(\newcommand{\wcal}{\cal W}\) \(\newcommand{\ecal}{\cal E}\) \(\newcommand{\coords}[2]{\left\{#1\right\}_{#2}}\) \(\newcommand{\gray}[1]{\color{gray}{#1}}\) \(\newcommand{\lgray}[1]{\color{lightgray}{#1}}\) \(\newcommand{\rank}{\operatorname{rank}}\) \(\newcommand{\row}{\text{Row}}\) \(\newcommand{\col}{\text{Col}}\) \(\renewcommand{\row}{\text{Row}}\) \(\newcommand{\nul}{\text{Nul}}\) \(\newcommand{\var}{\text{Var}}\) \(\newcommand{\corr}{\text{corr}}\) \(\newcommand{\len}[1]{\left|#1\right|}\) \(\newcommand{\bbar}{\overline{\bvec}}\) \(\newcommand{\bhat}{\widehat{\bvec}}\) \(\newcommand{\bperp}{\bvec^\perp}\) \(\newcommand{\xhat}{\widehat{\xvec}}\) \(\newcommand{\vhat}{\widehat{\vvec}}\) \(\newcommand{\uhat}{\widehat{\uvec}}\) \(\newcommand{\what}{\widehat{\wvec}}\) \(\newcommand{\Sighat}{\widehat{\Sigma}}\) \(\newcommand{\lt}{<}\) \(\newcommand{\gt}{>}\) \(\newcommand{\amp}{&}\) \(\definecolor{fillinmathshade}{gray}{0.9}\)- Use tree diagrams to find sample spaces and compute probabilities.
At the beginning of this section, we've learned how to calculate probabilities for single eventsThis works perfectly when one thing happens, such as, rolling a die, drawing a card, or spinning a spinner once. But what happens when we have more than one event? For instance, flip a coin twice, draw two marbles from an urn, choose a shirt and then choose pants. Suddenly, keeping track of all the possibilities becomes confusing. How many outcomes are there? What's the probability of each? Did we miss any? Tree diagrams solve this problem by giving us a visual way to organize all possible outcomes when multiple events happen in sequence. They help us see every possibility, calculate probabilities systematically, and avoid making mistakes. Think of tree diagrams as a road map for probability; they show us every path we can take and help us calculate the probability of ending up at each destination. In this section, we'll learn how to create and use tree diagrams to solve multi-stage probability problems with confidence and clarity.
A tree diagram is a visual tool used to systematically list all possible outcomes of a probability experiment or sequence of events. It gets its name from its branching structure that resembles an upside-down tree.
Key Features of a tree diagram:
- Branches represent different possible outcomes or choices
- Nodes (junction points) represent decision points or stages
- Paths from start to end represent complete sequences of outcomes
- Probabilities are often labeled on branches
Advantages of Using Tree Diagrams
-
Visual Organization
- Makes complex probability problems easier to understand
- Shows all possible outcomes systematically
- Prevents missing outcomes
-
Probability Calculation
- Multiply probabilities along each path
- Add probabilities of different paths leading to same outcome
- Clear visualization of dependent vs. independent events
-
Sequential Events
- Perfect for multi-stage experiments
- Shows how earlier events affect later probabilities
- Demonstrates "with replacement" vs. "without replacement"
-
Educational Value
- Helps students understand probability concepts
- Builds logical thinking skills
- Foundation for more advanced probability theory
For a single flip, there are two branches:
Heads (H) and Tails (T), each with a 50% or \(\frac{1}{2}\) probability.
For one coin flip:
- Start with a single point (node).
- Draw two branches from this point. Label one branch "H" (Heads) and the other "T" (Tails).
- Label each branch with its probability: \(\frac{1}{2}\)
- The possible outcomes are H and T. The sum of the probabilities must equal 1, \(\left( \frac{1}{2} + \frac{1}{2}=1 \right)\).
For a single roll, there are six branches: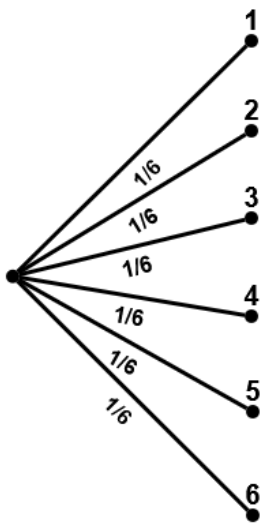
1, 2, 3, 4, 5, and 6, each with a \(16\frac{2}{3}\%\) or \(\frac{1}{6}\) probability.
For one coin flip:
- Start with a single point (node).
- Draw six branches from this point. Label each branch "1", "2", "3", "4", "5", and "6", respectively.
- Label each branch with its probability: \(\frac{1}{6}\)
- The possible outcomes are 1, 2, 3, 4, 5, and 6. The sum of the probabilities must equal 1, \(\left( \frac{1}{6} + \frac{1}{6} + \frac{1}{6} + \frac{1}{6} + \frac{1}{6} + \frac{1}{6}=1 \right)\).
The two tree diagrams presented above demonstrate experiments with equally likely outcomes. It is important to note, however, that equal likelihood is not a universal characteristic of all probability experiments. We will now explore several examples that illustrate situations with unequal probabilities.
Draw one marble from an urn containing one red, two white, and four blue marbles. Draw a tree diagram to represent the experiment.
✅ Solution:
 For one draw:
- Start with a single point (node).
- Draw three branches from this point. Label one branch "R" (Red), one branch "W" (White), and the other "B" (Blue).
- Label the "R" branch \(\frac{1}{7}\), the "W" branch \(\frac{2}{7}\), and the "R" branch \(\frac{4}{7}\).
- The possible outcomes are R, W and T. The sum of the probabilities must equal 1, \(\left( \frac{1}{7} + \frac{2}{7} + \frac{4}{7}=1 \right)\).
Draw one marble from an urn containing one red, two white, and four blue marbles. Draw a tree diagram to represent the experiment.
✅ Solution:
 For one draw:
- Start with a single point (node).
- Draw four branches from this point. Label one branch "G" (Green), one branch "P" (Purple), one branch "O" (Orange), and the other "Y" (Yellow).
- Label the "G" branch \(\frac{4}{18}\), the "P" branch \(\frac{3}{8}\), the "O" branch \(\frac{5}{18}\), and the "Y" branch \(\frac{6}{18}\).
- The possible outcomes are G, P, O and Y. The sum of the probabilities must equal 1, \(\left( \frac{4}{18} + \frac{3}{18} + \frac{5}{18} + \frac{6}{18}=1 \right)\).
You order a package online. The store offers two shipping options: Standard shipping (free) and express shipping ($15). Last month's records determined the 70% of customers choose the standard shipping option, while 30% choose the express shipping option. Draw a tree diagram to represent the experiment.
✅ Solution:
For one choice:
- Start with a single point (node).
- Draw two branches from this point. Label one branch "S" (Shipping) and the other "E" (Evidence).
- Label the "S" branch \(\frac{7}{10}\), and the "E" branch \(\frac{3}{10}\).
- The possible outcomes are S, and E. The sum of the probabilities must equal 1, \(\left( \frac{7}{10} + \frac{3}{10}=1 \right)\).
With replacement vs. without replacement
Looking at the examples involving drawing one marble, what if two marbles were drawn at random? This would require what we call two-stage tree diagrams. In order to understand these new diagrams, we need to establish if replacement of the draw exists or not. With replacement, means after an item is drawn or selected, the item is put back before the next selection. This means that any item that was selected first has the possibility of also being selected on second or any other multiple draw. So, this results in the total number of outcomes staying the same and the probabilities do NOT change from one draw/selection to the next. Without replacement, means after an item is drawn or selected, the item is NOT put back before the next selection. This means that any item that was selected first, that exact same item cannot ever be selected again on second or any other multiple draw. So, this results in the total number of outcomes decreasing on each draw/selection and the probabilities change from one draw/selection to the next. Here is a summary:
| Feature | With Replacement | Without Replacement |
|---|---|---|
| Item returned? | Yes | No |
| Total outcomes change? | No | Yes |
| Probabilities stay the same? | Yes | No |
| Common example | Coin flips / Die rolls | Marble draws / Card draws |
Flip a fair coin twice. Draw a tree diagram to represent the experiment.
✅ Solution:
For a single flip, there are two branches: Heads (H) and Tails (T), each with a 50% or \(\frac{1}{2}\) probability. This is exactly the same case in a one stage tree diagram.
First flip:
- Start with a single point (node).
- Draw two branches from this point. Label one branch "H" (Heads) and the other "T" (Tails).
- Label each branch with its probability: \(\frac{1}{2}\)
- The possible outcomes are H and T. The sum of the probabilities must equal 1, \(\left( \frac{1}{2} + \frac{1}{2}=1 \right)\).
Second flip:
Second flip is with replacement, because the first outcome can occur again.
- Go to the node at the end of the first branch from the one-stage tree diagram.
- Draw two branches from this point. Label one branch "H" (Heads) and the other "T" (Tails).
- Label each branch with its probability: \(\frac{1}{2}\)
- Now, go to the node at the end of the next branch from the one-stage tree diagram.
- Draw two branches from this point. Label one branch "H" (Heads) and the other "T" (Tails).
- Label each branch with its probability: \(\frac{1}{2}\)
- There should be four possible outcomes, HH, HT, TH, and TT. The sum of the probabilities must equal 1 for each set of branches from any of the three nodes, which is each \(\frac{1}{2} + \frac{1}{2}=1\).
From the two-stage tree diagram above, we can ask several follow up questions:
- What is the probability of getting two heads? To find the probability of a specific path, you multiply the probabilities along the branches. Here, we are looking for the outcome HH. Follow the branch that gets us HH. As you get to HH, the probabilities that are along the branches are \(\frac{1}{2}\) and \(\frac{1}{2}\). Now, multiply those probabilities. Thus, the probability P(HH) = \(\frac{1}{2}\cdot\frac{1}{2}=\frac{1}{4}\).
- What is the probability of getting exactly one head and exactly one tail? This is considered an "either/or" scenario. To find the probability of an "either/or" scenario, multiply the probabilities along each branch, then add the probabilities of the relevant paths together. For this problem, we want either HT or TH. Follow the branch for HT multiplying those probabilities, P(HT) = \(\frac{1}{2}\cdot\frac{1}{2}=\frac{1}{4}\), and the branch for TH multiplying those probabilities, P(TH) = \(\frac{1}{2}\cdot\frac{1}{2}=\frac{1}{4}\), then add their probabilities. Thus, the probability getting exactly one head and exactly one tail = P(HT) + P(TH) = \(\frac{1}{4} + \frac{1}{4}=\frac{1}{2}\).
- What is the probability of getting at least one head? Here, we will cut to the chase. At least one head means, we want HT, TH, or HH. So, the probability of getting at least one head = P(HH) + P(HT)+ P(TH) = \(\frac{1}{2}\cdot\frac{1}{2}+\frac{1}{2}\cdot\frac{1}{2}+\frac{1}{2}\cdot\frac{1}{2}=\frac{1}{4}+\frac{1}{4}+\frac{1}{4}=\frac{3}{4}\).
- What is the probability of getting at most one head? At most one head means (0 or 1 head), we want HT, TH, or TT. So, the probability of getting at most one head = P(HT) + P(TH)+ P(TT) = \(\frac{1}{2}\cdot\frac{1}{2}+\frac{1}{2}\cdot\frac{1}{2}+\frac{1}{2}\cdot\frac{1}{2}=\frac{1}{4}+\frac{1}{4}+\frac{1}{4}=\frac{3}{4}\).
The principles used for constructing two-stage tree diagrams extend naturally to multi-stage diagrams involving three, four, or more stages. However, as the number of stages increases, these diagrams become significantly more complex and cumbersome to construct. For problems involving numerous stages, alternative probability methods and advanced techniques provide more efficient solution strategies. These advanced methods and techniques are typically covered in higher-level mathematics courses such as statistics, combinatorics, or advanced probability theory.
Draw two marbles with replacement from an urn containing one red, two white, and four blue marbles. Draw a tree diagram to represent the experiment.
✅ Solution:
First draw:
- Start with a single point (node).
- Draw two branches from this point. Label one branch "R" (Red), one branch "W" (White), and the other "B" (Blue).
- Label the "R" branch \(\frac{1}{2}\), the "W" branch \(\frac{2}{7}\), and the "B" branch \(\frac{4}{7}\).
- The possible outcomes are R, W, and B. The sum of the probabilities must equal 1, \(\left( \frac{1}{7} + \frac{2}{7} + \frac{4}{7}=1 \right)\).
Second draw:
Second draw is with replacement, which means the first draw is returned to the urn.
- Go to the node at the end of the first branch (R) from the one-stage tree diagram.
Draw three branches from this point. - Label one branch "R" (Red), another branch "W" (White), and another branch "B" (Blue).
- Label each branch with its appropriate probability: \(\frac{1}{7}, \frac{2}{7}, \frac{4}{7},\) respectively.
- Now, go to the second node at the end of the next branch (W) from the one-stage tree diagram.
Draw three branches from this point. - Label one branch "R" (Red), another branch "W" (White), and another branch "B" (Blue).
- Label each branch with its appropriate probability: \(\frac{1}{7}, \frac{2}{7}, \frac{4}{7},\) respectively.
- Now, go to the third node at the end of the last branch (B) from the one-stage tree diagram.
- Draw three branches from this point. Label one branch "R" (Red), another branch "W" (White), and another branch "B" (Blue).
- Label each branch with its appropriate probability: \(\frac{1}{7}, \frac{2}{7}, \frac{4}{7},\) respectively.
- There should be a total of nine possible outcomes, RR, RW, RB, WR, WW, WB, BR, BW, and BB. The sum of the probabilities must equal 1 for each branch that connects any two nodes.
Draw two marbles without replacement from an urn containing one red, two white, and four blue marbles. Draw a tree diagram to represent the experiment.
✅ Solution:
First draw:
- Start with a single point (node).
- Draw two branches from this point. Label one branch "R" (Red), one branch "W" (White), and the other "B" (Blue).
- Label the "R" branch \(\frac{1}{2}\), the "W" branch \(\frac{2}{7}\), and the "B" branch \(\frac{4}{7}\).
- The possible outcomes are R, W, and B. The sum of the probabilities must equal 1, \(\left( \frac{1}{7} + \frac{2}{7} + \frac{4}{7}=1 \right)\).
Second draw:
Second draw is without replacement, which means the first draw is NOT returned to the urn. This means the sample space on the second draw has changed from the first.
- Go to the node at the end of the first branch (R) from the one-stage tree diagram.
- Draw only two branches from this point. Label one branch "W" (White) and another branch "B" (Blue). There is no possible outcome of a red on the second draw, because the only red marble was removed on the first draw.
- Label each branch with its appropriate probability: \(\frac{2}{6}, \frac{4}{6},\) respectively.
- Now, go to the second node at the end of the next branch (W) from the one-stage tree diagram.
Draw three branches from this point. - Label one branch "R" (Red), another branch "W" (White), and another branch "B" (Blue).
- Label each branch with its appropriate probability: \(\frac{1}{6}, \frac{1}{6}, \frac{4}{6}\) respectively.
- Now, go to the third node at the end of the last branch (B) from the one-stage tree diagram.
- Draw three branches from this point. Label one branch "R" (Red), another branch "W" (White), and another branch "B" (Blue).
- Label each branch with its appropriate probability: \(\frac{1}{6}, \frac{2}{6}, \frac{3}{6}\) respectively.
- There should be a total of nine possible outcomes, RR, RW, RB, WR, WW, WB, BR, BW, and BB which happen to be the same exact nine outcomes from Example #5.5.4. However, the probabilities of obtaining these individual outcomes are different, because this experiment was done without replacement. Again, the sum of the probabilities must equal 1 for each branch that connects any two nodes.
In Example #5.5.6, when two marbles were drawn without replacement, answer the following questions.
- What is the probability of drawing both blue marbles?
- What is the probability of drawing a red and a blue marble?
- What is the probability of drawing at least one blue marble?
- What is the probability of drawing both red marbles?
✅ Solution:
First draw:
- \(P(\text{BB})=\frac{4}{7}\cdot\frac{3}{6}=\frac{4\cdot 3}{7\cdot 6}=\frac{2}{7}\)
- \(P(\text{RB}) + P(\text{BR})=\frac{1}{7}\cdot\frac{4}{6}+\frac{4}{7}\cdot\frac{1}{6}=\frac{1\cdot 4}{7\cdot 6}+\frac{4\cdot 1}{7\cdot 6}=\frac{2}{21}+\frac{2}{21}=\frac{4}{21}\)
- \(P(\text{RB}) + P(\text{WB})+P(\text{BR})+P(\text{BW})+P(\text{BB})=\frac{1}{7}\cdot\frac{4}{6}+\frac{2}{7}\cdot\frac{4}{6}+\frac{4}{7}\cdot\frac{1}{6}+\frac{4}{7}\cdot\frac{2}{6}+\frac{4}{7}\cdot\frac{3}{6}=\frac{4}{42}+\frac{8}{42}+\frac{4}{42}+\frac{8}{42}+\frac{12}{42}=\frac{36}{42}=\frac{6}{7}\)
- \(P(\text{RR})=0\)
- An urn containing eight orange marbles, three purple marbles, and four gray marbles. A marble is drawn at random. Draw a tree diagram to represent the experiment.
- A standard deck of 52 cards contains the following 4 suits: 13 diamonds, 13 hearts, 13 clubs, and 13 spades. A card is drawn at random and the suit is observed. Draw a tree diagram to represent the experiment.
- A 4-sided die with outcomes 1, 2, 3, and 4 is rolled. Draw a tree diagram to represent the experiment.
- Draw two coins with replacement from a coffee can that contains five pennies, four nickels, and three dimes. Draw a tree diagram to represent the experiment.
- What is the probability of drawing both blue pennies?
- What is the probability of drawing a dime on the first draw and a nickel on the second?
- What is the probability of drawing a dime and a nickel?
- What is the probability of drawing at least one dime?
- Draw two marbles without replacement from an urn containing eight orange marbles, three purple marbles, and four gray marbles. Draw a tree diagram to represent the experiment.
- What is the probability of drawing both purple marbles?
- What is the probability of drawing an orange and a purple marble?
- What is the probability of drawing at least one orange marble?
- What is the probability of not drawing both gray marbles?
- Answers
-
1. ; 2. ; 3. ; 4. ; 5. .