
Section 7.1: Preference Tables
- Page ID
- 219467
\( \newcommand{\vecs}[1]{\overset { \scriptstyle \rightharpoonup} {\mathbf{#1}} } \)
\( \newcommand{\vecd}[1]{\overset{-\!-\!\rightharpoonup}{\vphantom{a}\smash {#1}}} \)
\( \newcommand{\dsum}{\displaystyle\sum\limits} \)
\( \newcommand{\dint}{\displaystyle\int\limits} \)
\( \newcommand{\dlim}{\displaystyle\lim\limits} \)
\( \newcommand{\id}{\mathrm{id}}\) \( \newcommand{\Span}{\mathrm{span}}\)
( \newcommand{\kernel}{\mathrm{null}\,}\) \( \newcommand{\range}{\mathrm{range}\,}\)
\( \newcommand{\RealPart}{\mathrm{Re}}\) \( \newcommand{\ImaginaryPart}{\mathrm{Im}}\)
\( \newcommand{\Argument}{\mathrm{Arg}}\) \( \newcommand{\norm}[1]{\| #1 \|}\)
\( \newcommand{\inner}[2]{\langle #1, #2 \rangle}\)
\( \newcommand{\Span}{\mathrm{span}}\)
\( \newcommand{\id}{\mathrm{id}}\)
\( \newcommand{\Span}{\mathrm{span}}\)
\( \newcommand{\kernel}{\mathrm{null}\,}\)
\( \newcommand{\range}{\mathrm{range}\,}\)
\( \newcommand{\RealPart}{\mathrm{Re}}\)
\( \newcommand{\ImaginaryPart}{\mathrm{Im}}\)
\( \newcommand{\Argument}{\mathrm{Arg}}\)
\( \newcommand{\norm}[1]{\| #1 \|}\)
\( \newcommand{\inner}[2]{\langle #1, #2 \rangle}\)
\( \newcommand{\Span}{\mathrm{span}}\) \( \newcommand{\AA}{\unicode[.8,0]{x212B}}\)
\( \newcommand{\vectorA}[1]{\vec{#1}} % arrow\)
\( \newcommand{\vectorAt}[1]{\vec{\text{#1}}} % arrow\)
\( \newcommand{\vectorB}[1]{\overset { \scriptstyle \rightharpoonup} {\mathbf{#1}} } \)
\( \newcommand{\vectorC}[1]{\textbf{#1}} \)
\( \newcommand{\vectorD}[1]{\overrightarrow{#1}} \)
\( \newcommand{\vectorDt}[1]{\overrightarrow{\text{#1}}} \)
\( \newcommand{\vectE}[1]{\overset{-\!-\!\rightharpoonup}{\vphantom{a}\smash{\mathbf {#1}}}} \)
\( \newcommand{\vecs}[1]{\overset { \scriptstyle \rightharpoonup} {\mathbf{#1}} } \)
\(\newcommand{\longvect}{\overrightarrow}\)
\( \newcommand{\vecd}[1]{\overset{-\!-\!\rightharpoonup}{\vphantom{a}\smash {#1}}} \)
\(\newcommand{\avec}{\mathbf a}\) \(\newcommand{\bvec}{\mathbf b}\) \(\newcommand{\cvec}{\mathbf c}\) \(\newcommand{\dvec}{\mathbf d}\) \(\newcommand{\dtil}{\widetilde{\mathbf d}}\) \(\newcommand{\evec}{\mathbf e}\) \(\newcommand{\fvec}{\mathbf f}\) \(\newcommand{\nvec}{\mathbf n}\) \(\newcommand{\pvec}{\mathbf p}\) \(\newcommand{\qvec}{\mathbf q}\) \(\newcommand{\svec}{\mathbf s}\) \(\newcommand{\tvec}{\mathbf t}\) \(\newcommand{\uvec}{\mathbf u}\) \(\newcommand{\vvec}{\mathbf v}\) \(\newcommand{\wvec}{\mathbf w}\) \(\newcommand{\xvec}{\mathbf x}\) \(\newcommand{\yvec}{\mathbf y}\) \(\newcommand{\zvec}{\mathbf z}\) \(\newcommand{\rvec}{\mathbf r}\) \(\newcommand{\mvec}{\mathbf m}\) \(\newcommand{\zerovec}{\mathbf 0}\) \(\newcommand{\onevec}{\mathbf 1}\) \(\newcommand{\real}{\mathbb R}\) \(\newcommand{\twovec}[2]{\left[\begin{array}{r}#1 \\ #2 \end{array}\right]}\) \(\newcommand{\ctwovec}[2]{\left[\begin{array}{c}#1 \\ #2 \end{array}\right]}\) \(\newcommand{\threevec}[3]{\left[\begin{array}{r}#1 \\ #2 \\ #3 \end{array}\right]}\) \(\newcommand{\cthreevec}[3]{\left[\begin{array}{c}#1 \\ #2 \\ #3 \end{array}\right]}\) \(\newcommand{\fourvec}[4]{\left[\begin{array}{r}#1 \\ #2 \\ #3 \\ #4 \end{array}\right]}\) \(\newcommand{\cfourvec}[4]{\left[\begin{array}{c}#1 \\ #2 \\ #3 \\ #4 \end{array}\right]}\) \(\newcommand{\fivevec}[5]{\left[\begin{array}{r}#1 \\ #2 \\ #3 \\ #4 \\ #5 \\ \end{array}\right]}\) \(\newcommand{\cfivevec}[5]{\left[\begin{array}{c}#1 \\ #2 \\ #3 \\ #4 \\ #5 \\ \end{array}\right]}\) \(\newcommand{\mattwo}[4]{\left[\begin{array}{rr}#1 \amp #2 \\ #3 \amp #4 \\ \end{array}\right]}\) \(\newcommand{\laspan}[1]{\text{Span}\{#1\}}\) \(\newcommand{\bcal}{\cal B}\) \(\newcommand{\ccal}{\cal C}\) \(\newcommand{\scal}{\cal S}\) \(\newcommand{\wcal}{\cal W}\) \(\newcommand{\ecal}{\cal E}\) \(\newcommand{\coords}[2]{\left\{#1\right\}_{#2}}\) \(\newcommand{\gray}[1]{\color{gray}{#1}}\) \(\newcommand{\lgray}[1]{\color{lightgray}{#1}}\) \(\newcommand{\rank}{\operatorname{rank}}\) \(\newcommand{\row}{\text{Row}}\) \(\newcommand{\col}{\text{Col}}\) \(\renewcommand{\row}{\text{Row}}\) \(\newcommand{\nul}{\text{Nul}}\) \(\newcommand{\var}{\text{Var}}\) \(\newcommand{\corr}{\text{corr}}\) \(\newcommand{\len}[1]{\left|#1\right|}\) \(\newcommand{\bbar}{\overline{\bvec}}\) \(\newcommand{\bhat}{\widehat{\bvec}}\) \(\newcommand{\bperp}{\bvec^\perp}\) \(\newcommand{\xhat}{\widehat{\xvec}}\) \(\newcommand{\vhat}{\widehat{\vvec}}\) \(\newcommand{\uhat}{\widehat{\uvec}}\) \(\newcommand{\what}{\widehat{\wvec}}\) \(\newcommand{\Sighat}{\widehat{\Sigma}}\) \(\newcommand{\lt}{<}\) \(\newcommand{\gt}{>}\) \(\newcommand{\amp}{&}\) \(\definecolor{fillinmathshade}{gray}{0.9}\)- Interpret the information in a preference table
Introduction
The Challenge of Group Decision-Making
Imagine your class needs to choose one destination for a field trip. Three options are available:
- Museum (M)
- Amusement Park (A)
- Beach (B)
Simple scenario: If everyone votes and the Museum gets 15 votes, Amusement Park gets 8 votes, and Beach gets 7 votes, the Museum wins, right? But wait, what if those 15 Museum voters represent only half the class? That means 15 other students (the majority!) preferred something else. Is this fair? Does this truly represent what the class wants?
Now imagine a more complex situation: What if different people feel differently how strongly they prefer each option? What if the Museum voters would be fine with the Beach, but the Amusement Park voters absolutely dislike the Museum? Should that matter?
This is the fundamental problem: When groups of people need to make a single collective choice, how do we fairly combine everyone's preferences into one decision?
Why Simple Majority Voting Isn't Always Enough
With Two Options: Majority voting works perfectly.
- Option A vs. Option B
- Count the votes
- Whichever gets more wins
- Clear, fair, done
With Three or More Options: Things get complicated.
- No one might get a majority (>50%)
- The "winner" might be strongly opposed by most voters
- Your vote might feel "wasted" if you don't vote for a frontrunner
- The outcome might depend on which voting method you use
Historical Example: The 2000 U.S. Presidential Election
- George W. Bush vs. Al Gore (main candidates)
- Ralph Nader (third-party candidate)
- Nader received about 97,000 votes in Florida
- Bush won Florida by only 537 votes
- Many Nader voters preferred Gore to Bush as their second choice
- Did Nader "spoil" the election by splitting the vote?
This raises questions: Would a different voting method have produced a different (perhaps "better" or "fairer") outcome?
What Are Voting Methods?
Voting methods (also called electoral systems or social choice functions) are mathematical procedures for translating individual preferences into a collective decision. The key Idea here is that different methods can produce different winners from the exact same set of voter preferences. Think of voting methods as different "recipes" for combining the same ingredients (voter preferences) into different outcomes (winners).
The Four Major Voting Methods
In this chapter, we will explore the four major voting methods that represent different philosophical approaches to fairness. They are the following:
Plurality Method (First-Past-the-Post)
Borda Count Method (Positional Voting)
Plurality with Elimination (Instant Runoff Voting / Ranked-Choice Voting)
Pairwise Comparison (Condorcet Method)
Why We Need Multiple Voting Methods
You might wonder: "If there are different methods that give different results, isn't there one correct method we should always use?" This is what we will explore throughout the chapter to determine if one such method even exists.
So, prior to discussing any type of voting methods, we must first have a full understanding of preference tables.
A preference table (also called a preference schedule or voter profile) is a systematic way to organize and display voting data when voters rank multiple candidates or options in order of preference. Rather than listing each individual ballot separately, preference tables group identical rankings together, showing how many voters shared each particular ranking pattern.
Preference tables are fundamental tools in voting theory and social choice theory, a branches of mathematics and statistics that study how groups make collective decisions. They help us analyze elections with multiple candidates, understand different voting methods, and explore questions about fairness in democratic decision-making.
Preference tables help by capturing more information. They take in account not just first choices only, but complete rankings. This allows us to:
- See second and third choices and so on
- Identify compromise options
- Apply different voting methods
- Make more informed group decisions
Basic Structure of a Preference Table
| # of Voters | [#] | [#] | [#] | \(\large\cdots\) |
|---|---|---|---|---|
| 1st Choice | Candidate | Candidate | Candidate | \(\large\cdots\) |
| 2nd Choice | Candidate | Candidate | Candidate | \(\large\cdots\) |
| 3rd Choice | Candidate | Candidate | Candidate | \(\large\cdots\) |
| \(\large\cdots\) | \(\large\cdots\) | \(\large\cdots\) | \(\large\cdots\) | \(\large\cdots\) |
How to Read a Preference Table:
- Each column is representing a "group" of voters with identical preferences
- Reading down the column shows their ranking from favorite to least favorite
- Each voter appears in exactly one column
- The number [#] at the top of each column shows how many voters had that exact ranking
- The sum of all columns equals total number of voters
Suppose there are candidates A, B, and C. You are asked to rank each candidate in order of preference. In this case, there are six possible ways to rank the candidates, as shown:

Now, suppose that 20 club members are to rank each candidate in order of preference. The results are as follows:

Create a preference table based on the above results.
✅ Solution:
To organize our ballots, we'll group together all the ones that have identical rankings. We can visualize this by assigning a color to each unique preference order:
- Blue: A > B > C (A first, B second, C third)
- Yellow: A > C > B (A first, C second, B third)
- Orange: B > C > A (B first, C second, A third)
- Green: C > B > A (C first, B second, A third)

Note: This organization technique is not necessary required for similar problems, but helps show it is clear, visual, and educational; perfect for helping students understand the ballot-grouping concept!
So, tallying up the votes, here are the results in a preference table:
| Number of Voters | 9 | 5 | 3 | 3 |
|---|---|---|---|---|
| First Choice | A | A | B | C |
| Second Choice | B | C | C | B |
| Third Choice | C | B | A | A |
From the table:
The sum of the numbers in the top row indicates the total number of voters, 9 + 5 + 4 + 2 = 20.
- The "First Choice" row indicates:
- There are 9 + 5 = 14 voters that picked candidate A as their first choice.
- There are 3 voters that picked B as their first choice.
- There are 3 voters that picked C as their first choice.
- The "Second Choice" row indicates:
- There are 9 + 3 = 11 voters that picked candidate B as their second choice.
- There are 5 + 3 = 8 voters that picked C as their second choice.
- There are 0 voters that picked A as their second choice.
- The "Third Choice" row indicates:
- There are 3 + 3 = 6 voters that picked candidate A as their third choice.
- There are 5 voters that picked B as their third choice.
- There are 9 voters that picked C as their third choice.
Also, note there are no voters who casts the following ranked ballots:

Thus, those possible rankings are not listed as columns (or outcomes) in the preference table above.
A school council has 40 members and are asked to rank three candidates in order of preference. The results are as follows:

Create a preference table based on the above results.
✅ Solution:
So, tallying up the votes, here are the results in a preference table:
| Number of Voters | 9 | 7 | 7 | 6 | 6 | 5 |
|---|---|---|---|---|---|---|
| First Choice | B | B | A | C | C | A |
| Second Choice | A | C | B | B | A | C |
| Third Choice | C | A | C | A | B | B |
Consider the following preference table for a union president from faculty at a local college:
| Number of Voters | 11 | 10 | 8 | 6 | 3 |
|---|---|---|---|---|---|
| First Choice | Rob | Don | Rob | Amy | Rob |
| Second Choice | Jen | Jen | Amy | Jen | Don |
| Third Choice | Don | Amy | Jen | Don | Jen |
| Fourth Choice | Amy | Rob | Don | Rob | Amy |
- How many total voters were there?
- How many people voted for Rob as their first choice?
- Which candidate has the least number of first choice votes?
- How many people voted for Jen as their second choice?
✅ Solution:
- Add the top row: 11 + 10 + 8 + 6 + 3 = 38 votes
- Look at the first choice row and add the corresponding numbers from the top row for Rob: 11 + 8 + 3 = 22 people
- Look at the first choice row and add the corresponding numbers from the top row for all candidates: Jen has 0 first place votes
- Look at the second choice row and add the corresponding numbers from the top row: 11 + 10 + 6 = 27 people
A group of fans at the John Wick Experience in Las Vegas, NV were asked to rank the four films from the John Wick Franchise. The results are in the following preference table:
| Number of Voters | 15 | 8 | 6 | 5 | 2 |
|---|---|---|---|---|---|
| First Choice | John Wick 2 | John Wick 4 | John Wick 4 | John Wick 1 | John Wick 4 |
| Second Choice | John Wick 4 | John Wick 1 | John Wick 2 | John Wick 2 | John Wick 3 |
| Third Choice | John Wick 1 | John Wick 2 | John Wick 1 | John Wick 4 | John Wick 2 |
| Fourth Choice | John Wick 3 | John Wick 3 | John Wick 3 | John Wick 3 | John Wick 1 |
- How many total voters were there?
- How many people voted for John Wick 1 as their first choice?
- Which film has the most number of first choice votes?
- Which film has the least number of first choice votes?
- Which film has the most number of last choice votes?
- How many people voted for John Wick 4 as their second choice?
✅ Solution:
- Add the top row: 15 + 8 + 6 + 5 + 2 = 36 votes
- Look at the first choice row and add the corresponding numbers from the top row for John Wick 1: 5 people
- Look at the first choice row and add the corresponding numbers from the top row for all candidates: John Wick 4 has a total of 8 + 6 + 2 = 16 votes, which is the most
- Look at the first choice row and add the corresponding numbers from the top row for all candidates: John Wick 3 has a total of 0 votes which is the most
- Look at the fourth choice row and add the corresponding numbers from the top row for all candidates: Both John Wick 2 and John Wick 4 have a total of 0 votes which is the least
- Look at the second choice row and add the corresponding numbers from the top row for John Wick 4: John Wick 4 has a total of 15 votes
-
The leader of a local Benevolent and Protective Order of Elks (BPOE) lodge is known as the Exalted Ruler. A local Elks Lodge has 20 members and are asked to rank four candidates in order of preference to be the next Exalted Ruler. The results are as follows:
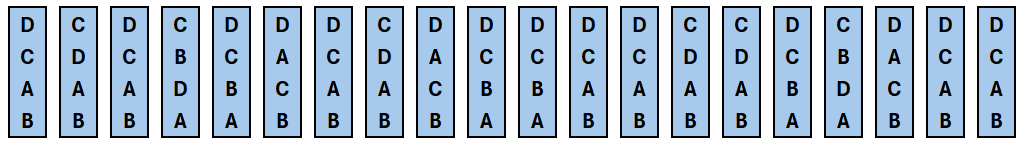
Create a preference table based on the above results.
-
A group of fans after seeing a special advanced screening of Scream 7 were asked to rank the seven films from the Scream franchise. The results are in the following preference table:
Number of Voters 7 5 4 3 1 First Choice Scream 1 Scream 3 Scream 1 Scream 2 Scream 7 Second Choice Scream 3 Scream 1 Scream 2 Scream 1 Scream 6 Third Choice Scream 2 Scream 2 Scream 3 Scream 3 Scream 5 Fourth Choice Scream 4 Scream 4 Scream 4 Scream 5 Scream 4 Fifth Choice Scream 5 Scream 6 Scream 5 Scream 4 Scream 3 Sixth Choice Scream 7 Scream 5 Scream 6 Scream 7 Scream 2 Seven Choice Scream 6 Scream 7 Scream 7 Scream 6 Scream 1 - How many total voters were there?
- How many people voted for the Scream 1 as their first choice?
- Which film has the least number of first choice votes?
- Which film has the most number of last choice votes?
- How many people voted for Scream 3 as their third choice?
- Which film has the most number of second choice votes?
- Answers
-
-
Number of Voters 7 4 4 3 2 First Choice D D C D C Second Choice C C D A B Third Choice A B A C D Fourth Choice B A B B A
-
-
-
- 20
- 11
- Scream 4, Scream 5, Scream 6
- Scream 6
- 7
- Scream 1
-