
4.7: Graphs of Linear Inequalities
- Page ID
- 15149

\( \newcommand{\vecs}[1]{\overset { \scriptstyle \rightharpoonup} {\mathbf{#1}} } \)
\( \newcommand{\vecd}[1]{\overset{-\!-\!\rightharpoonup}{\vphantom{a}\smash {#1}}} \)
\( \newcommand{\dsum}{\displaystyle\sum\limits} \)
\( \newcommand{\dint}{\displaystyle\int\limits} \)
\( \newcommand{\dlim}{\displaystyle\lim\limits} \)
\( \newcommand{\id}{\mathrm{id}}\) \( \newcommand{\Span}{\mathrm{span}}\)
( \newcommand{\kernel}{\mathrm{null}\,}\) \( \newcommand{\range}{\mathrm{range}\,}\)
\( \newcommand{\RealPart}{\mathrm{Re}}\) \( \newcommand{\ImaginaryPart}{\mathrm{Im}}\)
\( \newcommand{\Argument}{\mathrm{Arg}}\) \( \newcommand{\norm}[1]{\| #1 \|}\)
\( \newcommand{\inner}[2]{\langle #1, #2 \rangle}\)
\( \newcommand{\Span}{\mathrm{span}}\)
\( \newcommand{\id}{\mathrm{id}}\)
\( \newcommand{\Span}{\mathrm{span}}\)
\( \newcommand{\kernel}{\mathrm{null}\,}\)
\( \newcommand{\range}{\mathrm{range}\,}\)
\( \newcommand{\RealPart}{\mathrm{Re}}\)
\( \newcommand{\ImaginaryPart}{\mathrm{Im}}\)
\( \newcommand{\Argument}{\mathrm{Arg}}\)
\( \newcommand{\norm}[1]{\| #1 \|}\)
\( \newcommand{\inner}[2]{\langle #1, #2 \rangle}\)
\( \newcommand{\Span}{\mathrm{span}}\) \( \newcommand{\AA}{\unicode[.8,0]{x212B}}\)
\( \newcommand{\vectorA}[1]{\vec{#1}} % arrow\)
\( \newcommand{\vectorAt}[1]{\vec{\text{#1}}} % arrow\)
\( \newcommand{\vectorB}[1]{\overset { \scriptstyle \rightharpoonup} {\mathbf{#1}} } \)
\( \newcommand{\vectorC}[1]{\textbf{#1}} \)
\( \newcommand{\vectorD}[1]{\overrightarrow{#1}} \)
\( \newcommand{\vectorDt}[1]{\overrightarrow{\text{#1}}} \)
\( \newcommand{\vectE}[1]{\overset{-\!-\!\rightharpoonup}{\vphantom{a}\smash{\mathbf {#1}}}} \)
\( \newcommand{\vecs}[1]{\overset { \scriptstyle \rightharpoonup} {\mathbf{#1}} } \)
\(\newcommand{\longvect}{\overrightarrow}\)
\( \newcommand{\vecd}[1]{\overset{-\!-\!\rightharpoonup}{\vphantom{a}\smash {#1}}} \)
\(\newcommand{\avec}{\mathbf a}\) \(\newcommand{\bvec}{\mathbf b}\) \(\newcommand{\cvec}{\mathbf c}\) \(\newcommand{\dvec}{\mathbf d}\) \(\newcommand{\dtil}{\widetilde{\mathbf d}}\) \(\newcommand{\evec}{\mathbf e}\) \(\newcommand{\fvec}{\mathbf f}\) \(\newcommand{\nvec}{\mathbf n}\) \(\newcommand{\pvec}{\mathbf p}\) \(\newcommand{\qvec}{\mathbf q}\) \(\newcommand{\svec}{\mathbf s}\) \(\newcommand{\tvec}{\mathbf t}\) \(\newcommand{\uvec}{\mathbf u}\) \(\newcommand{\vvec}{\mathbf v}\) \(\newcommand{\wvec}{\mathbf w}\) \(\newcommand{\xvec}{\mathbf x}\) \(\newcommand{\yvec}{\mathbf y}\) \(\newcommand{\zvec}{\mathbf z}\) \(\newcommand{\rvec}{\mathbf r}\) \(\newcommand{\mvec}{\mathbf m}\) \(\newcommand{\zerovec}{\mathbf 0}\) \(\newcommand{\onevec}{\mathbf 1}\) \(\newcommand{\real}{\mathbb R}\) \(\newcommand{\twovec}[2]{\left[\begin{array}{r}#1 \\ #2 \end{array}\right]}\) \(\newcommand{\ctwovec}[2]{\left[\begin{array}{c}#1 \\ #2 \end{array}\right]}\) \(\newcommand{\threevec}[3]{\left[\begin{array}{r}#1 \\ #2 \\ #3 \end{array}\right]}\) \(\newcommand{\cthreevec}[3]{\left[\begin{array}{c}#1 \\ #2 \\ #3 \end{array}\right]}\) \(\newcommand{\fourvec}[4]{\left[\begin{array}{r}#1 \\ #2 \\ #3 \\ #4 \end{array}\right]}\) \(\newcommand{\cfourvec}[4]{\left[\begin{array}{c}#1 \\ #2 \\ #3 \\ #4 \end{array}\right]}\) \(\newcommand{\fivevec}[5]{\left[\begin{array}{r}#1 \\ #2 \\ #3 \\ #4 \\ #5 \\ \end{array}\right]}\) \(\newcommand{\cfivevec}[5]{\left[\begin{array}{c}#1 \\ #2 \\ #3 \\ #4 \\ #5 \\ \end{array}\right]}\) \(\newcommand{\mattwo}[4]{\left[\begin{array}{rr}#1 \amp #2 \\ #3 \amp #4 \\ \end{array}\right]}\) \(\newcommand{\laspan}[1]{\text{Span}\{#1\}}\) \(\newcommand{\bcal}{\cal B}\) \(\newcommand{\ccal}{\cal C}\) \(\newcommand{\scal}{\cal S}\) \(\newcommand{\wcal}{\cal W}\) \(\newcommand{\ecal}{\cal E}\) \(\newcommand{\coords}[2]{\left\{#1\right\}_{#2}}\) \(\newcommand{\gray}[1]{\color{gray}{#1}}\) \(\newcommand{\lgray}[1]{\color{lightgray}{#1}}\) \(\newcommand{\rank}{\operatorname{rank}}\) \(\newcommand{\row}{\text{Row}}\) \(\newcommand{\col}{\text{Col}}\) \(\renewcommand{\row}{\text{Row}}\) \(\newcommand{\nul}{\text{Nul}}\) \(\newcommand{\var}{\text{Var}}\) \(\newcommand{\corr}{\text{corr}}\) \(\newcommand{\len}[1]{\left|#1\right|}\) \(\newcommand{\bbar}{\overline{\bvec}}\) \(\newcommand{\bhat}{\widehat{\bvec}}\) \(\newcommand{\bperp}{\bvec^\perp}\) \(\newcommand{\xhat}{\widehat{\xvec}}\) \(\newcommand{\vhat}{\widehat{\vvec}}\) \(\newcommand{\uhat}{\widehat{\uvec}}\) \(\newcommand{\what}{\widehat{\wvec}}\) \(\newcommand{\Sighat}{\widehat{\Sigma}}\) \(\newcommand{\lt}{<}\) \(\newcommand{\gt}{>}\) \(\newcommand{\amp}{&}\) \(\definecolor{fillinmathshade}{gray}{0.9}\)By the end of this section, you will be able to:
- Verify solutions to an inequality in two variables
- Recognize the relation between the solutions of an inequality and its graph
- Graph linear inequalities
Before you get started, take this readiness quiz.
- Solve: \(4x+3>23.\)
If you missed this problem, review Exercise 2.7.22. - Translate from algebra to English: \(x<5.\)
If you missed this problem, review Exercise 1.3.1. - Evaluate \(3x−2y\) when \(x=1, \, y=−2.\)
If you missed this problem, review Exercise 1.5.28.
Verify Solutions to an Inequality in Two Variables
We have learned how to solve inequalities in one variable. Now, we will look at inequalities in two variables. Inequalities in two variables have many applications. If you ran a business, for example, you would want your revenue to be greater than your costs—so that your business would make a profit.
A linear inequality is an inequality that can be written in one of the following forms:
\[A x+B y>C \quad A x+B y \geq C \quad A x+B y<C \quad A x+B y \leq C \nonumber\]
where \(A\) and \(B\) are not both zero.
Do you remember that an inequality with one variable had many solutions? The solution to the inequality \(x>3\) is any number greater than \(3\). We showed this on the number line by shading in the number line to the right of \(3\), and putting an open parenthesis at \(3\). See Figure \(\PageIndex{1}\).

Similarly, inequalities in two variables have many solutions. Any ordered pair \( (x, y)\) that makes the inequality true when we substitute in the values is a solution of the inequality.
An ordered pair \( (x, y)\) is a solution of a linear inequality if the inequality is true when we substitute the values of \(x\) and \(y\).
Determine whether each ordered pair is a solution to the inequality \(y>x+4\):
- \((0,0)\)
- \((1,6)\)
- \((2,6)\)
- \((−5,−15)\)
- \((−8,12)\)
Solution
1.| \((0,0)\) |  |
|
 |
 |
|
| Simplify. |  So, \((0,0)\) is not a solution to \(y>x+4\). |
|
| \((1,6)\) |  |
|
 |
 |
|
| Simplify. |  So, \((1,6)\) is a solution to \(y>x+4\). |
|
| \((2,6)\) |  |
|
 |
 |
|
| Simplify. |  So, \((2,6)\) is not a solution to \(y>x+4\). |
|
| \((−5,−15)\) |  |
|
 |
 |
|
| Simplify. |  So, \((−5,−15)\) is not a solution to \(y>x+4\). |
|
| (−8,12) |  |
|
 |
 |
|
| Simplify. |  So, \((−8,12)\) is a solution to \(y>x+4\). |
|
Determine whether each ordered pair is a solution to the inequality \(y>x−3\):
- \((0,0)\)
- \((4,9)\)
- \((−2,1)\)
- \((−5,−3)\)
- \((5,1)\)
- Answer
-
- yes
- yes
- yes
- yes
- no
Determine whether each ordered pair is a solution to the inequality \(y<x+1\):
- \((0,0)\)
- \((8,6)\)
- \((−2,−1)\)
- \((3,4)\)
- \((−1,−4)\)
- Answer
-
- yes
- yes
- no
- no
- yes
Recognize the Relation Between the Solutions of an Inequality and its Graph
Now, we will look at how the solutions of an inequality relate to its graph.
Let’s think about the number line in Figure \(\PageIndex{1}\) again. The point \(x=3\) separated that number line into two parts. On one side of \(3\) are all the numbers less than \(3\). On the other side of \(3\) all the numbers are greater than \(3\). See Figure \(\PageIndex{2}\).
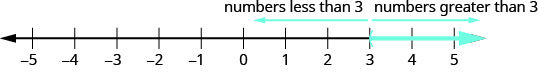
The solution to \(x>3\) is the shaded part of the number line to the right of \(x=3\).
Similarly, the line \(y=x+4\) separates the plane into two regions. On one side of the line are points with \(y<x+4\). On the other side of the line are the points with \(y>x+4\). We call the line \(y=x+4\) a boundary line.
The line with equation \(Ax+By=C\) is the boundary line that separates the region where \(Ax+By>C\) from the region where \(Ax+By<C\).
For an inequality in one variable, the endpoint is shown with a parenthesis or a bracket depending on whether or not aa is included in the solution:
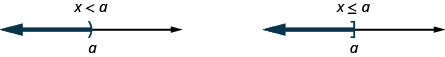
Similarly, for an inequality in two variables, the boundary line is shown with a solid or dashed line to indicate whether or not it the line is included in the solution. This is summarized in Table \(\PageIndex{1}\).
| \(Ax+By<C\) | \(Ax+By\leq C\) |
| \(Ax+By>C\) | \(Ax+By\geq C\) |
| Boundary line is not included in solution. | Boundary line is included in solution. |
| Boundary line is dashed. | Boundary line is solid. |
Now, let’s take a look at what we found in Example \(\PageIndex{1}\). We’ll start by graphing the line \(y=x+4\), and then we’ll plot the five points we tested. See Figure \(\PageIndex{3}\).
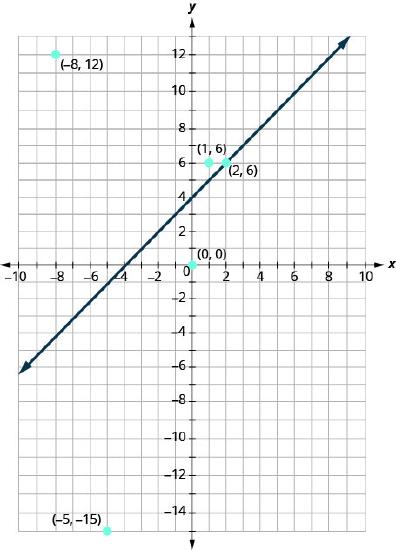
In Example \(\PageIndex{1}\) we found that some of the points were solutions to the inequality \(y>x+4\) and some were not.
Which of the points we plotted are solutions to the inequality \(y>x+4\)? The points \((1,6)\) and \((−8,12)\) are solutions to the inequality \(y>x+4\). Notice that they are both on the same side of the boundary line \(y=x+4\).
The two points \((0,0)\) and \((−5,−15)\) are on the other side of the boundary line \(y=x+4\), and they are not solutions to the inequality \(y>x+4\). For those two points, \(y<x+4\).
What about the point \((2,6)\)? Because \(6=2+4\), the point is a solution to the equation \(y=x+4\). So the point \((2,6)\) is on the boundary line.
Let’s take another point on the left side of the boundary line and test whether or not it is a solution to the inequality \(y>x+4\). The point \((0,10)\) clearly looks to be to the left of the boundary line, doesn’t it? Is it a solution to the inequality?
\[\begin{array}{l}{y>x+4} \\ {10\stackrel{?}{>}0+4} \\ {10>4} &{\text{So, }(0,10)\text{ is a solution to }y>x+4.}\end{array}\]
Any point you choose on the left side of the boundary line is a solution to the inequality \(y>x+4\). All points on the left are solutions.
Similarly, all points on the right side of the boundary line, the side with \((0,0)\) and \((−5,−15)\), are not solutions to \(y>x+4\). See Figure \(\PageIndex{4}\).
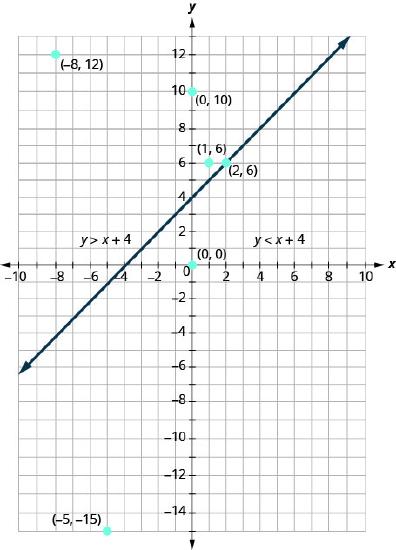
The graph of the inequality \(y>x+4\) is shown in Figure \(\PageIndex{5}\) below. The line \(y=x+4\) divides the plane into two regions. The shaded side shows the solutions to the inequality \(y>x+4\).
The points on the boundary line, those where \(y=x+4\), are not solutions to the inequality \(y>x+4\), so the line itself is not part of the solution. We show that by making the line dashed, not solid.
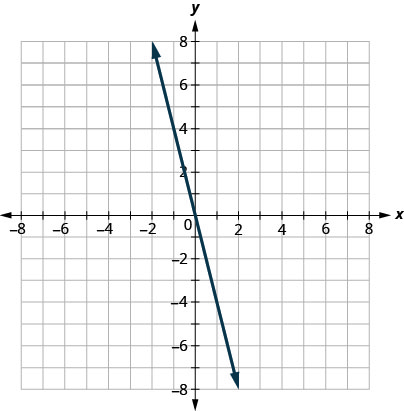
The boundary line shown is \(y=2x−1\). Write the inequality shown by the graph.
Solution
The line \(y=2x−1\) is the boundary line. On one side of the line are the points with \(y>2x−1\) and on the other side of the line are the points with \(y<2x−1\).
Let’s test the point \((0,0)\) and see which inequality describes its side of the boundary line.
At \((0,0)\), which inequality is true:
\[\begin{array}{ll}{y>2 x-1} & {\text { or }} & {y<2 x-1 ?} \\ {y>2 x-1} && {y<2 x-1} \\ {0>2 \cdot 0-1} && {0<2 \cdot 0-1} \\ {0>-1 \text { True }} && {0<-1 \text { False }}\end{array}\]
Since \(y>2x−1\) is true, the side of the line with \((0,0)\), is the solution. The shaded region shows the solution of the inequality \(y>2x−1\).
Since the boundary line is graphed with a solid line, the inequality includes the equal sign.
The graph shows the inequality \(y\geq 2x−1\).
We could use any point as a test point, provided it is not on the line. Why did we choose \((0,0)\)? Because it’s the easiest to evaluate. You may want to pick a point on the other side of the boundary line and check that \(y<2x−1\).
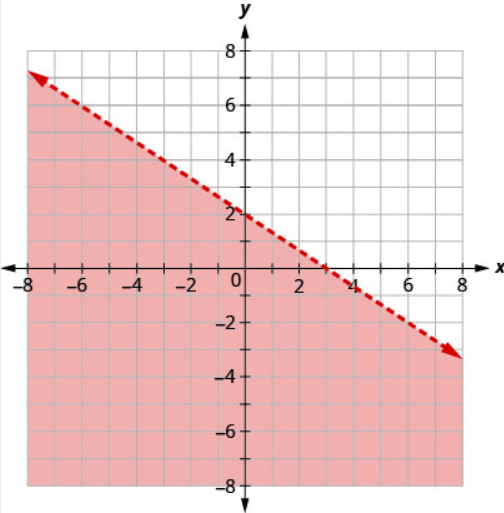
Write the inequality shown by the graph with the boundary line \(y=−2x+3\).
- Answer
-
\(y\geq −2x+3\)
Write the inequality shown by the graph with the boundary line \(y=\frac{1}{2}x−4\).
- Answer
-
\(y \leq \frac{1}{2}x - 4\)
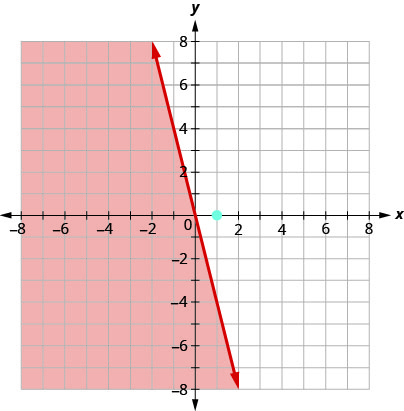
The boundary line shown is \(2x+3y=6\). Write the inequality shown by the graph.
Solution
The line \(2x+3y=6\) is the boundary line. On one side of the line are the points with \(2x+3y>6\) and on the other side of the line are the points with \(2x+3y<6\).
Let’s test the point \((0,0)\) and see which inequality describes its side of the boundary line.
At \((0,0)\), which inequality is true:
\[\begin{array}{rr}{2 x+3 y>6} && {\text { or } \quad 2 x+3 y<6 ?} \\ {2 x+3 y>6} && {2 x+3 y<6} \\ {2(0)+3(0)>6} & & {2(0)+3(0)<6} \\ {0} >6 & {\text { False }} & {0<6}&{ \text { True }}\end{array}\]
So the side with \((0,0)\) is the side where \(2x+3y<6\).
(You may want to pick a point on the other side of the boundary line and check that \(2x+3y>6\).)
Since the boundary line is graphed as a dashed line, the inequality does not include an equal sign.
The graph shows the solution to the inequality \(2x+3y<6\).
Write the inequality shown by the shaded region in the graph with the boundary line \(x−4y=8\).
- Answer
-
\(x-4 y \leq 8\)
Write the inequality shown by the shaded region in the graph with the boundary line \(3x−y=6\).
- Answer
-
\(3 x-y \leq 6\)
Graph Linear Inequalities
Now, we’re ready to put all this together to graph linear inequalities.
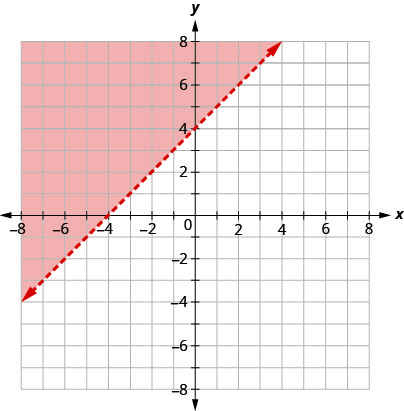
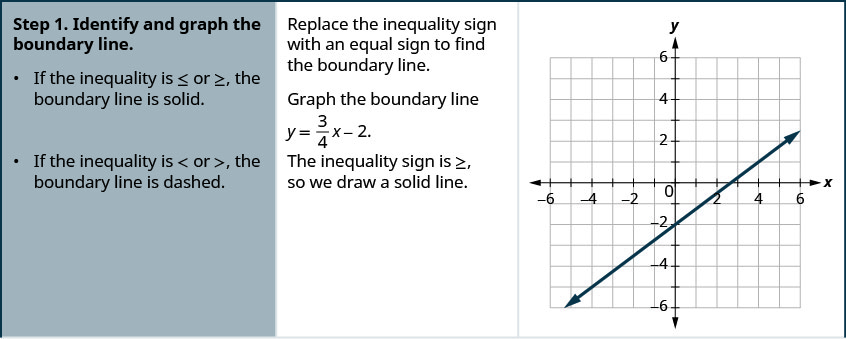
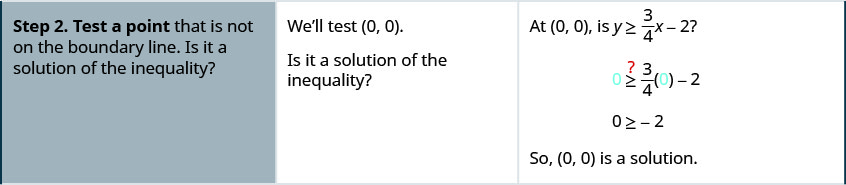
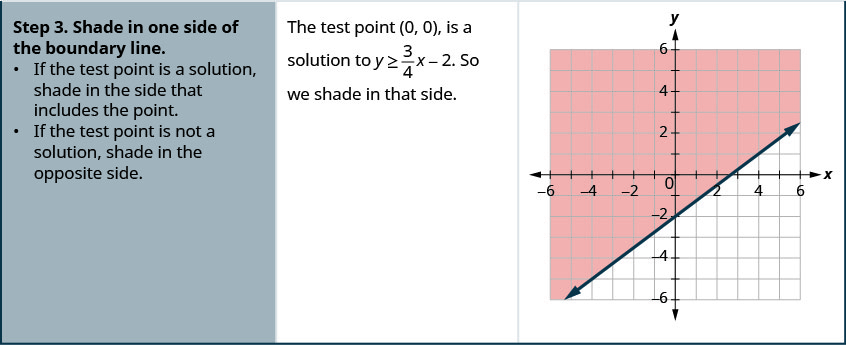
Graph the linear inequality \(y \geq \frac{3}{4} x-2\).
Solution
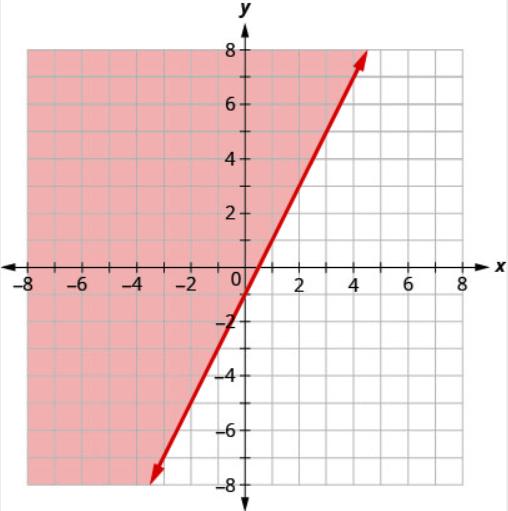
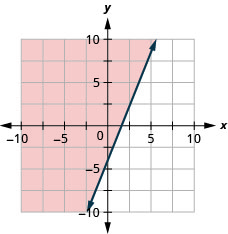
Graph the linear inequality \(y \geq \frac{5}{2} x-4\).
- Answer
-
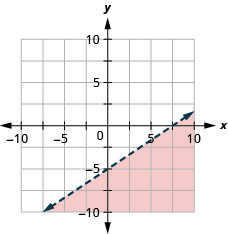
Graph the linear inequality \(y<\frac{2}{3} x-5\).
- Answer
-
The steps we take to graph a linear inequality are summarized here.
- Identify and graph the boundary line.
- If the inequality is \(≤\) or \(≥\), the boundary line is solid.
- If the inequality is \(<\) or \(>\), the boundary line is dashed.
- Test a point that is not on the boundary line. Is it a solution of the inequality?
- Shade in one side of the boundary line.
- If the test point is a solution, shade in the side that includes the point.
- If the test point is not a solution, shade in the opposite side.
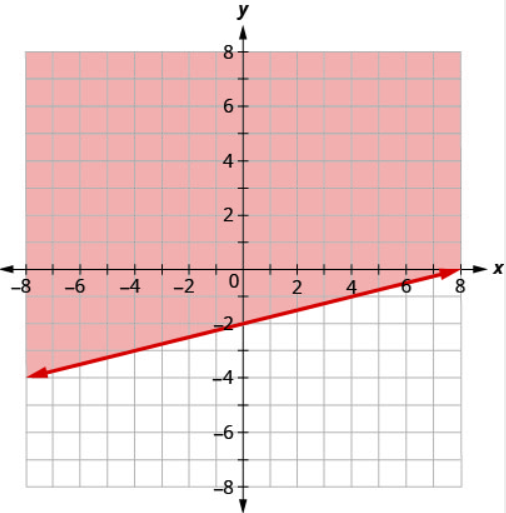
Graph the linear inequality \(x−2y<5\).
Solution
First we graph the boundary line \(x−2y=5\). The inequality is \(<\) so we draw a dashed line.
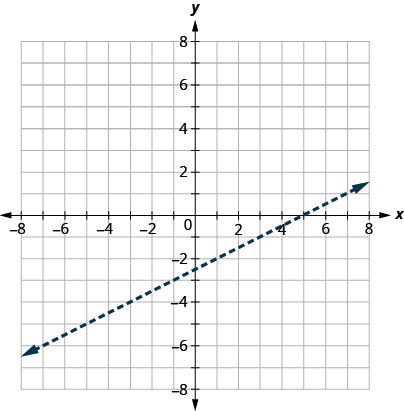
Then we test a point. We’ll use \((0,0)\) again because it is easy to evaluate and it is not on the boundary line.
Is \((0,0)\) a solution of \(x−2y<5\)?
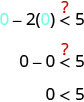
The point \((0,0)\) is a solution of \(x−2y<5\), so we shade in that side of the boundary line.
Graph the linear inequality \(2x−3y\leq 6\).
- Answer
-
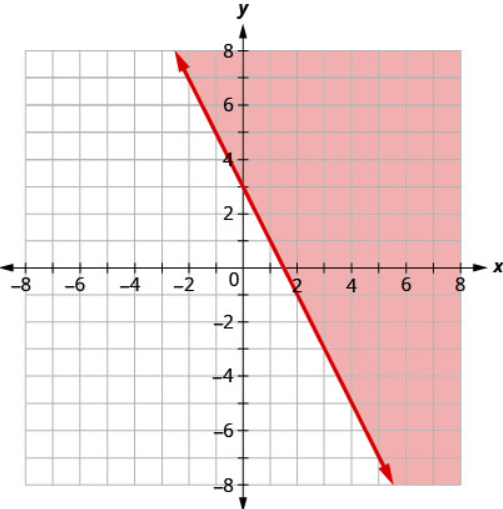
Graph the linear inequality \(2x−y>3\).
- Answer
-
What if the boundary line goes through the origin? Then we won’t be able to use \((0,0)\) as a test point. No problem—we’ll just choose some other point that is not on the boundary line.
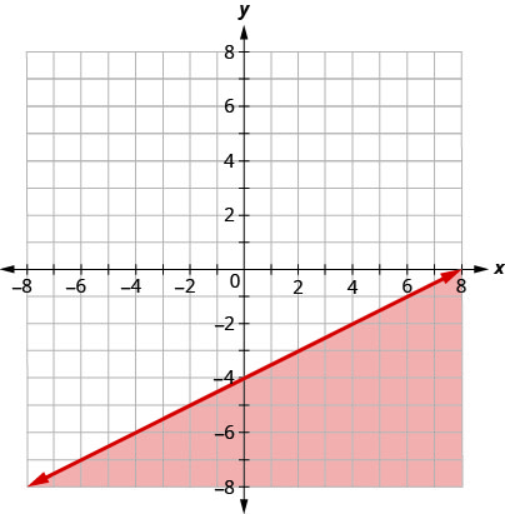
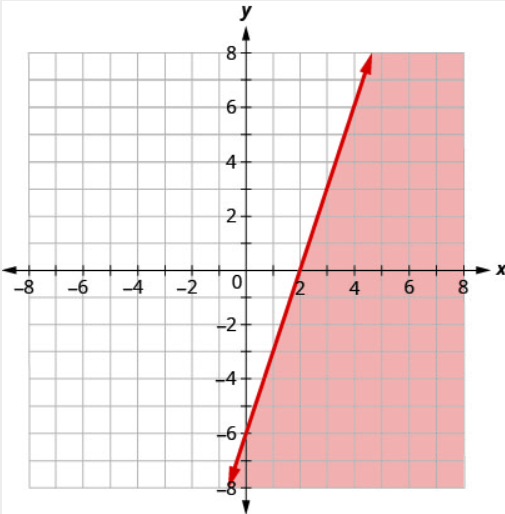
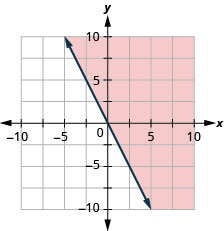
Graph the linear inequality \(y\leq −4x\).
Solution
First we graph the boundary line \(y=−4x\). It is in slope–intercept form, with \(m=−4\) and \(b=0\). The inequality is \(≤\) so we draw a solid line.
Now, we need a test point. We can see that the point \((1,0)\) is not on the boundary line.
Is \((1,0)\) a solution of \(y≤−4x\)?

The point \((1,0)\) is not a solution to \(y≤−4x\), so we shade in the opposite side of the boundary line. See Figure \(\PageIndex{6}\).
Graph the linear inequality \(y>−3x\).
- Answer
-
Graph the linear inequality \(y\geq −2x\).
- Answer
-
Some linear inequalities have only one variable. They may have an \(x\) but no \(y\), or a \(y\) but no \(x\). In these cases, the boundary line will be either a vertical or a horizontal line. Do you remember?
\(\begin{array}{ll}{x=a} & {\text { vertical line }} \\ {y=b} & {\text { horizontal line }}\end{array}\)
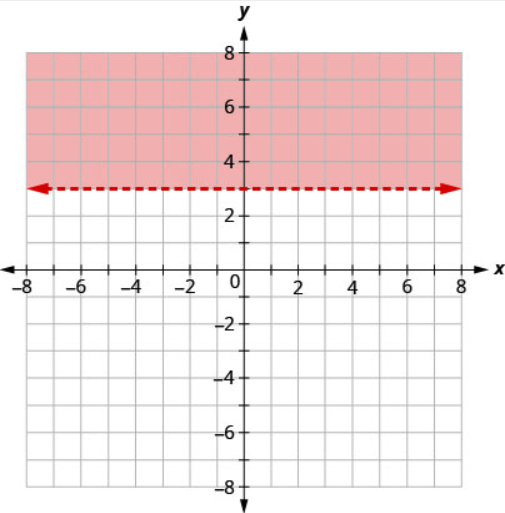
Graph the linear inequality \(y>3\).
Solution
First we graph the boundary line \(y=3\). It is a horizontal line. The inequality is \(>\) so we draw a dashed line.
We test the point \((0,0)\).
\[y>3 \\ 0\not>3\]
\((0,0)\) is not a solution to \(y>3\).
So we shade the side that does not include \((0,0)\).
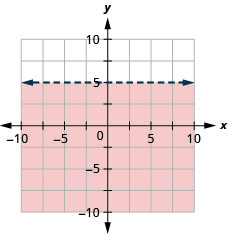
Graph the linear inequality \(y<5\).
- Answer
-
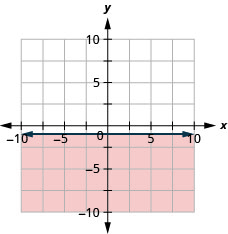
Graph the linear inequality \(y \leq-1\).
- Answer
-
Key Concepts
- To Graph a Linear Inequality
- Identify and graph the boundary line.
If the inequality is \(≤\) or \(≥\), the boundary line is solid.
If the inequality is \(<\) or \(>\), the boundary line is dashed. - Test a point that is not on the boundary line. Is it a solution of the inequality?
- Shade in one side of the boundary line.
If the test point is a solution, shade in the side that includes the point.
If the test point is not a solution, shade in the opposite side.
- Identify and graph the boundary line.
Glossary
- boundary line
- The line with equation \(A x+B y=C\) that separates the region where \(A x+B y>C\) from the region where \(A x+B y<C\).
- linear inequality
- An inequality that can be written in one of the following forms:
\[A x+B y>C \quad A x+B y \geq C \quad A x+B y<C \quad A x+B y \leq C\]
where \(A\) and \(B\) are not both zero.
- solution of a linear inequality
- An ordered pair \((x,\,y)\) is a solution to a linear inequality the inequality is true when we substitute the values of \(x\) and \(y\).