
1.28: Graphing Linear Equations
- Page ID
- 48446
In general, a linear equation in two variables is of the form
\[A x+B y=C\nonumber\]
in which \(A, B, C\) are real numbers and \(A\) and \(B\) cannot both be \(0 .\) This is called the standard form of a linear equation. Here are a few examples of linear equations in standard form:
\[3 x+2 y=4, \quad-0.25 x+\frac{2}{3} y=1, \quad-3 x=2, \quad 4 y=3\nonumber\]
Some linear equations are not written in standard form, but they can be easily transformed to a standard form. For example, the linear equation \(y=\) \(-2 x-3\) can be written in a standard form of \(2 x+y=-3\) by adding \(2 x\) to both sides of the equation.
The graph of a linear equation is a straight line in the rectangular coordinate system. In the last chapter, we learned how to plot a straight line by plotting some points of a given linear equation. In this chapter, we will learn some important concepts of linear equations and use them to plot straight lines.
Graphing Linear Equations Using Intercepts
On the graph of a straight line in the rectangular coordinate system, there are two special points, the \(x\) -intercept and the \(y\) -intercept.
From geometry, we know that a straight line is fully determined by two points. Therefore, after identifying the intercepts of a given linear equation, we can plot its graph by using these two points. It is a good practice to find a third point. If the third point doesn’t lie on the straight line determined by the intercepts, this indicates that we may have made an error in our calculations.
The \(x\) -intercept
The \(x\) -intercept is the point where the graph intersects the \(x\) -axis.
To find the \(x\) -intercept, evaluate the equation at \(y=0\).
The \(x\) -intercept will look like \((x\) -intercept \(, 0)\).
The \(y\) -intercept
The \(y\) -intercept is the point where the graph intersects \(y\) -axis.
To find the \(y\) -intercept, evaluate the equation at \(x=0\).
The \(y\) -intercept will look like \((0, y\) -intercept \()\).
Example 26.1
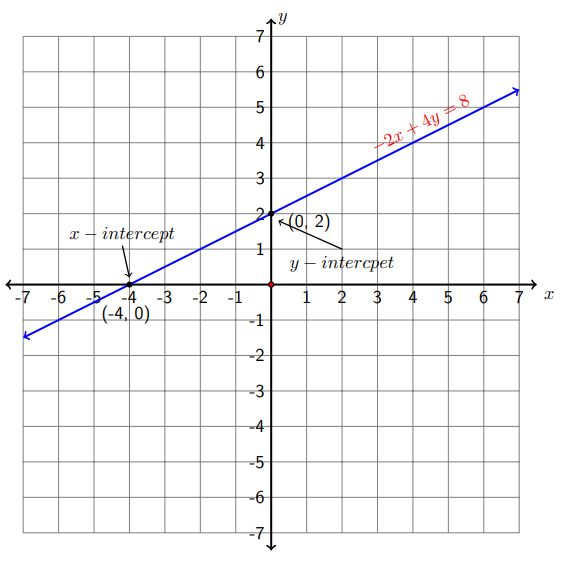
Find the intercepts of \(−2x + 4y = 8\) and use them to graph the linear equation.
\[\text { Let } y=0 \quad \Rightarrow \quad-2 x+4(0)=8 \quad \Rightarrow \quad-2 x=8 \quad \Longrightarrow \quad x=-4\nonumber\]
Therefore, the \(x-\) intercept is (-4,0).
\[\text { Let } x=0 \quad \Longrightarrow \quad-2(0)+4 y=8 \quad \Longrightarrow \quad 4 y=8 \quad \Rightarrow \quad y=2\nonumber\]
Therefore, the \(y-\) intercept is (0,2)
Example 26.2
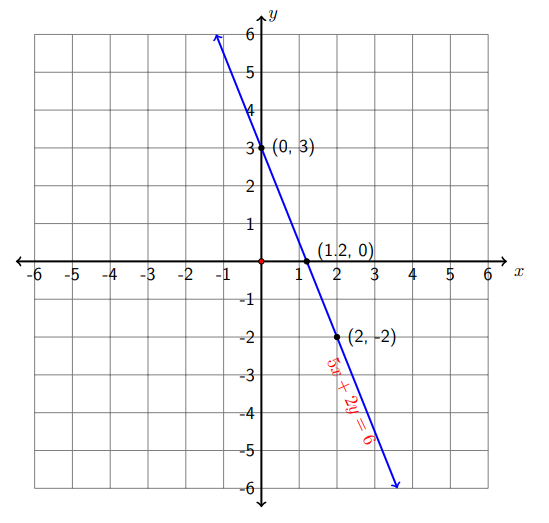
Find the intercepts of \(5x + 2y = 6\) and use them to graph the equation. We first find the two intercepts (and then find a third point).
\[\text { Let } y=0 \quad \Longrightarrow \quad 5 x+2(0)=6 \quad \Longrightarrow \quad 5 x=6 \quad \Longrightarrow \quad x=\frac{6}{5}=1.2\nonumber\]
\[\text { Let } x=0 \quad \Longrightarrow \quad 5(0)+2 y=6 \quad \Rightarrow \quad 2 y=6 \quad \Rightarrow \quad y=3\nonumber\]
\[\text { Let } x=2 \quad \Longrightarrow \quad 5(2)+2 y=6 \quad \Rightarrow \quad 10+2 y=6 \quad \Rightarrow \quad y=-2\nonumber\]
Now we have three solution pairs: (1.2,0),(0,3) and \((2,-2) .\) The following figure is the graph of the equation \(5 x+2 y=6\).
The Slope of a Line
Different straight lines have different steepness. Mathematically, there is a number that can measure the steepness of a given line. This number is called the slope of a line, and is denoted by the letter \(m\). The following figure helps us to determine the formula for calculating the slope \(m\).
In the figure below, \(P\) and \(Q\) are two arbitrary points on the given line. Point \(P\) has the coordinates \(\left(x_{1}, y_{1}\right),\) and point \(Q\) has the coordinates \(\left(x_{2}, y_{2}\right) .\) Here we use subscripts to distinguish coordinates for different points. The slope \(m\) is defined as the ratio of the change of the two points in the \(y\) direction to the change of the two points in the \(x\) direction.
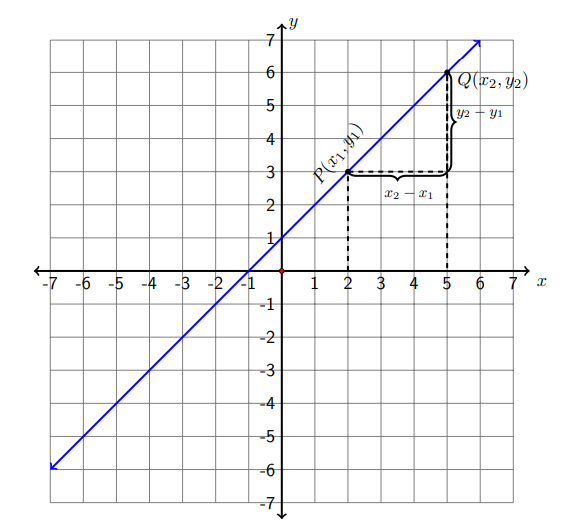
since the \(y\) direction is vertical, the change in \(y\) coordinates referred to as the "rise." Similarly, the \(x\) direction is horizontal so the change in \(x\) coordinates is referred to as the "run." So another way of remembering the formula for finding the slope is to remember that it is the "rise over run."
The Slope of a Line
The slope of a line passing through \(\left(x_{1}, y_{1}\right)\) and \(\left(x_{2}, y_{2}\right)\) is
\[m=\frac{y_{2}-y_{1}}{x_{2}-x_{1}}=\frac{\text { rise }}{\text { run }}\nonumber\]
Example 26.3
Find the slope of the line passing through the following points and use the given points to graph the line.
a) (1,2) and (3,3)
We choose \(\left(x_{1}, y_{1}\right)=(1,2)\) and \(\left(x_{2}, y_{2}\right)=(3,3) .\) Actually it doesn't matter which point we assign as the first and the second point. We will always get the same slope.
\[m=\frac{y_{2}-y_{1}}{x_{2}-x_{1}}=\frac{3-2}{3-1}=\frac{1}{2}\nonumber\]
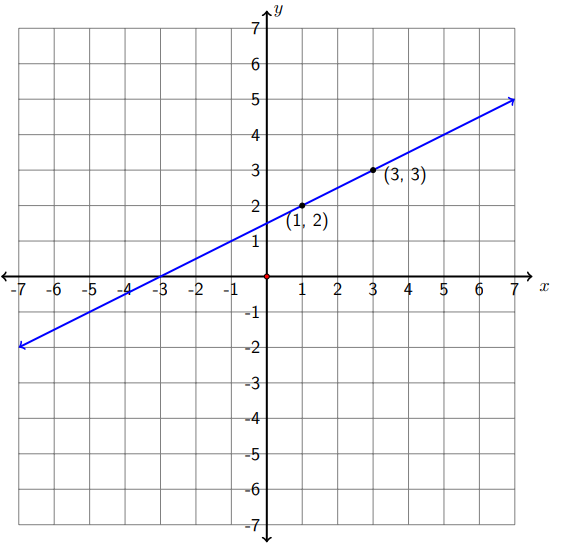
The slope is positive. The graph shows it is a rising line from left to right.
b) (-2,4) and (2,-4)
Let \(\left(x_{1}, y_{1}\right)=(-2,4)\) and \(\left(x_{2}, y_{2}\right)=(2,-4) .\) Then
\[m=\frac{y_{2}-y_{1}}{x_{2}-x_{1}}=\frac{-4-4}{2-(-2)}=\frac{-8}{4}=-2\nonumber\]
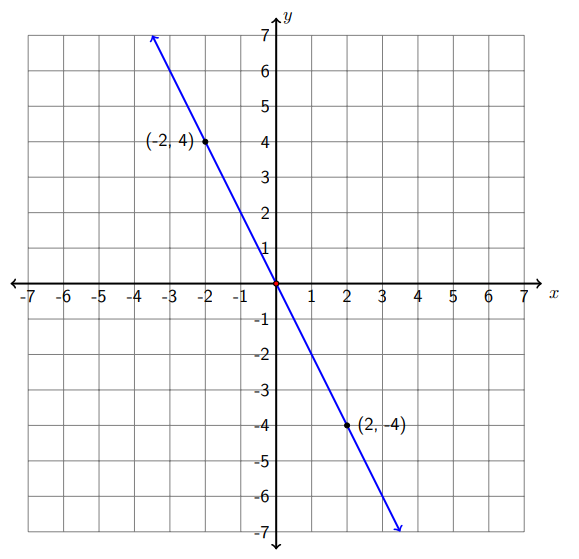
The slope is negative. The graph shows it is a falling line from left to right, and this line is steeper than the line in part a).
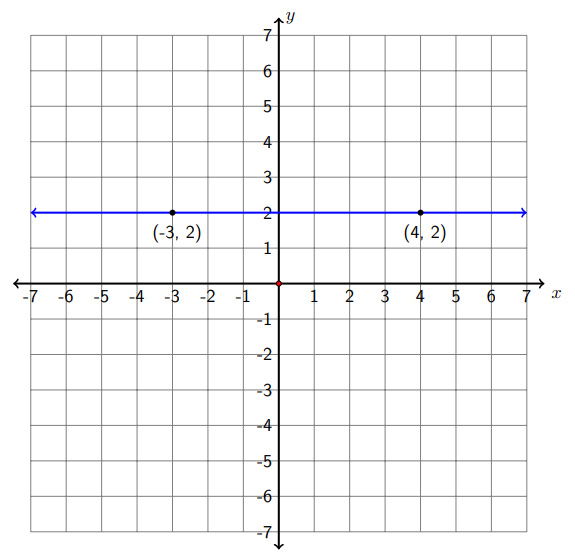
c) (-3,2) and (4,2)
Let \(\left(x_{1}, y_{1}\right)=(-3,2)\) and \(\left(x_{2}, y_{2}\right)=(4,2) .\) Then
\[m=\frac{y_{2}-y_{1}}{x_{2}-x_{1}}=\frac{2-2}{4-(-3)}=\frac{0}{7}=0\nonumber\]
The slope is 0. The graph shows it is a horizontal line.
Note: All horizontal lines are characterized by points that have the same y value, so they all have a slope 0.
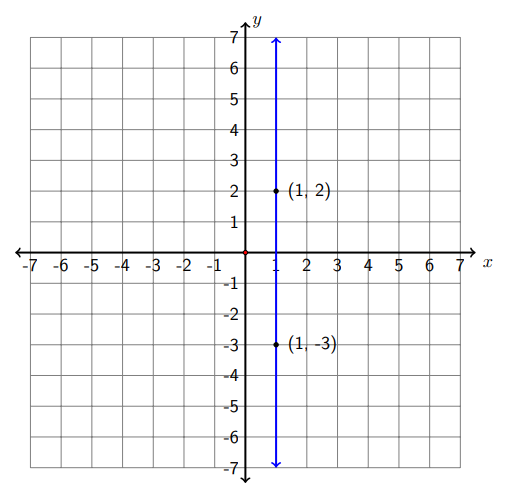
d) (1,2) and (1,-3)
Let \(\left(x_{1}, y_{1}\right)=(1,2)\) and \(\left(x_{2}, y_{2}\right)=(1,-3) .\) Then
\[m=\frac{y_{2}-y_{1}}{x_{2}-x_{1}}=\frac{-3-2}{1-1}=\frac{-5}{0}=\text { undefined }\nonumber\]
The slope is undefined. The graph shows it is a vertical line.
Note: All vertical lines are characterized by points that have the same \(x\) value, so they all have an undefined slope.
Properties of the Slope
- If the slope is positive, the line goes upward from left to right.
- If the slope is negative, the lines goes downward from left to right.
- If the slope is \(0,\) the line is horizontal, that is, there is no rise in the \(y\) direction.
- If the slope is undefined, the line is vertical, that is, there is no run in the \(x\) direction.
- The larger the absolute value of the slope, the steeper the straight line.
Slope-Intercept Form of the Equation of a Line \(\bf{y=m x+b}\)
In the previous section, learned that to find the slope of a line, we need two points on the line. Given an equation of a line, we can easily find two points on the line by finding two solution pairs of the equation. However, there is another way to identify the slope.
Let's find the slope of the line given by the equation: \(2 x-3 y=4\). We can choose any two points on the line, so let's choose to work with the \(x\) and \(y\) -intercepts.
\[\text { Let } x=0 \quad \Longrightarrow \quad 2(0)-3 y=4 \quad \Longrightarrow \quad-3 y=4 \quad \Longrightarrow \quad y=-\frac{4}{3}\nonumber\]
\[\text { Let } y=0 \quad \Longrightarrow \quad 2 x-3(0)=4 \quad \Longrightarrow \quad 2 x=4 \quad \Longrightarrow \quad x=2\nonumber\]
Therefore the intercepts are: \(\left(0,-\frac{4}{3}\right)\) and (2,0) and so the slope is :
\[m=\frac{0-\left(-\frac{4}{3}\right)}{2-0}=\frac{\frac{4}{3}}{2}=\frac{4}{3} \cdot \frac{1}{2}=\frac{2}{3}\nonumber\]
Suppose we return to our original equation and solve it for \(y:\)
\[\begin{align*}
2 x-3 y=4 & \Longrightarrow-3 y=-2 x+4 \\
& \Longrightarrow y=\frac{-2 x+4}{-3} \\
& \Longrightarrow y=\frac{2}{3} x-\frac{4}{3}
\end{align*}\nonumber\]
Rewriting the equation in this way helps us to identify two numerical values \(\frac{2}{3}\) and \(-\frac{4}{3}\). The first value is exactly the same as the slope and the second is exactly the same as the \(y\) -intercept! This is true in general. If the equation of a line is written in the form \(y=m x+b,\) then the coefficient of the \(x\) term is the slope of the line and the constant term is the \(y\) -coordinate of the \(y-\) intercept (so we write \((0, b))\).
The slope-intercept form of the equation of a line
\(y=m x+b\)
is called the slope-intercept form of the equation of a line with slope \(m\) and \(y\) -interecpt \((0, b)\).
Example 26.4
Find the slope and \(y-\) intercept of the line by rewriting the line equation \(x+4 y=8\) in the slope-intercept form.
\[\begin{align*}
x+4 y=8 & \Longrightarrow 4 y=-x+8 \\
& \Longrightarrow y=\frac{-x+8}{4} \\
& \Longrightarrow y=-\frac{1}{4} x+2
\end{align*}\nonumber\]
The slope is \(-\frac{1}{4}\) and the \(y\) -intercept is (0,2) . Reminder: The slope is a numerical value. Don't let the \(x\) variable tag along when you write it down!
Graphing Linear Equations Using the Slope and the \(\bf{y}\) intercept
Using the \(y\) -intercept and the slope of a line, we can easily sketch the graph of a straight line. Remember that we only need two points to graph a line. We use the \(y\) -intercept as the first point, then we use the slope and the \(y\) -intercept to get another point.
Example 26.5
Graph the given linear equation by using the slope and the \(y\) -intercept:
a) \(y=\frac{4}{3} x-2\)
Step 1 Write the linear equation in the slope-intercept form. In this problem the equation given is already in \(y=m x+b\) form, so we can identify that the slope is \(m=\frac{4}{3}\) and the \(y-\) intercept is (0,-2).
Step 2 Plot the \(y-\) intercept (0,-2) on the \(y-\) axis of the coordinate system.
Step 3 Use the slope \(m=\frac{4}{3}=\frac{\text { rise }}{\text { run }}\) to locate the second point, that is, from the \(y\) -intercept we move to the right (run) three units and up (rise) 4 units to plot a second point at (3,2).
Step 4 Draw a line passing though the two points.

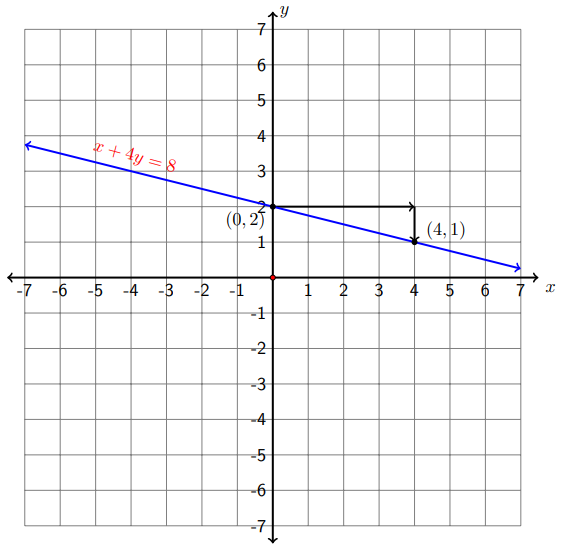
b) \(x+4 y=8\)
Step 1 Write the linear equation in the slope-intercept form. (Refer to Example 26.4 to see how this is done):
\[x+4 y=8 \quad \Longrightarrow \quad y=-\frac{1}{4} x+2\nonumber\]
Step 2 Plot the \(y\) -intercept (0,2) on the \(y\) -axis of the coordinate system.
Step 3 Using the slope \(m=-\frac{1}{4}=\frac{-1}{4}=\frac{\text { rise }}{\text { run }}\) to locate the second point, that is, from the \(y\) -intercept we move to the right (run) four units and down (rise) one unit (because the change in \(y\) is negative, we move down) and plot a second point at \((4,1)\).
Here we chose to put the negative sign in the numerator, but we could have easily assigned the negative sign to the denominator. This can be done because
\[-\frac{1}{4}=\frac{-1}{4}=\frac{1}{-4}\nonumber\]
If we decided to work with the slope written as \(m=\frac{1}{-4},\) from the \(y\) -intercept (0,2) we would move four units left (run) and one unit \(u p\) (rise). This would land us at the point \((-4,3)\).
Step 4 Draw a line passing though the two points. Whichever two points we end up working with either \((0,2)\) and \((4,1)\) or \((0,2)\) and \((-4,3)-\) we get the same line, try it! The figure below shows the line as drawn from the points \((0,2)\) and \((4,1)\).
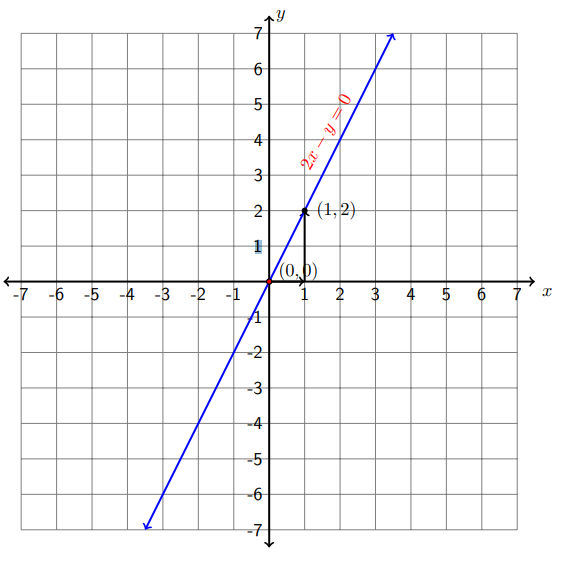
c) \(2 x-y=0\)
Step 1 Write the linear equation in the slope-intercept form.
\[2 x-y=0 \quad \Longrightarrow \quad-y=-2 x \quad \Longrightarrow \quad y=2 x\nonumber\]
Here the slope is 2 and the \(y-\) intercept is \((0,0)\).
Step 2 Plot the \(y\) -intercept (0,0) on the \(y\) -axis, which is the origin of the coordinate system.
Step 3 Using the slope \(m=2=\frac{2}{1}=\frac{\text { rise }}{\text { run }}\) to locate the second point, that is, from the \(y\) -intercept we move to the right (run) one unit and up (rise) two units, plot a second point at \((1,2)\).
Step 4 Draw a line passing through the two points.
Point-Slope Form of the Equation of a Line \(y-y_{0}=m\left(x-x_{0}\right)\)
Suppose we are given only the slope of a line and one point on the line and are asked to find its equation. Even though we do not know the \(y\) -intercept offhand, we can still find the equation of the line by using what's called the point-slope formula (or form).
The point-slope form of the equation of a line
\[y-y_{0}=m\left(x-x_{0}\right)\nonumber\]
is called the point-slope form of the equation of a line of slope \(m\) passing through the point \(\left(x_{0}, y_{0}\right)\).
Example 26.6
Find the equation of the line passing through the point (1,-2) with slope \(\frac{1}{5}\).
We use the point-slope formula here, with \(m=\frac{1}{5}, x_{0}=1\) and \(y_{0}=-2\) So, the equation of the line will be given by \(y-(-2)=\frac{1}{5}(x-1)\) \(y+2=\frac{1}{5} x-\frac{1}{5},\) so \(y=\frac{1}{5} x-\frac{1}{5}-2,\) and
\[y=\frac{1}{5} x-\frac{11}{5}\nonumber\]
Note: The equation \(y=\frac{1}{5} x-\frac{11}{5}\) is written in the slope-intercept form, therefore we can read off the \(y\) -intercept if we wish: \(\left(0,-\frac{11}{5}\right)\).
Example 26.7
Find the equation of the line passing through the points \((3,2)\) and \((-4,3)\).
Notice that here we are not given the slope. We need to find it before we can proceed to find the equation of the line.
The slope is \(m=\frac{3-2}{-4-3}=-\frac{1}{7}\).
Now, we can choose any of the given points as our one point and use the point-slope form to find the equation of the line. Let's use \((3,2)\).
So, with \(m=-\frac{1}{7}, x_{0}=3\) and \(y_{0}=2,\) the equation of the line will be given by
\[y-2=-\frac{1}{7}(x-3)\nonumber\]
\[y-2=-\frac{1}{7} x+\frac{3}{7}=-\frac{1}{7} x+\frac{3}{7}+2\nonumber\]
and, finally,
\[y=-\frac{1}{7} x+\frac{17}{7}\nonumber\]
Note: Again, if we wish to read off the \(y-\) intercept, it is \(\left(0, \frac{17}{7}\right)\).
Equations of Horizontal and Vertical Lines
Recall that all horizontal lines have slope \(0 .\)
Equation of a Horizontal Line
The equation of a horizontal line passing through the point \((a, b) \text { is } y=b\)
Recall that all vertical lines have an undefined slope.
Equation of a Vertical Line
The equation of a vertical line passing through the point \((a, b) \text { is } x=a\)
Example 26.8
a) The equation of the horizontal line passing through the point (3,-7) is \(y=-7\).
b) The equation of the vertical line passing through the point \(\left(\frac{2}{5},-1\right)\) is \(x=\frac{2}{5}\).
c) The equation of the horizontal line passing through the point (4,0) is \(y=0\).
d) The equation of the vertical line passing through the point \(\left(-\frac{1}{2}, 0\right)\) is \(x=\) \(-\frac{1}{2}\).
Exit Problem
Indicate the slope and the \(y\) -intercept, and graph the equation: \(6 x+4 y=6\)