
3.2: Graph by Plotting Points
- Page ID
- 18341
\( \newcommand{\vecs}[1]{\overset { \scriptstyle \rightharpoonup} {\mathbf{#1}} } \)
\( \newcommand{\vecd}[1]{\overset{-\!-\!\rightharpoonup}{\vphantom{a}\smash {#1}}} \)
\( \newcommand{\dsum}{\displaystyle\sum\limits} \)
\( \newcommand{\dint}{\displaystyle\int\limits} \)
\( \newcommand{\dlim}{\displaystyle\lim\limits} \)
\( \newcommand{\id}{\mathrm{id}}\) \( \newcommand{\Span}{\mathrm{span}}\)
( \newcommand{\kernel}{\mathrm{null}\,}\) \( \newcommand{\range}{\mathrm{range}\,}\)
\( \newcommand{\RealPart}{\mathrm{Re}}\) \( \newcommand{\ImaginaryPart}{\mathrm{Im}}\)
\( \newcommand{\Argument}{\mathrm{Arg}}\) \( \newcommand{\norm}[1]{\| #1 \|}\)
\( \newcommand{\inner}[2]{\langle #1, #2 \rangle}\)
\( \newcommand{\Span}{\mathrm{span}}\)
\( \newcommand{\id}{\mathrm{id}}\)
\( \newcommand{\Span}{\mathrm{span}}\)
\( \newcommand{\kernel}{\mathrm{null}\,}\)
\( \newcommand{\range}{\mathrm{range}\,}\)
\( \newcommand{\RealPart}{\mathrm{Re}}\)
\( \newcommand{\ImaginaryPart}{\mathrm{Im}}\)
\( \newcommand{\Argument}{\mathrm{Arg}}\)
\( \newcommand{\norm}[1]{\| #1 \|}\)
\( \newcommand{\inner}[2]{\langle #1, #2 \rangle}\)
\( \newcommand{\Span}{\mathrm{span}}\) \( \newcommand{\AA}{\unicode[.8,0]{x212B}}\)
\( \newcommand{\vectorA}[1]{\vec{#1}} % arrow\)
\( \newcommand{\vectorAt}[1]{\vec{\text{#1}}} % arrow\)
\( \newcommand{\vectorB}[1]{\overset { \scriptstyle \rightharpoonup} {\mathbf{#1}} } \)
\( \newcommand{\vectorC}[1]{\textbf{#1}} \)
\( \newcommand{\vectorD}[1]{\overrightarrow{#1}} \)
\( \newcommand{\vectorDt}[1]{\overrightarrow{\text{#1}}} \)
\( \newcommand{\vectE}[1]{\overset{-\!-\!\rightharpoonup}{\vphantom{a}\smash{\mathbf {#1}}}} \)
\( \newcommand{\vecs}[1]{\overset { \scriptstyle \rightharpoonup} {\mathbf{#1}} } \)
\(\newcommand{\longvect}{\overrightarrow}\)
\( \newcommand{\vecd}[1]{\overset{-\!-\!\rightharpoonup}{\vphantom{a}\smash {#1}}} \)
\(\newcommand{\avec}{\mathbf a}\) \(\newcommand{\bvec}{\mathbf b}\) \(\newcommand{\cvec}{\mathbf c}\) \(\newcommand{\dvec}{\mathbf d}\) \(\newcommand{\dtil}{\widetilde{\mathbf d}}\) \(\newcommand{\evec}{\mathbf e}\) \(\newcommand{\fvec}{\mathbf f}\) \(\newcommand{\nvec}{\mathbf n}\) \(\newcommand{\pvec}{\mathbf p}\) \(\newcommand{\qvec}{\mathbf q}\) \(\newcommand{\svec}{\mathbf s}\) \(\newcommand{\tvec}{\mathbf t}\) \(\newcommand{\uvec}{\mathbf u}\) \(\newcommand{\vvec}{\mathbf v}\) \(\newcommand{\wvec}{\mathbf w}\) \(\newcommand{\xvec}{\mathbf x}\) \(\newcommand{\yvec}{\mathbf y}\) \(\newcommand{\zvec}{\mathbf z}\) \(\newcommand{\rvec}{\mathbf r}\) \(\newcommand{\mvec}{\mathbf m}\) \(\newcommand{\zerovec}{\mathbf 0}\) \(\newcommand{\onevec}{\mathbf 1}\) \(\newcommand{\real}{\mathbb R}\) \(\newcommand{\twovec}[2]{\left[\begin{array}{r}#1 \\ #2 \end{array}\right]}\) \(\newcommand{\ctwovec}[2]{\left[\begin{array}{c}#1 \\ #2 \end{array}\right]}\) \(\newcommand{\threevec}[3]{\left[\begin{array}{r}#1 \\ #2 \\ #3 \end{array}\right]}\) \(\newcommand{\cthreevec}[3]{\left[\begin{array}{c}#1 \\ #2 \\ #3 \end{array}\right]}\) \(\newcommand{\fourvec}[4]{\left[\begin{array}{r}#1 \\ #2 \\ #3 \\ #4 \end{array}\right]}\) \(\newcommand{\cfourvec}[4]{\left[\begin{array}{c}#1 \\ #2 \\ #3 \\ #4 \end{array}\right]}\) \(\newcommand{\fivevec}[5]{\left[\begin{array}{r}#1 \\ #2 \\ #3 \\ #4 \\ #5 \\ \end{array}\right]}\) \(\newcommand{\cfivevec}[5]{\left[\begin{array}{c}#1 \\ #2 \\ #3 \\ #4 \\ #5 \\ \end{array}\right]}\) \(\newcommand{\mattwo}[4]{\left[\begin{array}{rr}#1 \amp #2 \\ #3 \amp #4 \\ \end{array}\right]}\) \(\newcommand{\laspan}[1]{\text{Span}\{#1\}}\) \(\newcommand{\bcal}{\cal B}\) \(\newcommand{\ccal}{\cal C}\) \(\newcommand{\scal}{\cal S}\) \(\newcommand{\wcal}{\cal W}\) \(\newcommand{\ecal}{\cal E}\) \(\newcommand{\coords}[2]{\left\{#1\right\}_{#2}}\) \(\newcommand{\gray}[1]{\color{gray}{#1}}\) \(\newcommand{\lgray}[1]{\color{lightgray}{#1}}\) \(\newcommand{\rank}{\operatorname{rank}}\) \(\newcommand{\row}{\text{Row}}\) \(\newcommand{\col}{\text{Col}}\) \(\renewcommand{\row}{\text{Row}}\) \(\newcommand{\nul}{\text{Nul}}\) \(\newcommand{\var}{\text{Var}}\) \(\newcommand{\corr}{\text{corr}}\) \(\newcommand{\len}[1]{\left|#1\right|}\) \(\newcommand{\bbar}{\overline{\bvec}}\) \(\newcommand{\bhat}{\widehat{\bvec}}\) \(\newcommand{\bperp}{\bvec^\perp}\) \(\newcommand{\xhat}{\widehat{\xvec}}\) \(\newcommand{\vhat}{\widehat{\vvec}}\) \(\newcommand{\uhat}{\widehat{\uvec}}\) \(\newcommand{\what}{\widehat{\wvec}}\) \(\newcommand{\Sighat}{\widehat{\Sigma}}\) \(\newcommand{\lt}{<}\) \(\newcommand{\gt}{>}\) \(\newcommand{\amp}{&}\) \(\definecolor{fillinmathshade}{gray}{0.9}\)- Verify solutions to linear equations with two variables.
- Graph lines by plotting points.
- Identify and graph horizontal and vertical lines.
Solutions to Equations with Two Variables
A linear equation with two variables has standard form \(ax+by=c\), where \(a,b\), and \(c\) are real numbers and \(a\) and \(b\) are not both \(0\). Solutions to equations of this form are ordered pairs \((x, y)\), where the coordinates, when substituted into the equation, produce a true statement.
Determine whether \((1, −2)\) and \((−4, 1)\) are solutions to \(6x−3y=12\).
Solution:
Substitute the \(x\)- and \(y\)-values into the equation to determine whether the ordered pair produces a true statement.
\(\begin{array}{c|c}{\underline{Check\:\:(1,-2)}}&{\underline{Check\:\:(-4,1)}}\\{6x-3y=12}&{6x-3y=12} \\{6(\color{OliveGreen}{1}\color{black}{)-3(}\color{OliveGreen}{-2}\color{black}{)=12}}&{6(\color{OliveGreen}{-4}\color{black}{)-3(}\color{OliveGreen}{1}\color{black}{)=12}}\\{6+6=12}&{-24-3=12}\\{12=12\quad\color{Cerulean}{\checkmark}}&{-27=12\quad\color{red}{x}}\end{array}\)
Answer:
\((1,-2)\) is a solution, and \((-4,1)\) is not.
It is often the case that a linear equation is given in a form where one of the variables, usually \(y\), is isolated. If this is the case, then we can check that an ordered pair is a solution by substituting in a value for one of the coordinates and simplifying to see if we obtain the other.
Are \((\frac{1}{2}, −3)\) and \((−5, 14)\) solutions to \(y=2x−4\)?
Solution:
Substitute the \(x\)-values and simplify to see if the corresponding \(y\)-values are obtained.
\(\begin{array}{c|c} {\underline{x=\frac{1}{2}}}&{\underline{x=-5}}\\{y=2x-4}&{y=2x-4}\\{=2\color{black}{\left(\color{OliveGreen}{\frac{1}{2}} \right)-4}}&{=2(\color{OliveGreen}{-5}\color{black}{)-4}}\\{=1-4}&{=-10-4}\\{=-3\quad\color{Cerulean}{\checkmark}}&{=-14\quad\color{red}{x}} \end{array}\)
Answer:
\((\frac{1}{2},-3)\) is a solution, and \((-5,14)\) is not.
Is \((6, −1)\) a solution to \(y=−\frac{2}{3}x+3\)?
- Answer
-
Yes
When given linear equations with two variables, we can solve for one of the variables, usually \(y\), and obtain an equivalent equation as follows:
Written in this form, we can see that \(y\) depends on \(x\). Here \(x\) is the independent variable and \(y\) is the dependent variable.
\(\left. \begin{aligned} 6x-3y&=12 \\ y&=2x-4\end{aligned}\right\} \color{Cerulean}{Equivalent\:equations}\)
The linear equation \(y=2x−4\) can be used to find ordered pair solutions. If we substitute any real number for \(x\), then we can simplify to find the corresponding y-value. For example, if \(x=3\), then \(y=2(3)−4=6−4=2\), and we can form an ordered pair solution, \((3, 2)\). Since there are infinitely many real numbers to choose for \(x\), the linear equation has infinitely many ordered pair solutions \((x, y)\).
Find ordered pair solutions to the equation \(5x−y=14\) with the given \(x\)-values \(\{−2, −1, 0, 4, 6\}\).
Solution:
First, solve for \(y\).
Next, substitute the \(x\)-values in the equation \(y=5x−14\) to find the corresponding \(y\)-values.
In the previous example, certain \(x\)-values are given, but that is not always going to be the case. When treating \(x\) as the independent variable, we can choose any values for \(x\) and then substitute them into the equation to find the corresponding \(y\)-values. This method produces as many ordered pair solutions as we wish.
Find five ordered pair solutions to \(6x+2y=10\).
Solution:
First, solve for \(y\).
\(\begin{aligned} 6x+2y&=10 \\ 6x+2y\color{Cerulean}{-6x}&=10\color{Cerulean}{-6x} \\ 2y&=-6x+10 \\ \frac{2y}{\color{Cerulean}{2}}&=\frac{-6x+10}{\color{Cerulean}{2}} \\ y&=\frac{-6x}{2}+\frac{10}{2} \\ y&=-3x+5 \end{aligned}\)
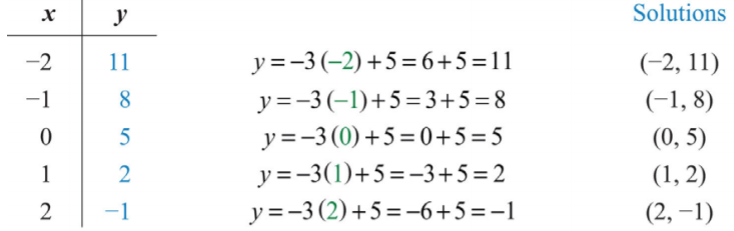
Next, choose any set of \(x\)-values. Usually we choose some negative values and some positive values. In this case, we will find the corresponding \(y\)-values when \(x\) is \(\{−2, −1, 0, 1, 2\}\). Make the substitutions required to fill in the following table (often referred to as a t-chart):
.png?revision=1)
Answer:
\(\{(−2, 11), (−1, 8), (0, 5), (1, 2), (2, −1)\}\). Since there are infinitely many ordered pair solutions, answers may vary depending on the choice of values for the independent variable.
Find five ordered pair solutions to \(10x−2y=2\).
- Answer
-
\(\{(−2, −11), (−1, −6), (0, −1), (1, 4), (2, 9)\}\) (answers may vary)
Graph by Plotting Points
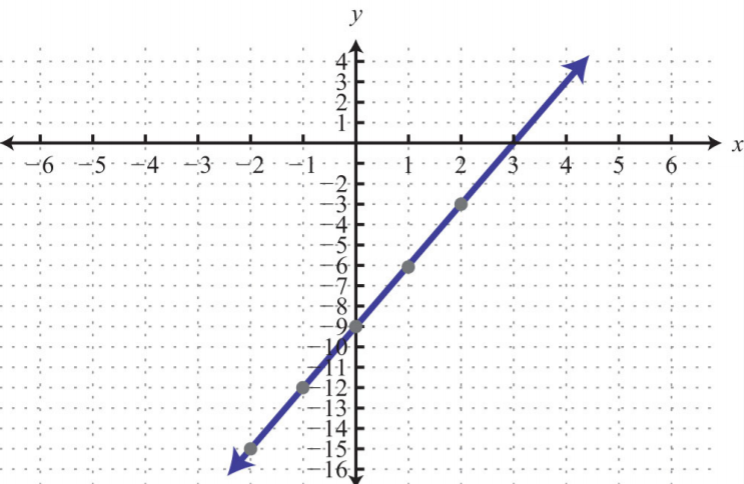
Since the solutions to linear equations are ordered pairs, they can be graphed using the rectangular coordinate system. The set of all solutions to a linear equation can be represented on a rectangular coordinate plane using a straight line connecting at least two points; this line is called its graph. To illustrate this, plot five ordered pair solutions, \(\{(−2, 11), (−1, 8), (0, 5), (1, 2), (2, −1)\}\), to the linear equation \(6x+2y=10\).
.png?revision=1)
Notice that the points are collinear; this will be the case for any linear equation. Draw a line through the points with a straightedge, and add arrows on either end to indicate that the graph extends indefinitely.
.png?revision=1)
The resulting line represents all solutions to \(6x+2y=10\), of which there are infinitely many. The steps for graphing lines by plotting points are outlined in the following example.
Find five ordered pair solutions and graph:
\(10x−5y=10\).
Solution:
Step 1: Solve for \(y\).
Step 2: Choose at least two \(x\)-values and find the corresponding \(y\)-values. In this section, we will choose five real numbers to use as \(x\)-values. It is a good practice to choose \(0\) and some negative numbers, as well as some positive numbers.
Five ordered pair solutions are \(\{(−2, −6), (−1, −4), (0, −2), (1, 0), (2, 2)\}\)
Step 3: Choose an appropriate scale, plot the points, and draw a line through them using a straightedge. In this case, choose a scale where each tick mark on the \(y\)-axis represents \(2\) units because all the \(y\)-values are multiples of \(2\).
Answer:
.png?revision=1)
It will not always be the case that \(y\) can be solved in terms of \(x\) with integer coefficients. In fact, the coefficients often turn out to be fractions.
Find five ordered pair solutions and graph:
\(−5x+2y=10\).
Solution:
\(\begin{aligned} -5x+2y&=10 \\ -5x+2y\color{Cerulean}{+5x}&=10\color{Cerulean}{+5x} \\ 2y&=5x+10 \\ frac{2y}{\color{Cerulean}{2}}&=\frac{5x+10}{\color{Cerulean}{2}} \\ y&=\frac{5x}{2}+\frac{10}{2} \\ y&=\frac{5}{2}x+5 \end{aligned}\)
Remember that you can choose any real number for the independent variable \(x\), so choose wisely here. Since the denominator of the coefficient of the variable \(x\) is \(2\), you can avoid fractions by choosing multiples of \(2\) for the \(x\)-values. In this case, choose the set of \(x\)-values \(\{−6, −4, −2, 0, 2\}\) and find the corresponding \(y\)-values.
.png?revision=1)
Five solutions are \(\{(−6, −10), (−4, −5), (−2, 0), (0, 5), (2, 10)\}\). Here we choose to scale the \(x\)-axis with multiples of \(2\) and the \(y\)-axis with multiples of \(5\).
Answer:
.png?revision=1)
Find five ordered pair solutions and graph: \(x+2y=6\).
- Answer
-
\(\{(−2, 4), (0, 3), (2, 2), (4, 1), (6, 0)\}\)
.png?revision=1)
Figure \(\PageIndex{8}\)
Horizontal and Vertical Lines
We need to recognize by inspection linear equations that represent a vertical or horizontal line.
Graph by plotting five points: \(y=−2\).
Solution:
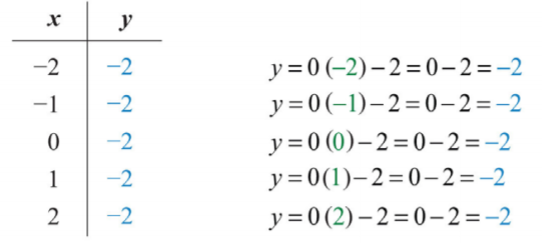
Since the given equation does not have a variable \(x\), we can rewrite it with a \(0\) coefficient for \(x\).
\(y=0x-2\)
Choose any five values for \(x\) and see that the corresponding \(y\)-value is always \(−2\).
.png?revision=1)
We now have five ordered pair solutions to plot \(\{(−2, −2), (−1, −2), (0, −2), (1, −2), (2, −2)\}\).
Answer:
.png?revision=1)
When the coefficient for the variable \(x\) is \(0\), the graph is a horizontal line. In general, the equation for a horizontal line can be written in the form \(y=k\), where \(k\) represents any real number.
Graph by plotting five points: \(x = 3\).
Solution:
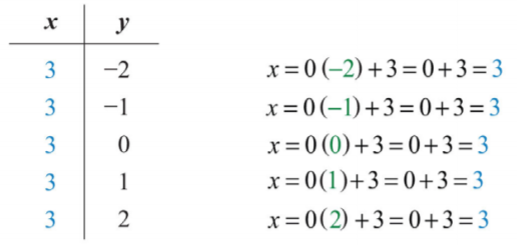
Since the given equation does not have a variable \(y\), rewrite it with a \(0\) coefficient for \(y\).
\(x=0y+3\)
Choose any five values for \(y\) and see that the corresponding \(x\)-value is always \(3\).
.png?revision=1)
We now have five ordered pair solutions to plot: \(\{(3, −2), (3, −1), (3, 0), (3, 1), (3, 2)\}\).
Answer:
.png?revision=1)
When the coefficient for the variable \(y\) is \(0\), the graph is a vertical line. In general, the equation for a vertical line can be written as \(x=k\), where \(k\) represents any real number.
To summarize, if \(k\) is a real number.
\[y=k\quad\color{Cerulean}{Horizontal\:line}\]
\[x=k\quad\color{Cerulean}{Vertical\:line}\]
Graph \(y=5\) and \(x=−2\) on the same set of axes and determine where they intersect.
- Answer
-
\((-2,5)\)
Key Takeaways
- Solutions to linear equations with two variables \(ax+by=c\) are ordered pairs \((x, y)\), where the coordinates, when substituted into the equation, result in a true statement.
- Linear equations with two variables have infinitely many ordered pair solutions. When the solutions are graphed, they are collinear.
- To find ordered pair solutions, choose values for the independent variable, usually \(x\), and substitute them in the equation to find the corresponding \(y\)-values.
- To graph linear equations, determine at least two ordered pair solutions and draw a line through them with a straightedge.
- Horizontal lines are described by \(y = k\), where \(k\) is any real number.
- Vertical lines are described by \(x = k\), where \(k\) is any real number.
Determine whether the given point is a solution.
- \(5x−2y=4; (−1, 1)\)
- \(3x−4y=10; (2, −1)\)
- \(−3x+y=−6; (4, 6)\)
- \(−8x−y=24; (−2, −3)\)
- \(−x+y=−7; (5, −2)\)
- \(9x−3y=6; (0, −2)\)
- \(\frac{1}{2}x+\frac{1}{3}y=−\frac{1}{6}; (1, −2)\)
- \(\frac{3}{4}x−\frac{1}{2}y=−1; (2, 1)\)
- \(4x−3y=1; (\frac{1}{2}, \frac{1}{3})\)
- \(−10x+2y=−\frac{9}{5}; (\frac{1}{5}, \frac{1}{10})\)
- \(y=\frac{1}{3}x+3; (6, 3)\)
- \(y=−4x+1; (−2, 9)\)
- \(y=\frac{2}{3}x−3; (0, −3)\)
- \(y=−\frac{5}{8}x+1; (8, −5)\)
- \(y=−\frac{1}{2}x+\frac{3}{4}; (−\frac{1}{2}, 1)\)
- \(y=−\frac{1}{3}x−\frac{1}{2}; (\frac{1}{2}, −\frac{2}{3})\)
- \(y=2; (−3, 2)\)
- \(y=4; (4, −4)\)
- \(x=3; (3, −3)\)
- \(x=0; (1, 0)\)
- Answer
-
1. No
3. Yes
5. Yes
7. Yes
9. Yes
11. No
13. Yes
15. Yes
17. Yes
19. Yes
Find the ordered pair solutions given the set of \(x\)-values.
- \(y=−2x+4; \{−2, 0, 2\}\)
- \(y=12x−3; \{−4, 0, 4\}\)
- \(y=−\frac{3}{4}x+\frac{1}{2}; \{−2, 0, 2\}\)
- \(y=−3x+1; \{−\frac{1}{2}, 0, \frac{1}{2}\}\)
- \(y=−4; \{−3, 0, 3\}\)
- \(y=\frac{1}{2}x+\frac{3}{4}; \{−\frac{1}{4}, 0, \frac{1}{4}\}\)
- \(2x−3y=1; \{0, 1, 2\}\)
- \(3x−5y=−15; \{−5, 0, 5\}\)
- \(–x+y=3; \{−5, −1, 0\}\)
- \(\frac{1}{2}x−\frac{1}{3}y=−4; \{−4, −2, 0\}\)
- \(\frac{3}{5}x+\frac{1}{10}y=2; \{−15, −10, −5\}\)
- \(x−y=0; \{10, 20, 30\}\)
- Answer
-
1. \(\{(−2, 8), (0, 4), (2, 0)\}\)
3. \(\{(−2, 2), (0, 1/2), (2, −1)\}\)
5. \(\{(−3, −4), (0, −4), (3, −4)\}\)
7. \(\{(0, −\frac{1}{3}), (1, \frac{1}{3}), (2, 1)\}\)
9. \(\{(−5, −2), (−1, 2), (0, 3)\}\)
11. \(\{(−15, 110), (−10, 80), (−5, 50)\}\)
Find the ordered pair solutions, given the set of \(y\)-values.
- \(y=\frac{1}{2}x−1; \{−5, 0, 5\}\)
- \(y=−\frac{3}{4}x+2; \{0, 2, 4\}\)
- \(3x−2y=6; \{−3, −1, 0\}\)
- \(−x+3y=4; \{−4, −2, 0\}\)
- \(\frac{1}{3}x−\frac{1}{2}y=−4; \{−1, 0, 1\}\)
- \(\frac{3}{5}x+\frac{1}{10}y=2; \{−20, −10, −5\}\)
- Answer
-
1. \(\{(−8, −5), (2, 0), (12, 5)\}\)
3. \(\{(0, −3), (\frac{4}{3}, −1), (2, 0)\}\)
5. \(\{(−\frac{27}{2}, −1), (−12, 0), (−\frac{21}{2}, 1)\}\)
Given the set of \(x\)-values \(\{−2, −1, 0, 1, 2\}\), find the corresponding \(y\)-values and graph them.
- \(y=x+1\)
- \(y=−x+1\)
- \(y=2x−1\)
- \(y=−3x+2\)
- \(y=5x−10\)
- \(5x+y=15\)
- \(3x−y=9\)
- \(6x−3y=9\)
- \(y=−5\)
- \(y=3\)
- Answer
-
1.
.png?revision=1)
Figure \(\PageIndex{13}\) 3.
.png?revision=1)
Figure \(\PageIndex{14}\) 5.
.png?revision=1)
Figure \(\PageIndex{15}\) 7.
.png?revision=1)
Figure \(\PageIndex{16}\) 9.
.png?revision=1)
Figure \(\PageIndex{17}\)
Find at least five ordered pair solutions and graph.
- \(y=2x−1\)
- \(y=−5x+3\)
- \(y=−4x+2\)
- \(y=10x−20\)
- \(y=−\frac{1}{2}x+2\)
- \(y=\frac{1}{3}x−1\)
- \(y=\frac{2}{3}x−6\)
- \(y=−\frac{2}{3}x+2\)
- \(y=x\)
- \(y=−x\)
- \(−2x+5y=−15\)
- \(x+5y=5\)
- \(6x−y=2\)
- \(4x+y=12\)
- \(−x+5y=0\)
- \(x+2y=0\)
- \(\frac{1}{10}x−y=3\)
- \(\frac{3}{2}x+5y=30\)
- Answer
-
1.
.png?revision=1)
Figure \(\PageIndex{18}\) 3.
.png?revision=1)
Figure \(\PageIndex{19}\) 5.
.png?revision=1)
Figure \(\PageIndex{20}\) 7.
.png?revision=1)
Figure \(\PageIndex{21}\) 9.
.png?revision=1)
Figure \(\PageIndex{22}\) 11.
.png?revision=1)
Figure \(\PageIndex{23}\) 13.
.png?revision=1)
Figure \(\PageIndex{24}\) 15.
.png?revision=1)
Figure \(\PageIndex{25}\) 17.
.png?revision=1)
Figure \(\PageIndex{26}\)
Find at least five ordered pair solutions and graph them.
- \(y=4\)
- \(y=−10\)
- \(x=4\)
- \(x=−1\)
- \(y=0\)
- \(x=0\)
- \(y=\frac{3}{4}\)
- \(x=−\frac{5}{4}\)
- Graph the lines \(y=−4\) and \(x=2\) on the same set of axes. Where do they intersect?
- Graph the lines \(y=5\) and \(x=−5\) on the same set of axes. Where do they intersect?
- What is the equation that describes the \(x\)-axis?
- What is the equation that describes the \(y\)-axis?
- Answer
-
1.
.png?revision=1)
Figure \(\PageIndex{27}\) 3.
.png?revision=1)
Figure \(\PageIndex{28}\) 5.
.png?revision=1)
Figure \(\PageIndex{29}\) 7.
.png?revision=1)
Figure \(\PageIndex{30}\) 9.
.png?revision=1)
Figure \(\PageIndex{31}\) 11. \(y=0\)
Graph by plotting points.
- \(y=−\frac{3}{5}x+6\)
- \(y=\frac{3}{5}x−3\)
- \(y=−3\)
- \(x=−5\)
- \(3x−2y=6\)
- \(−2x+3y=−12\)
- Answer
-
1.
.png?revision=1)
Figure \(\PageIndex{32}\) 3.
.png?revision=1)
Figure \(\PageIndex{33}\) 5.
.png?revision=1)
Figure \(\PageIndex{34}\)
- Discuss the significance of the relationship between algebra and geometry in describing lines.
- Give real-world examples relating two unknowns
- Answer
-
1. Answers may vary