
3.4: Domain coloring


- Last updated
- Feb 23, 2024
- Save as PDF

( \newcommand{\kernel}{\mathrm{null}\,}\)
Complex phase portraits
A way to visualize complex functions
=z")
In his book Visual Complex Functions, Elias Wegert employs phase portraits with contour lines of phase and modulus (enhanced phase portraits) for the study of the theory of complex functions. See for example Figures 2 and 3 for the function


We say that a complex funcion
respectively. Observe the contrast between the level curves of modulus in each case.
=z")
=1/z")
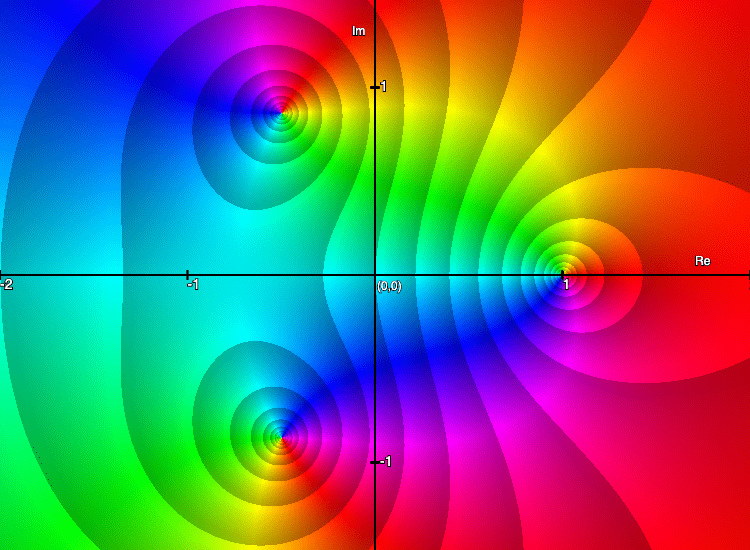
Consider now the function
which has a root at
Figure 6 shows the enhanced portrait of (1) with level curves of the modulus. Notice the behaviour of the level curves of the modulus around the root (right side) and the poles (left side). Can you see the difference?
Explore complex functions
Use the applet below to explore enhanced phase portraits of complex functions.
INTERACTIVE GRAPH
Warning!
If we do not impose additional restrictions, like continuity or differentiability, the isochromatic sets of complex functions can be arbitrary - but this is not so for analytic functions, which are the objects of prime interest in this text.
In fact, analytic functions are (almost) uniquely determined by their (pure) phase portraits, but this is not so for general functions. For example, the functions
have the same phase (except at their zeros and poles) though they are completely different.
Since pure phase portraits do not always display enough information for exploring general complex functions, I recommend the use of their enhanced versions with contour lines of modulus and phase in such cases. Figure 7 shows two such portraits of the functions
Figure 7: Enhanced phase portraits of
A notable distinction between the two portraits is the shape of the tiles. In the left picture most of them are almost squares and have right-angled corners. In contrast, many tiles in the portrait of