
Unit 6: Review
- Page ID
- 101654
\( \newcommand{\vecs}[1]{\overset { \scriptstyle \rightharpoonup} {\mathbf{#1}} } \)
\( \newcommand{\vecd}[1]{\overset{-\!-\!\rightharpoonup}{\vphantom{a}\smash {#1}}} \)
\( \newcommand{\dsum}{\displaystyle\sum\limits} \)
\( \newcommand{\dint}{\displaystyle\int\limits} \)
\( \newcommand{\dlim}{\displaystyle\lim\limits} \)
\( \newcommand{\id}{\mathrm{id}}\) \( \newcommand{\Span}{\mathrm{span}}\)
( \newcommand{\kernel}{\mathrm{null}\,}\) \( \newcommand{\range}{\mathrm{range}\,}\)
\( \newcommand{\RealPart}{\mathrm{Re}}\) \( \newcommand{\ImaginaryPart}{\mathrm{Im}}\)
\( \newcommand{\Argument}{\mathrm{Arg}}\) \( \newcommand{\norm}[1]{\| #1 \|}\)
\( \newcommand{\inner}[2]{\langle #1, #2 \rangle}\)
\( \newcommand{\Span}{\mathrm{span}}\)
\( \newcommand{\id}{\mathrm{id}}\)
\( \newcommand{\Span}{\mathrm{span}}\)
\( \newcommand{\kernel}{\mathrm{null}\,}\)
\( \newcommand{\range}{\mathrm{range}\,}\)
\( \newcommand{\RealPart}{\mathrm{Re}}\)
\( \newcommand{\ImaginaryPart}{\mathrm{Im}}\)
\( \newcommand{\Argument}{\mathrm{Arg}}\)
\( \newcommand{\norm}[1]{\| #1 \|}\)
\( \newcommand{\inner}[2]{\langle #1, #2 \rangle}\)
\( \newcommand{\Span}{\mathrm{span}}\) \( \newcommand{\AA}{\unicode[.8,0]{x212B}}\)
\( \newcommand{\vectorA}[1]{\vec{#1}} % arrow\)
\( \newcommand{\vectorAt}[1]{\vec{\text{#1}}} % arrow\)
\( \newcommand{\vectorB}[1]{\overset { \scriptstyle \rightharpoonup} {\mathbf{#1}} } \)
\( \newcommand{\vectorC}[1]{\textbf{#1}} \)
\( \newcommand{\vectorD}[1]{\overrightarrow{#1}} \)
\( \newcommand{\vectorDt}[1]{\overrightarrow{\text{#1}}} \)
\( \newcommand{\vectE}[1]{\overset{-\!-\!\rightharpoonup}{\vphantom{a}\smash{\mathbf {#1}}}} \)
\( \newcommand{\vecs}[1]{\overset { \scriptstyle \rightharpoonup} {\mathbf{#1}} } \)
\(\newcommand{\longvect}{\overrightarrow}\)
\( \newcommand{\vecd}[1]{\overset{-\!-\!\rightharpoonup}{\vphantom{a}\smash {#1}}} \)
\(\newcommand{\avec}{\mathbf a}\) \(\newcommand{\bvec}{\mathbf b}\) \(\newcommand{\cvec}{\mathbf c}\) \(\newcommand{\dvec}{\mathbf d}\) \(\newcommand{\dtil}{\widetilde{\mathbf d}}\) \(\newcommand{\evec}{\mathbf e}\) \(\newcommand{\fvec}{\mathbf f}\) \(\newcommand{\nvec}{\mathbf n}\) \(\newcommand{\pvec}{\mathbf p}\) \(\newcommand{\qvec}{\mathbf q}\) \(\newcommand{\svec}{\mathbf s}\) \(\newcommand{\tvec}{\mathbf t}\) \(\newcommand{\uvec}{\mathbf u}\) \(\newcommand{\vvec}{\mathbf v}\) \(\newcommand{\wvec}{\mathbf w}\) \(\newcommand{\xvec}{\mathbf x}\) \(\newcommand{\yvec}{\mathbf y}\) \(\newcommand{\zvec}{\mathbf z}\) \(\newcommand{\rvec}{\mathbf r}\) \(\newcommand{\mvec}{\mathbf m}\) \(\newcommand{\zerovec}{\mathbf 0}\) \(\newcommand{\onevec}{\mathbf 1}\) \(\newcommand{\real}{\mathbb R}\) \(\newcommand{\twovec}[2]{\left[\begin{array}{r}#1 \\ #2 \end{array}\right]}\) \(\newcommand{\ctwovec}[2]{\left[\begin{array}{c}#1 \\ #2 \end{array}\right]}\) \(\newcommand{\threevec}[3]{\left[\begin{array}{r}#1 \\ #2 \\ #3 \end{array}\right]}\) \(\newcommand{\cthreevec}[3]{\left[\begin{array}{c}#1 \\ #2 \\ #3 \end{array}\right]}\) \(\newcommand{\fourvec}[4]{\left[\begin{array}{r}#1 \\ #2 \\ #3 \\ #4 \end{array}\right]}\) \(\newcommand{\cfourvec}[4]{\left[\begin{array}{c}#1 \\ #2 \\ #3 \\ #4 \end{array}\right]}\) \(\newcommand{\fivevec}[5]{\left[\begin{array}{r}#1 \\ #2 \\ #3 \\ #4 \\ #5 \\ \end{array}\right]}\) \(\newcommand{\cfivevec}[5]{\left[\begin{array}{c}#1 \\ #2 \\ #3 \\ #4 \\ #5 \\ \end{array}\right]}\) \(\newcommand{\mattwo}[4]{\left[\begin{array}{rr}#1 \amp #2 \\ #3 \amp #4 \\ \end{array}\right]}\) \(\newcommand{\laspan}[1]{\text{Span}\{#1\}}\) \(\newcommand{\bcal}{\cal B}\) \(\newcommand{\ccal}{\cal C}\) \(\newcommand{\scal}{\cal S}\) \(\newcommand{\wcal}{\cal W}\) \(\newcommand{\ecal}{\cal E}\) \(\newcommand{\coords}[2]{\left\{#1\right\}_{#2}}\) \(\newcommand{\gray}[1]{\color{gray}{#1}}\) \(\newcommand{\lgray}[1]{\color{lightgray}{#1}}\) \(\newcommand{\rank}{\operatorname{rank}}\) \(\newcommand{\row}{\text{Row}}\) \(\newcommand{\col}{\text{Col}}\) \(\renewcommand{\row}{\text{Row}}\) \(\newcommand{\nul}{\text{Nul}}\) \(\newcommand{\var}{\text{Var}}\) \(\newcommand{\corr}{\text{corr}}\) \(\newcommand{\len}[1]{\left|#1\right|}\) \(\newcommand{\bbar}{\overline{\bvec}}\) \(\newcommand{\bhat}{\widehat{\bvec}}\) \(\newcommand{\bperp}{\bvec^\perp}\) \(\newcommand{\xhat}{\widehat{\xvec}}\) \(\newcommand{\vhat}{\widehat{\vvec}}\) \(\newcommand{\uhat}{\widehat{\uvec}}\) \(\newcommand{\what}{\widehat{\wvec}}\) \(\newcommand{\Sighat}{\widehat{\Sigma}}\) \(\newcommand{\lt}{<}\) \(\newcommand{\gt}{>}\) \(\newcommand{\amp}{&}\) \(\definecolor{fillinmathshade}{gray}{0.9}\)You will now practice all the skills you learned in Book 6. You can use this as a review for your final test.
If you can’t remember how to do a question, go back to the lesson on this topic to refresh your memory. The unit and topic for where each question came from is listed next to the question.
Example: 1A means Unit 1, Topic A
Unit 1
1-A
- Write the ratios asked for.
- Lillian biked for 6 hours, and covered a total of 45 km. What is the ratio of kilometers to hours?
- Nine hundred cars were lined up at the ferry terminal. 300 hundred cars got on the next sailing. Write a ratio of how many cars were left behind to how many cars got on the first sailing.
1-B
2. Simplify these ratios.
- \(9:12\)
- \(50:5\)
- \(56:7\)
- \(100:120\)
3. Write the following ratios as rates.
a. 110 kilometres to 2 hours
b. 9 cups of flour to 3 tablespoons of yeast
c. 240,000 people to 300 square kilometers
1-C
4. Solve these proportions.
- \(1:3=N:12\)
- \(25:N=20:4\)
- \(N:49=14:98\)
- \(412:6=N:3.6\)
- The dose for cough syrup is 20 millilitres for each 100 pounds of body weight. How much should be given to a 34 pound child? Round to the nearest millilitre.
Unit 2
2-A
5. Write these percents using numerals and the percent sign.
- Seventy-two percent
- Three-fourths percent
- One hundred two percent
6. Write these percents in words.
- \(12\%\)
- \(\dfrac{1}{5}\%\)
7. Change the percents to equivalent decimals.
- \(17\%\)
- \(98\dfrrac{1}{2}\%\)
- \(\dfrac{1}{3}\%\)
8. Write the decimals as percents.
- 0.45
- 4.75
- 0.099
9. Change each percent to an equivalent common fraction. Put the fraction in lowest terms.
- \(33\dfrac{1}{3}\%\)
- \(14\%\)
- \(250\%\)
10. Write the percent equivalent
- \(\dfrac{1}{5}\)
- \(\dfrac{2}{3}\)
- \(\dfrac{1}{4}\)
Unit 3
3-A
11. Find the answers.(Express percents rounded to the nearest tenth, money to the nearest cent and decimals to the nearest thousandth. Please show all your work. Use proportion.)
- \(13\% \text{ of } 52 =\)
- \(\dfrac{9}{10}\% \text{ of } 2,400\) is .
- What is \(135\%\) of \(1,080\)?
12. Solve these problems. Be sure to show all your work.
- Marianne is renovating her kitchen, and she is ordering everything from her local hardware store. She is getting a sink for $204.79, a dishwasher for $524.95, a counter for $949.99, flooring for $719.95, and a fridge for $579.49.
- Calculate the HST (12%).
- Calculate the total cost, including the taxes.
- Shane sold a home for $340,500.00 for a client. He earned 6% commission. How much money did Shane make?
- A love seat is originally priced at $904.00, it is offered at 45% off. What is the discount price?
- Calculate the total cost in Canadian dollars of this purchase made in the United States. Assume $1.00 Canadian = $0.92 U.S.
Clothes–Total price in $US=$317.98Clothes–Total price in $US=$317.98.- Price in Canadian dollars
- Duty at 13.5%
- Total of Canadian value + duty
- HST (12%) on Canadian value + duty
- Total cost in Canadian dollars
Unit 4
4-A
13. Find the answers.
- 34 is what percent of 85?
- What % of 150 is 114?
- 33⅓% of what number is 60?
- 32 is 20% of what number?
- 75% of what number is 675?
- 3.75 is 1¼% of?
14. Solve these problems. Be sure to show all your work.
- A printer is priced at $399. It is marked 30% off.
- What is the sale price of the printer?
- What is the cost of this printer with HST (12%)?
- The Vancouver Fire and Rescue Service has 797 uniformed personnel, about 0.8% are women. About how many women are in uniform in the Vancouver Fire and Rescue Service?
- Jake is a computer salesperson. He receives a monthly salary of $1,055 plus 15% on all his sales over $5,500. What was his total monthly earnings if his sales were
$12,400 in one month? - The local ski hill sold 3,800 season’s passes in 2009. The 2010 sales are down 10.5%. Find the number of season’s passes sold in 2010.
Unit 5
5-A
15. Line graph.
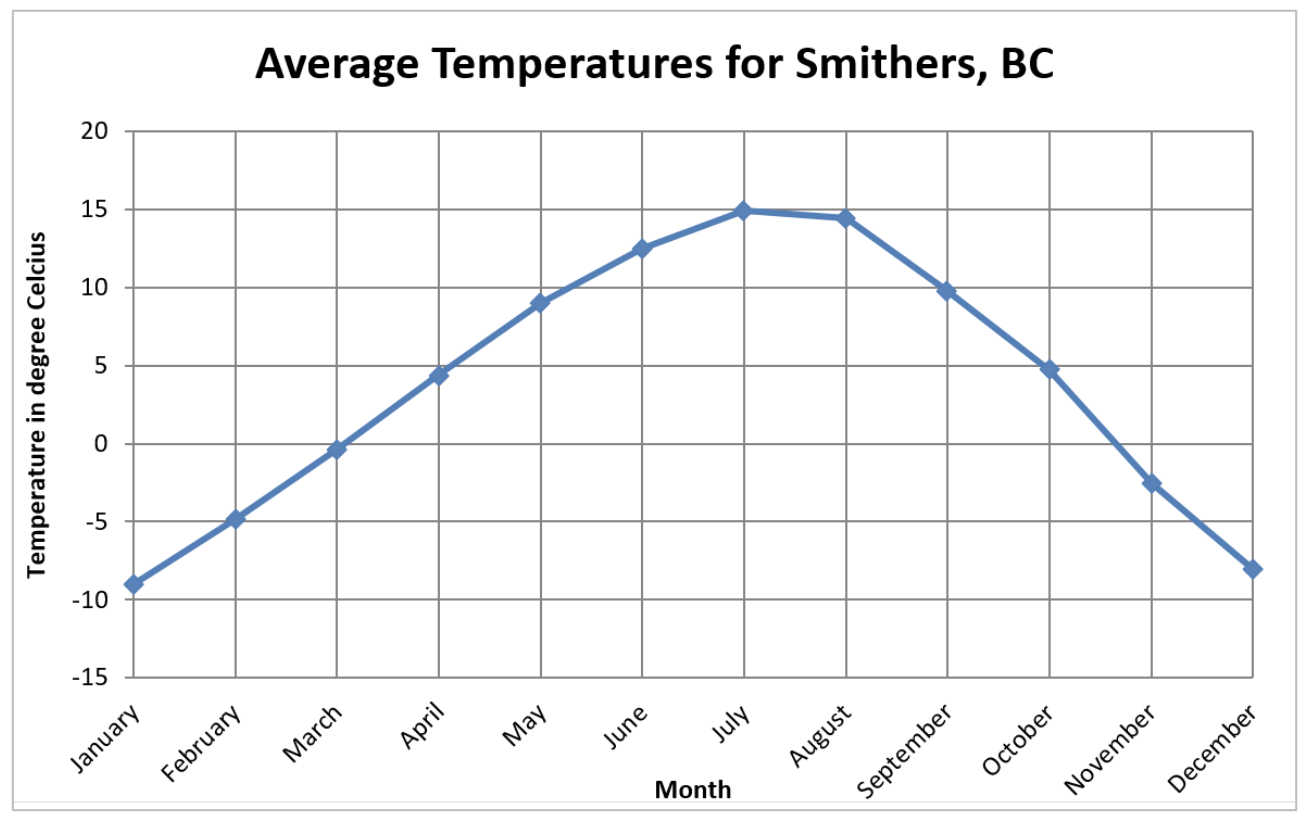
- Which month has the highest temperature in Smithers?
- Which month has the lowest temperature in Smithers?
- Between the months of January to July, is there an increase or decrease in temperature?
- What is the difference between the monthly temperature for August and the monthly temperature for October?
- What is the trend of the temperature in Smithers?
5-B
16. Bar graph.
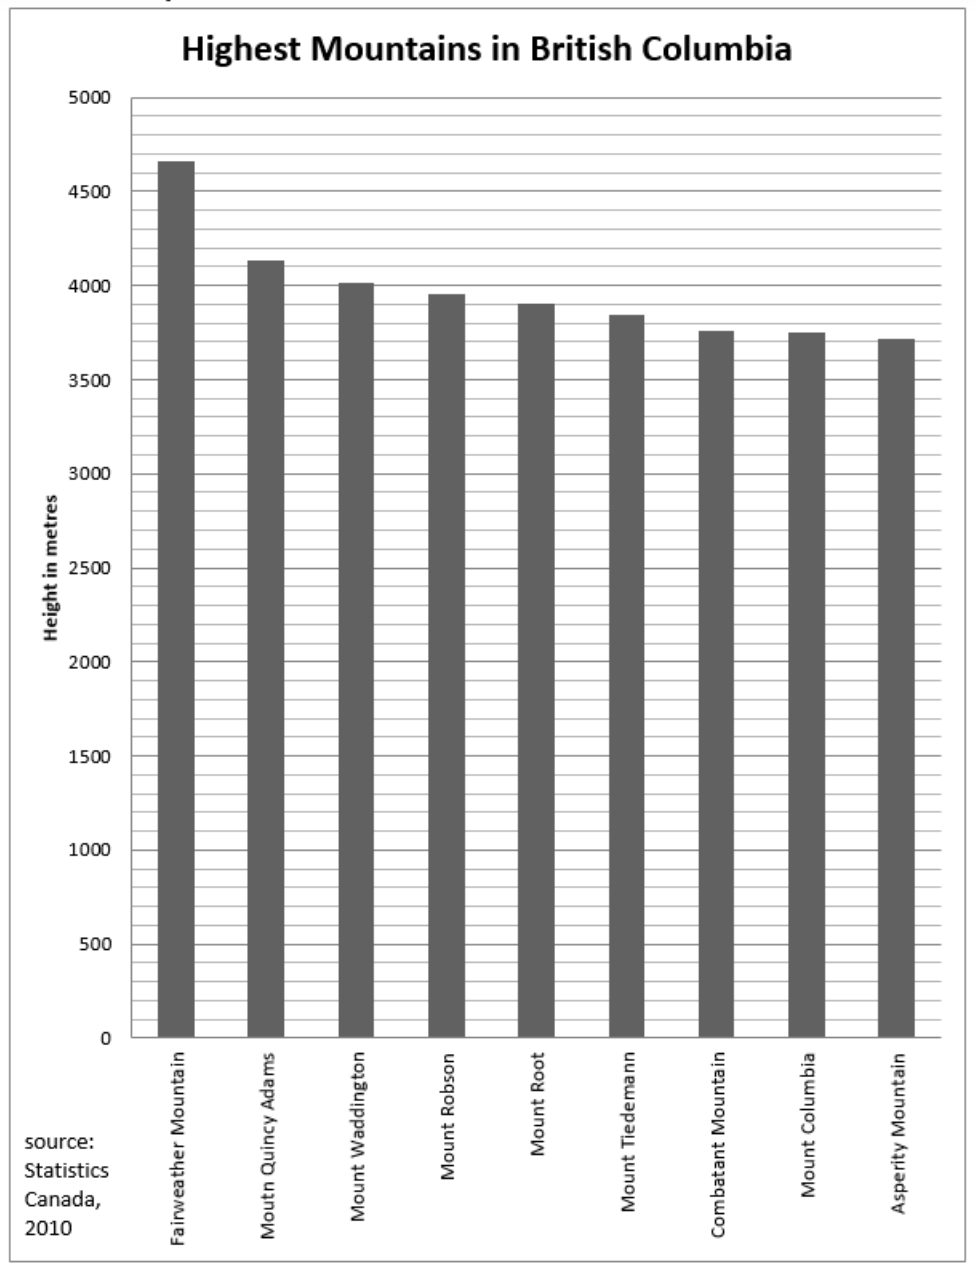
- What is the height of the tallest mountain in BC?
- How many mountains are over 4,000 metres and under 5,000 metres in height?
- Which two mountains in this chart are very similar in height?
- What is the difference (approximately) in height between Fairweather Mountain and Asperity Mountain?
5-C
17. Picture graph.
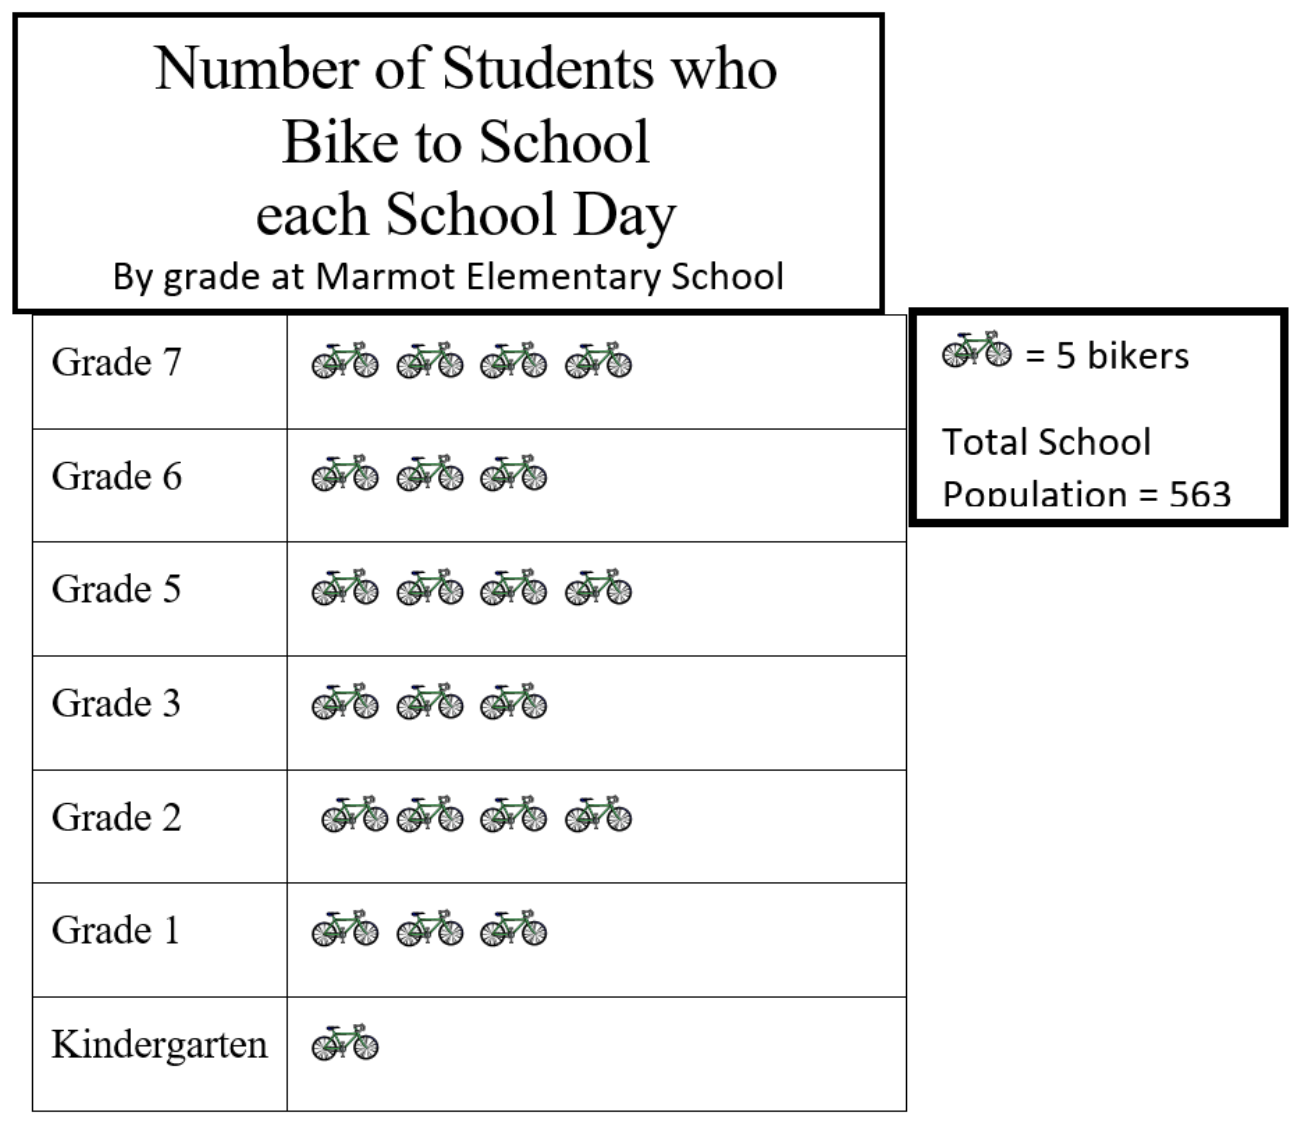
- How many students in grade 2 ride bikes to school?
- Which classes have the most bikers?
- Which class has the least bikers?
- How many more bikers are in grade 7 than kindergarten?
- How many students bike in total?
- What percent of the school bikes each day?
5-D
18. Circle graph.
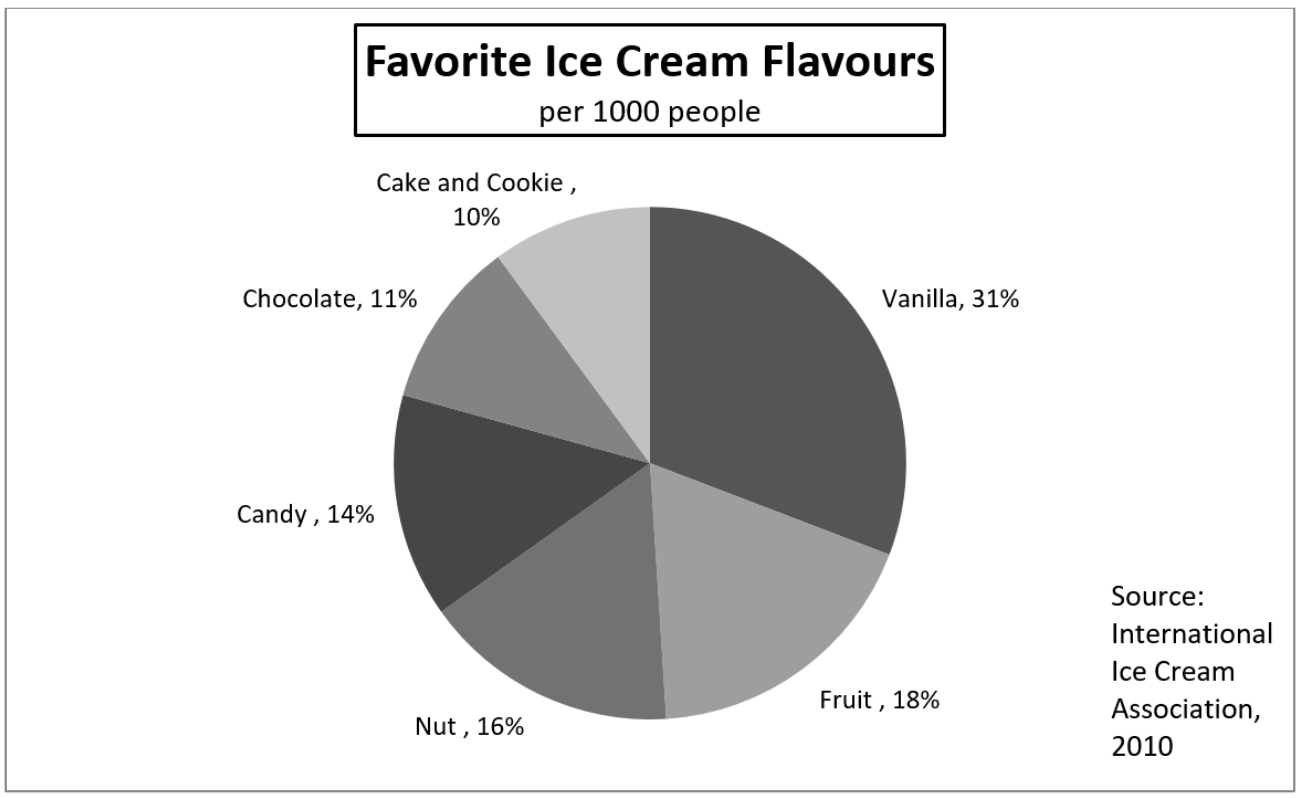
- Which is the most favorite ice cream flavor?
- Which is the least liked ice cream flavor?
- How many people (out of 1,000) like fruit-flavored ice cream?
- What percentage of people like vanilla over chocolate?
Answers to Book 6 Review
-
- \(45:6\)
- \(600:300\)
-
- \(3:4\)
- \(10:1\)
- \(8:1\)
- \(5:6\)
-
- \(55 \rm km/hr\) or \(55 \rm km:1 \rm hr\)
- 3 cups of flour to 1 tbsp yeast
- 800 people to 1 square km
-
- 4
- 5
- 7
- 2.7
- 7 mL
-
- \(72\%\)
- \(\dfrac{3}{4}\%\)
- \(102\%\)
-
- Twelve percent
- One-fifth percent
-
- 0.17
- 0.985
- \(0.00\bar{3}\)
-
- \(45\%\)
- \(475\%\)
- \(9.9\%\)
-
- \(\dfrac{1}{3}\)
- \(\dfrac{7}{50}\)
- \(2\dfrac{1}{2}\)
-
- \(20\%\)
- \(66.\bar{6}\% \text{ or } 66 \dfrac{2}{3}\%\)
- \(25\%\)
-
- 6.76
- 21.6
- 1,458
-
-
- $357.50
- $3,336.67
- $20,430.00
- $497.20
-
- $345.63
- $46.66
- $392.29
- $47.07
- $439.36
-
-
- 40
- 76
- 180
- 160
- 900
- 300
-
-
- $279.30
- $312.82
- 6
- $2,090
- 3,401
-
-
- July
- January
- Increase
- Approximately 9 degrees
- The temperature goes up from January to July, and goes down from July to December
-
- Approximately 4,650 metres
- 3
- Combatant Mountain and Mount Columbia
- Approximately 950 metres
-
- 20
- Grades 2, 5, 7
- Kindergarten
- 15
- 110
- Approximately \(19.5\%\)
-
- Vanilla
- Cake and cookie
- 180
- \(20\%\)
Image Descriptions
Graph 1 (Line Graph)
A line graph displays the average temperature in Smithers, BC each month.
- The horizontal axis lists each month of the calendar year.
- The vertical axis is temperature in degrees Celsius, and contains the numbers -15 to 20 in increments of 5.
The line graph data is represented in the following table:
Average Temperatures for Smithers, BC
| Month (Horizontal Axis) | Temperature in Degrees Celsius (Vertical Axis) |
|---|---|
| January | \(~−9\) |
| Feburary | \(~−5\) |
| March | \(~0\) |
| April | \(~5\) |
| May | \(~9\) |
| June | \(~12.5\) |
| July | \(~15\) |
| August | \(~14\) |
| September | \(~10\) |
| October | \(~5\) |
| November | \(~−2.5\) |
| December | \(~−8\) |
Graph 2 (Bar Graph)
A bar graph displays the height of the highest mountains in British Columbia in metres.
- The horizontal axis lists the following mountains: Fairweather Mountain, Mount Quincy Adams, Mount Waddington, Mount Robson, Mount Root, Mount Tiedemann, Combatant Mountain, Mount Columbia, and Asperity Mountain.
- The vertical axis is height in metres, and contains the numbers 5,000 in increments of 100.
The bar graph data is represented in the following table:
Highest Mountains in British Columbia
| Mountain (Horizontal Axis) | Height in metres (Vertical Axis) |
|---|---|
| Fairweather Mountain | ~4,650 |
| Mount Quincy Adams | ~4,100 |
| Mount Waddington | ~4,000 |
| Mount Robson | ~3,950 |
| Mount Root | ~3,900 |
| Mount Tiedemann | ~3,850 |
| Combatant Mountain | ~3,750 |
| Mount Columbia | ~3,750 |
| Asperity Mountain | ~3,700 |
| Source: Statistics Canada, 2010 | |
Graph 3 (Picture Graph)
A picture graph displays the number of students at Marmot Elementary School who bike to school each day by grade.
- The vertical axis lists the following grades at Marmot Elementary School: Grade 7, Grade 6, Grade 5, Grade 3, Grade 2, Grade 1, and Kindergarten.
- The horizontal axis contains pictures of bicycles, with each bicycle representing 5 bikers according to the legend.
- The total school population is 563 students.
The picture graph data is represented in the following table:
Number of Students who Bike to School each School Day: By grade at Marmot Elementary School
| Grade (Vertical Axis) | Pictures of Bikes (Horizontal Axis) |
|---|---|
| Grade 7 | 4 |
| Grade 6 | 3 |
| Grade 5 | 4 |
| Grade 3 | 3 |
| Grade 2 | 4 |
| Grade 1 | 3 |
| Kindergarden | 1 |
Graph 4 (Circle Graph)
A circle graph displays the favourite ice cream flavours per 1,000 people.
- The entire graph represents all 1,000 people surveyed for their favourite ice cream flavour.
- Each part represents an ice cream flavour and its popularity as a percent of the whole. The flavours are (clockwise from top): Vanilla, Fruit, Nut, Candy, Chocolate, and Cake and Cookie.
The circle graph data is represented in the following table:
Favorite Ice Cream Flavors: per 1000 people
| Flavour | Percentage of Total |
|---|---|
| Vanilla | 31% |
| Fruit | 18% |
| Nut | 16% |
| Candy | 14% |
| Chocolate | 11% |
| Cake and Cookie | 10% |