
3.2: Averages (What Is Typical?)
- Page ID
- 22077

\( \newcommand{\vecs}[1]{\overset { \scriptstyle \rightharpoonup} {\mathbf{#1}} } \)
\( \newcommand{\vecd}[1]{\overset{-\!-\!\rightharpoonup}{\vphantom{a}\smash {#1}}} \)
\( \newcommand{\dsum}{\displaystyle\sum\limits} \)
\( \newcommand{\dint}{\displaystyle\int\limits} \)
\( \newcommand{\dlim}{\displaystyle\lim\limits} \)
\( \newcommand{\id}{\mathrm{id}}\) \( \newcommand{\Span}{\mathrm{span}}\)
( \newcommand{\kernel}{\mathrm{null}\,}\) \( \newcommand{\range}{\mathrm{range}\,}\)
\( \newcommand{\RealPart}{\mathrm{Re}}\) \( \newcommand{\ImaginaryPart}{\mathrm{Im}}\)
\( \newcommand{\Argument}{\mathrm{Arg}}\) \( \newcommand{\norm}[1]{\| #1 \|}\)
\( \newcommand{\inner}[2]{\langle #1, #2 \rangle}\)
\( \newcommand{\Span}{\mathrm{span}}\)
\( \newcommand{\id}{\mathrm{id}}\)
\( \newcommand{\Span}{\mathrm{span}}\)
\( \newcommand{\kernel}{\mathrm{null}\,}\)
\( \newcommand{\range}{\mathrm{range}\,}\)
\( \newcommand{\RealPart}{\mathrm{Re}}\)
\( \newcommand{\ImaginaryPart}{\mathrm{Im}}\)
\( \newcommand{\Argument}{\mathrm{Arg}}\)
\( \newcommand{\norm}[1]{\| #1 \|}\)
\( \newcommand{\inner}[2]{\langle #1, #2 \rangle}\)
\( \newcommand{\Span}{\mathrm{span}}\) \( \newcommand{\AA}{\unicode[.8,0]{x212B}}\)
\( \newcommand{\vectorA}[1]{\vec{#1}} % arrow\)
\( \newcommand{\vectorAt}[1]{\vec{\text{#1}}} % arrow\)
\( \newcommand{\vectorB}[1]{\overset { \scriptstyle \rightharpoonup} {\mathbf{#1}} } \)
\( \newcommand{\vectorC}[1]{\textbf{#1}} \)
\( \newcommand{\vectorD}[1]{\overrightarrow{#1}} \)
\( \newcommand{\vectorDt}[1]{\overrightarrow{\text{#1}}} \)
\( \newcommand{\vectE}[1]{\overset{-\!-\!\rightharpoonup}{\vphantom{a}\smash{\mathbf {#1}}}} \)
\( \newcommand{\vecs}[1]{\overset { \scriptstyle \rightharpoonup} {\mathbf{#1}} } \)
\(\newcommand{\longvect}{\overrightarrow}\)
\( \newcommand{\vecd}[1]{\overset{-\!-\!\rightharpoonup}{\vphantom{a}\smash {#1}}} \)
\(\newcommand{\avec}{\mathbf a}\) \(\newcommand{\bvec}{\mathbf b}\) \(\newcommand{\cvec}{\mathbf c}\) \(\newcommand{\dvec}{\mathbf d}\) \(\newcommand{\dtil}{\widetilde{\mathbf d}}\) \(\newcommand{\evec}{\mathbf e}\) \(\newcommand{\fvec}{\mathbf f}\) \(\newcommand{\nvec}{\mathbf n}\) \(\newcommand{\pvec}{\mathbf p}\) \(\newcommand{\qvec}{\mathbf q}\) \(\newcommand{\svec}{\mathbf s}\) \(\newcommand{\tvec}{\mathbf t}\) \(\newcommand{\uvec}{\mathbf u}\) \(\newcommand{\vvec}{\mathbf v}\) \(\newcommand{\wvec}{\mathbf w}\) \(\newcommand{\xvec}{\mathbf x}\) \(\newcommand{\yvec}{\mathbf y}\) \(\newcommand{\zvec}{\mathbf z}\) \(\newcommand{\rvec}{\mathbf r}\) \(\newcommand{\mvec}{\mathbf m}\) \(\newcommand{\zerovec}{\mathbf 0}\) \(\newcommand{\onevec}{\mathbf 1}\) \(\newcommand{\real}{\mathbb R}\) \(\newcommand{\twovec}[2]{\left[\begin{array}{r}#1 \\ #2 \end{array}\right]}\) \(\newcommand{\ctwovec}[2]{\left[\begin{array}{c}#1 \\ #2 \end{array}\right]}\) \(\newcommand{\threevec}[3]{\left[\begin{array}{r}#1 \\ #2 \\ #3 \end{array}\right]}\) \(\newcommand{\cthreevec}[3]{\left[\begin{array}{c}#1 \\ #2 \\ #3 \end{array}\right]}\) \(\newcommand{\fourvec}[4]{\left[\begin{array}{r}#1 \\ #2 \\ #3 \\ #4 \end{array}\right]}\) \(\newcommand{\cfourvec}[4]{\left[\begin{array}{c}#1 \\ #2 \\ #3 \\ #4 \end{array}\right]}\) \(\newcommand{\fivevec}[5]{\left[\begin{array}{r}#1 \\ #2 \\ #3 \\ #4 \\ #5 \\ \end{array}\right]}\) \(\newcommand{\cfivevec}[5]{\left[\begin{array}{c}#1 \\ #2 \\ #3 \\ #4 \\ #5 \\ \end{array}\right]}\) \(\newcommand{\mattwo}[4]{\left[\begin{array}{rr}#1 \amp #2 \\ #3 \amp #4 \\ \end{array}\right]}\) \(\newcommand{\laspan}[1]{\text{Span}\{#1\}}\) \(\newcommand{\bcal}{\cal B}\) \(\newcommand{\ccal}{\cal C}\) \(\newcommand{\scal}{\cal S}\) \(\newcommand{\wcal}{\cal W}\) \(\newcommand{\ecal}{\cal E}\) \(\newcommand{\coords}[2]{\left\{#1\right\}_{#2}}\) \(\newcommand{\gray}[1]{\color{gray}{#1}}\) \(\newcommand{\lgray}[1]{\color{lightgray}{#1}}\) \(\newcommand{\rank}{\operatorname{rank}}\) \(\newcommand{\row}{\text{Row}}\) \(\newcommand{\col}{\text{Col}}\) \(\renewcommand{\row}{\text{Row}}\) \(\newcommand{\nul}{\text{Nul}}\) \(\newcommand{\var}{\text{Var}}\) \(\newcommand{\corr}{\text{corr}}\) \(\newcommand{\len}[1]{\left|#1\right|}\) \(\newcommand{\bbar}{\overline{\bvec}}\) \(\newcommand{\bhat}{\widehat{\bvec}}\) \(\newcommand{\bperp}{\bvec^\perp}\) \(\newcommand{\xhat}{\widehat{\xvec}}\) \(\newcommand{\vhat}{\widehat{\vvec}}\) \(\newcommand{\uhat}{\widehat{\uvec}}\) \(\newcommand{\what}{\widehat{\wvec}}\) \(\newcommand{\Sighat}{\widehat{\Sigma}}\) \(\newcommand{\lt}{<}\) \(\newcommand{\gt}{>}\) \(\newcommand{\amp}{&}\) \(\definecolor{fillinmathshade}{gray}{0.9}\)No matter where you go or what you do, averages are everywhere. Let’s look at some examples:
- Three-quarters of your student loan is spent. Unfortunately, only half of the first semester has passed, so you resolve to squeeze the most value out of the money that remains. But have you noticed that many grocery products are difficult to compare in terms of value because they are packaged in different sized containers with different price points? For example, one tube of toothpaste sells in a 125 mL size for $1.99 while a comparable brand sells for $1.89 for 110 mL. Which is the better deal? A fair comparison requires you to calculate the average price per millilitre.
- Your local transit system charges $2.25 for an adult fare, $1.75 for students and seniors, and $1.25 for children. Is this enough information for you to calculate the average fare, or do you need to know how many riders of each kind there are?
- Five years ago you invested $8,000 in Roller Coasters Inc. The stock value has changed by 9%, −7%, 13%, 4%, and −2% over these years, and you wonder what the average annual change is and whether your investment kept up with inflation.
- If you participate in any sport, you have an average of some sort: bowlers have bowling averages; hockey or soccer goalies have a goals against average (GAA); and baseball pitchers have an earned run average (ERA).
Averages generally fall into three categories. This section explores simple, weighted, and geometric averages.
Simple Averages
An average is a single number that represents the middle of a data set. It is commonly interpreted to mean the “typical value.” Calculating averages facilitates easier comprehension of and comparison between different data sets, particularly if there is a large amount of data. For example, what if you want to compare year-over-year sales? One approach would involve taking company sales for each of the 52 weeks in the current year and comparing these with the sales of all 52 weeks from last year. This involves 104 weekly sales figures with 52 points of comparison. From this analysis, could you concisely and confidently determine whether sales are up or down? Probably not. An alternative approach involves comparing last year’s average weekly sales against this year’s average weekly sales. This involves the direct comparison of only two numbers, and the determination of whether sales are up or down is very clear.
In a simple average, all individual data share the same level of importance in determining the typical value. Each individual data point also has the same frequency, meaning that no one piece of data occurs more frequently than another. Also, the data do not represent a percent change. To calculate a simple average, you require two components:
- The data itself—you need the value for each piece of data.
- The quantity of data—you need to know how many pieces of data are involved (the count), or the total quantity used in the calculation.
The Formula
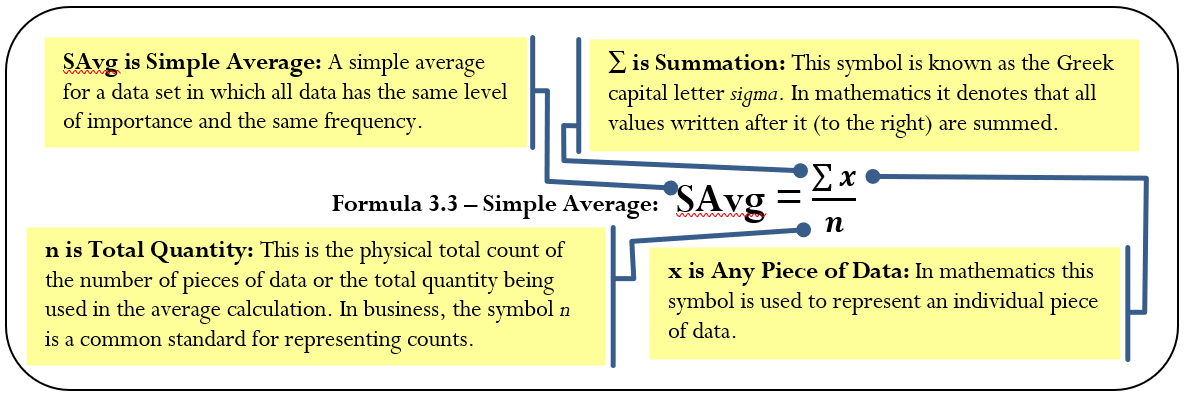
As expressed in Formula 3.3, you calculate a simple average by adding together all of the pieces of data then taking that total and dividing it by the quantity.
How It Works
The steps required to calculate a simple average are as follows:
Step 1: Sum every piece of data.
Step 2: Determine the total quantity involved.
Step 3: Calculate the simple average using Formula 3.3.
Assume you want to calculate an average on three pieces of data: 95, 108, and 97. Note that the data are equally important and each appears only once, thus having the same frequency. You require a simple average.
Step 1: \(\sum X=95+108+97=300\).
Step 2: There are three pieces of data, or \(n = 3\).
Step 3: Apply Formula 3.3: \(\text{SAvg}=\dfrac{300}{3}=100\). The simple average of the data set is 100.
Important Notes
Although mentioned earlier, it is critical to stress that a simple average is calculated only when all of the following conditions are met:
- All of the data shares the same level of importance toward the calculation.
- All of the data appear the same number of times.
- The data does not represent percent changes or a series of numbers intended to be multiplied with each other.
If any of these three conditions are not met, then either a weighted or geometric average is used depending on which of the above criteria failed. We discuss this later when each average is introduced.
It is critical to recognize if you have potentially made any errors in calculating a simple average. Review the following situations and, without making any calculations, determine the best answer.
- The simple average of 15, 30, 40, and 45 is:
- lower than 20.
- between 20 and 40, inclusive.
- higher than 40.
- If the simple average of three pieces of data is 20, which of the following data do not belong in the data set? Data set: 10, 20, 30, 40
- 10
- 20
- 30
- 40
- Answer
-
- b (a simple average should fall in the middle of the data set, which appears spread out between 15 and 45, so the middle would be around 30)
- d (if the number 40 is included in any average calculation involving the other numbers, it is impossible to get a low average of 20)
First quarter sales for Buzz Electronics are as indicated in the table below.
| Month | 2013 Sales | 2014 Sales |
|---|---|---|
| January | $413,200 | $455,875 |
| February | $328,987 | $334,582 |
| March | $350,003 | $312,777 |
Martha needs to prepare a report for the board of directors comparing year-over-year quarterly performance. To do this, she needs you to do the following:
- Calculate the average sales in the quarter for each year.
- Express the 2014 sales as a percentage of the 2013 sales, rounding your answer to two decimals.
Solution
You need to calculate a simple average, or \(\text{SAvg}\), for the first quarter in each of 2013 and 2014. Then convert the numbers into a percentage.
What You Already Know
You know the three quarters annually:
2013: \(X_1 = \$413,200 \) \(X_2 = \$328,986\) \(X_3 = \$350,003\)
2014: \(X_1 = \$455,876\) \(X_2 = \$334,582\) \(X_3 = \$312,777\)
How You Will Get There
For each year, perform steps 1 to 3:
Step 1: Sum the data.
Step 2: Count the total quantity of data involved.
Step 3: Calculate the simple average using Formula 3.3.
Step 4: To calculate the rate expressed as a percentage, apply Formula 2.2 from Chapter 2, \(\text { Rate }=\dfrac{\text { Portion }}{\text { Base }}\), treating the 2013 average sales as the base (note the key word "of" in the question) and the 2014 sales as the portion. Round to two decimals.
Perform
Year 2013
Step 1:
\[\begin{aligned} \sum X &=s 413,200+\$ 328,986+\$ 350,003 \\ &=\$ 1,092,189 \end{aligned}\nonumber \]
Step 2:
\[n = 3\nonumber \]
Step 3:
\[\text{SAvg}=\dfrac{\$ 1,092,189}{3}=\$ 364,063\nonumber \]
Step 4:
\[\%=\dfrac{\$ 367,745}{\$ 364,063} \times 100=101.01 \%\nonumber \]
Year 2014
Step 1:
\[\begin{aligned} \sum X &=\$ 455,876+\$ 334,582+\$ 312,777 \\ &=\$ 1,103,235 \end{aligned}\nonumber \]
Step 2:
\[n = 3\nonumber \]
Step 3:
\[\text{SAvg}=\dfrac{\$ 1,103,235}{3}=\$ 367,745\nonumber \]
The average monthly sales in 2013 were $364,063 compared to sales in 2014 of $367,745. This means that 2014 sales are 101.01% of 2013 sales.
Weighted Averages
Have you considered how your grade point average (GPA) is calculated? Your business program requires the successful completion of many courses. Your grades in each course combine to determine your GPA; however, not every course necessarily has the same level of importance as measured by your course credits.
Perhaps your math course takes one hour daily while your communications course is only delivered in one-hour sessions three times per week. Consequently, the college assigns the math course five credit hours and the communications course three credit hours. If you want an average, these different credit hours mean that the two courses do not share the same level of importance, and therefore a simple average cannot be calculated.
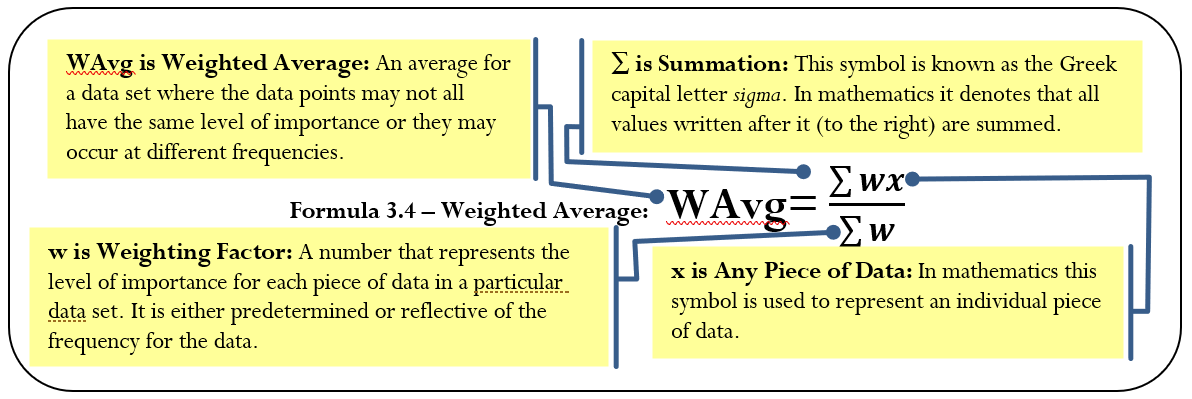
In a weighted average, not all pieces of data share the same level of importance or they do not occur with the same frequency. The data cannot represent a percent change or a series of numbers intended to be multiplied with each other. To calculate a weighted average, you require two components:
- The data itself—you need the value for each piece of data.
- The weight of the data—you need to know how important each piece of data is to the average. This is either an assigned value or a reflection of the number of times each piece of data occurs (the frequency).
The Formula
As expressed in Formula 3.4, calculate a weighted average by adding the products of the weights and data for the entire data set and then dividing this total by the total of the weights.
How It Works
The steps required to calculate a weighted average are:
Step 1: Sum every piece of data multiplied by its associated weight.
Step 2: Sum the total weight.
Step 3: Calculate the weighted average using Formula 3.4.
Let’s stay with the illustration of the math and communications courses and your GPA. Assume that these are the only two courses you are taking. You finish the math course with an A, translating into a grade point of 4.0. In the communications course, your C+ translates into a 2.5 grade point. These courses have five and three credit hours, respectively. Since they are not equally important, you use a weighted average.
Step 1: In the numerator, sum the products of each course's credit hours (the weight) and your grade point (the data). This means (math credit hours × math grade point) + (communications credit hours × communications grade point). Numerically, this is \(\sum WX=(5 \times 4)+(3 \times 2.5)=27.5\).
Step 2: In the denominator, sum the weights. These are the credit hours. You have \(\sum W=5+3=8\).
Step 3: Apply Formula 3.4 to calculate your GPA.
\(\text { WAvg }=\dfrac{27.5}{8}=3.44\) (GPAs have two decimals).
Note that your GPA is higher than if you had just calculated a simple average of \(\dfrac{4+2.5}{2}=3.25\). This happens because your math course, in which you scored a higher grade, was more important in the calculation.
Things To Watch Out For
The most common error in weighted averages is to confuse the data with the weight. If you have the two backwards, your numerator is still correct; however, your denominator is incorrect. To distinguish the data from the weight, notice that the data forms a part of the question. In the above example, you were looking to calculate your grade point average; therefore, grade point is the data. The other information, the credit hours, must be the weight.
Paths To Success
The formula used for calculating a simple average is a simplification of the weighted average formula. In a simple average, every piece of data is equally important. Therefore, you assign a value of 1 to the weight for each piece of data. Since any number multiplied by 1 is the same number, the simple average formula omits the weighting in the numerator as it would have produced unnecessary calculations. In the denominator, the sum of the weights of 1 is no different from counting the total number of pieces of data. In essence, you can use a weighted average formula to solve simple averages.
In each of the following, determine which information is the data and which is the weight.
- Rafiki operates a lemonade stand during his garage sale today. He has sold 13 small drinks for $0.50, 29 medium drinks for $0.90, and 21 large drinks for $1.25. What is the average price of the lemonade sold?
- Natalie received the results of a market research study. In the study, respondents identified how many times per week they purchased a bottle of Coca-Cola. Calculate the average number of purchases made per week.
| Purchases per Week | # of People |
|---|---|
| 1 | 302 |
| 2 | 167 |
| 3 | 488 |
| 4 | 256 |
- Answer
-
- The price of the drinks is the data, and the number of drinks is the weight.
- The purchases per week is the data, and the number of people is the weight.
A mark transcript received by a student at a local college. The chart shows how the grade translates into a grade point.
| Course | Grade | Credit hours |
|---|---|---|
| Economics 100 | B | 4 |
| Math 100 | A | 5 |
| Marketing 100 | B+ | 3 |
| Communications 100 | C | 4 |
| Computing 100 | A+ | 3 |
| Accounting 100 | D | 4 |
| Grade | Grade Point |
|---|---|
| A+ | 4.5 |
| A | 4.0 |
| B+ | 3.5 |
| B | 3.0 |
| C+ | 2.5 |
| C | 2.0 |
| D | 1.0 |
| F | 0.0 |
Calculate the student's grade point average (GPA). Round your final answer to two decimals.
Solution
The courses do not carry equal weights as they have different credit hours. Therefore, to calculate the GPA you must find a weighted average, or \(\text{WAvg}\).
What You Already Know
Since the question asked for the grade point average, the grade points for each course are the data, or \(X\). The corresponding credit hours are the weights, or \(W\).
How You Will Get There
You need to convert the grade for each course into a grade point using the secondary table. Then perform the following steps:
Step 1: Sum every piece of data multiplied by its associated weight.
Step 2: Sum the total weight.
Step 3: Calculate the weighted average using Formula 3.4.
Perform
Convert the grades:
| Course | Grade | Grade Point | Credit hours |
|---|---|---|---|
| Economics 100 | B | 3.0 | 4 |
| Math 100 | A | 4.0 | 5 |
| Marketing 100 | B+ | 3.5 | 3 |
| Communications 100 | C | 2.0 | 4 |
| Computing 100 | A+ | 4.5 | 3 |
| Accounting 100 | D | 1.0 | 4 |
Step 1:
\[\sum WX=(4 \times 3.0)+(5 \times 4.0)+(3 \times 3.5)+(4 \times 2.0)+(3 \times 4.5)+(4 \times 1.0)=68\nonumber \]
Step 2:
\[\sum w=4+5+3+4+3+4=23\nonumber \]
Step 3:
\[\text { WAvg }=\dfrac{68}{23}=2.96\nonumber \]
The student's GPA is 2.96. Note that math contributed substantially (almost one-third) to the student's grade point because this course was weighted heavily and the student performed well.
Angelika started the month of March owing $20,000 on her home equity line of credit (HELOC). She made a payment of $5,000 on the fifth, borrowed $15,000 on the nineteenth, and made another payment of $5,000 on the twenty-sixth. Using each day's closing balance for your calculations, what was the average balance in the HELOC for the month of March?
Solution
The balance owing in Angelika’s HELOC is not equal across all days in March. Some balances were carried for more days than others. This means you will need to use the weighted average technique and find \(\text{WAvg}\).
What You Already Know
You know the following:
| Dates | Number of Days (\(W\)) | Balance in HELOC (\(X\)) |
|---|---|---|
| March 1–March 4 | 4 | $20,000 |
| March 5–March 18 | 14 | $20,000 − $5,000 = $15,000 |
| March 19–March 25 | 7 | $15,000 + $15,000 = $30,000 |
| March 26–March 31 | 6 | $30,000 − $5,000 = $25,000 |
How You Will Get There
Step 1: Sum every piece of data multiplied by its associated weight.
Step 2: Sum the total weight.
Step 3: Calculate the weighted average using Formula 3.4.
Perform
Step 1:
\[\sum WX=(4 \times \$ 20,000)+(14 \times \$ 15,000)+(7 \times \$ 30,000)+(6 \times \$ 25,000)=\$ 650,000\nonumber \]
Step 2:
\[\sum W=4+14+7+6=31\nonumber \]
Step 3:
\[\text{WAvg}=\dfrac{\$ 650,000}{31}=\$ 20,967.74\nonumber \]
Over the entire month of March, the average balance owing in the HELOC was $20,967.74. Note that the balance with the largest weight (March 5 to March 18) and the largest balance owing (March 19 to March 25) account for almost two-thirds of the calculated average.
Geometric Averages
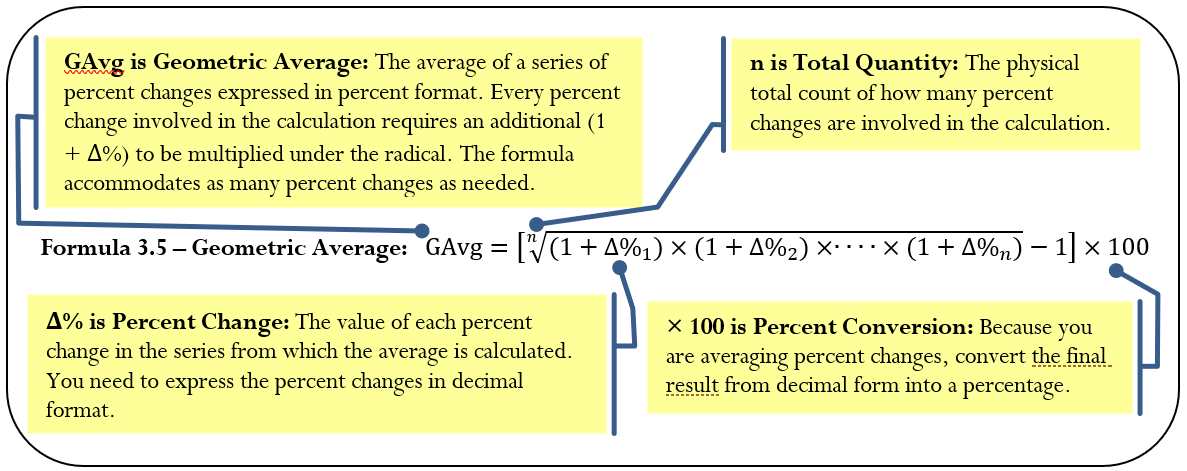
How do you average a percent change? If sales increase 100% this year and decrease 50% next year, is the average change in sales an increase of \(\dfrac{(100 \%-50 \%)}{2}=25 \%\) per year? The answer is clearly “no.” If sales last year were $100 and they increased by 100%, that results in a $100 increase. The total sales are now $200. If sales then decreased by 50%, you have a $100 decrease. The total sales are now $100 once again. In other words, you started with $100 and finished with $100. That is an average change of nothing, or 0% per year! Notice that the second percent change is, in fact, multiplied by the result of the first percent change. A geometric average finds the typical value for a set of numbers that are meant to be multiplied together or are exponential in nature.
The Formula
In business mathematics, you most commonly use a geometric average to average a series of percent changes. Formula 3.5 is specifically written to address this situation.
How It Works
To calculate a geometric average follow these steps:
Step 1: Identify the series of percent changes to be multiplied.
Step 2: Count the total number of percent changes involved in the calculation.
Step 3: Calculate the geometric average using Formula 3.5.
Let’s use the sales data presented above, according to which sales increase 100% in the first year and decrease 50% in the second year. What is the average percent change per year?
Step 1: The changes are \(\Delta \%_{1}=+100 \%\) and \(\Delta \%=-50 \%\).
Step 2: Two changes are involved, or \(n = 2\).
Step 3: Apply Formula 3.5:
\[\begin{aligned}
\text { GAvg } &=\left [\sqrt[2]{(1+100 \%) \times(1-50 \%)}-1 \right ] \times 100 \\
&=\left [\sqrt[2]{2 \times 0.5}-1\right ] \times 100\\
&=[\sqrt[2]{1}-1] \times 100 \\
&=0 \times 100=0 \%
\end{aligned} \nonumber \]
The average percent change per year is 0% because an increase of 100% and a decrease of 50% cancel each other out.
Important Notes
A critical requirement of the geometric average formula is that every \((1+\Delta \%)\) expression must result in a number that is positive. This means that the \(\Delta \%\) cannot be a value less than -100% else Formula 3.5 cannot be used.
Paths To Success
An interesting characteristic of the geometric average is that it will always produce a number that is either smaller than (closer to zero) or equal to the simple average. In the example, the simple average of +100% and -50% is 25%, and the geometric average is 0%. This characteristic can be used as an error check when you perform these types of calculations.
For the first three questions, determine whether you should calculate a simple, weighted, or geometric average.
- Randall bowled 213, 245, and 187 in his Thursday night bowling league and wants to know his average.
- Cindy invested in a stock that increased in value annually by 5%, 6%, 3%, and 5%. She wants to know her average increase.
- A retail store sold 150 bicycles at the regular price of $300 and 50 bicycles at a sale price of $200. The manager wants to know the average selling price.
- Gonzalez has calculated a simple average of 50% and a geometric average of 60%. He believes his numbers are correct. What do you think?
- Answer
-
- Simple; each item has equal importance and frequency.
- Geometric; these are a series of percent changes on the price of stock.
- Weighted; each item has a different frequency.
- At least one of the numbers is wrong since a geometric average is always smaller than or equal to the simple average.
From 2006 to 2010, WestJet’s year-over-year annual revenues changed by +21.47%, +19.89%, -10.55%, and +14.38%. This reflects growth from sales of $1.751 billion in 2006 to $2.609 billion in 2010.[1] What is the average percent growth in revenue for WestJet during this time frame?
Solution
Note that these numbers reflect percent changes in revenue. Year-over-year changes are multiplied together, so you would calculate a geometric average, or \(\text{GAvg}\).
What You Already Know
Step 1:
You know the four percent changes:
\[\Delta \%_{1}=21.47 \% \quad \Delta \%_{2}=19.89 \% \quad \Delta \%_{3}=-10.55 \% \quad \Delta \%_{4}=14.38 \%\nonumber \]
Step 2:
Four changes are involved, or \(n = 4\).
How You Will Get There
Step 3:
Express the percent changes in decimal format and substitute into Formula 3.5.
Perform
Step 3:
\[\text { GAvg }=\left [\sqrt[4]{(1+0.2147) \times(1+0.1989) \times(1-0.1055) \times(1+0.1438)}-1 \right ] \times 100=10.483 \%\nonumber \]
On average, WestJet revenues have grown 10.483% each year from 2006 to 2010.
References
- WestJet, WestJet Fact Sheet, www.westjet.com/pdf/investorMedia/investorFactSheet.pdf (accessed May 10, 2011).