
7.1: Slope of a Line
- Page ID
- 45195
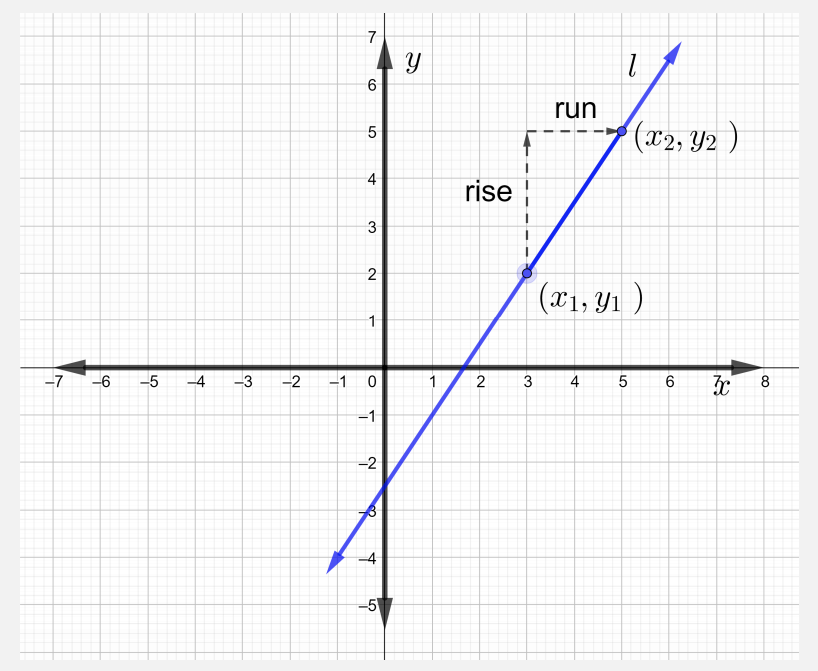
Recall that ordered pairs can be graphed as points in the rectangular coordinate plane. Through any two distinct points, graph a straight line, \(l\).
To describe line \(l\) algebraically, first consider the slope of a line formula.
The slope \(m\) of a line \(l\) that passes through points \((x_1, y_1)\) and \((x_2, y_2)\) is
\[m = \dfrac{\text{rise}}{\text{run}} = \dfrac{y_2 − y_1}{x_2 − x_1} \text{ where } x_2 \neq x_1 \nonumber \]
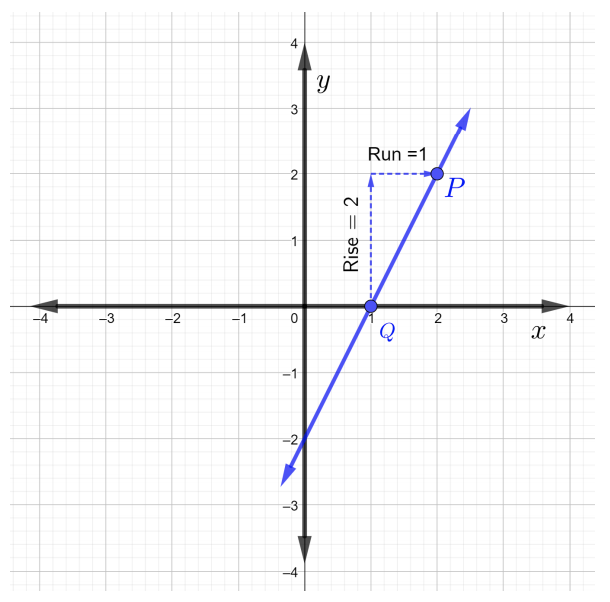
Find the slope of the line in the figure below.
Solution
By the above definition of the slope of the line formula, the slope of the line can be written as \(m = \dfrac{\text{rise}}{\text{run}}\). Start by choosing any two points, \(P\) and \(Q\), on the line. Choose point \(P\) to be \((2, 2)\) and point \(Q\) to be \((1, 0)\).
Starting at point \(Q\), rise up to point \(P\) by counting upward \(2\) grid squares, which means \(\text{rise} = 2\). Now, to arrive to point \(P\), \(\text{run}\) \(1\) grid square to the right, which means that \(\text{run} = 1\), as shown in the figure below.
Thus,
\(\begin{array} &&m = \dfrac{\text{rise}}{\text{run}} &\text{slope of a line formula} \\ &= \dfrac{2}{1} &\text{rise \(2\) and run \(1\)} \\ &= 2 \end{array}\)
Therefore, the slope of the line in the figure is \(m = 2\).
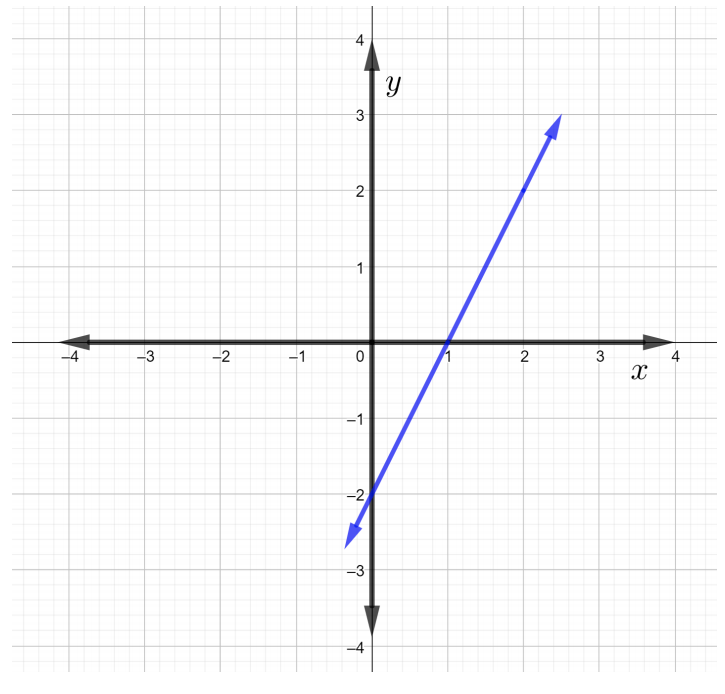
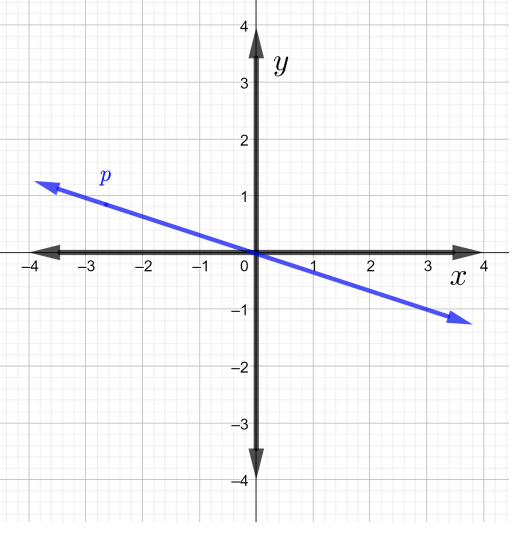
Find the slope of the line shown in the figure below.
Solution
Similar to Example \(1\), start by choosing any two points, \(P\) and \(Q\), on the line.
Note: Since any \(2\) points on the line can be chosen, it will be easier to choose the two points that are integers. Those points are located on the line and also on the intersection of two grid lines. For example, in the figure it will be easier to choose any two of the following points on the given line: \((2, 0)\), \((0, 1)\), \((4, −1)\), \((6, −2)\), \((−4, 3)\), \((−6, 4)\), and so on ...
The slope is the same for any two points \(P\) and \(Q\) on the line. Choose point \(P_1\) to be \((0, 1)\) and point \(Q_1\) to be \((2, 0)\). Starting at point \(P_1\), reach point \(Q_1\) by first running \(2\) grid squares to the right, which means that the \(\text{run} = 2\). Now, to arrive to point \(Q_1\) count downward \(1\) grid square. Notice, that the \(\text{rise} = -1\) which means to move down \(1\) unit as shown in the figure below.
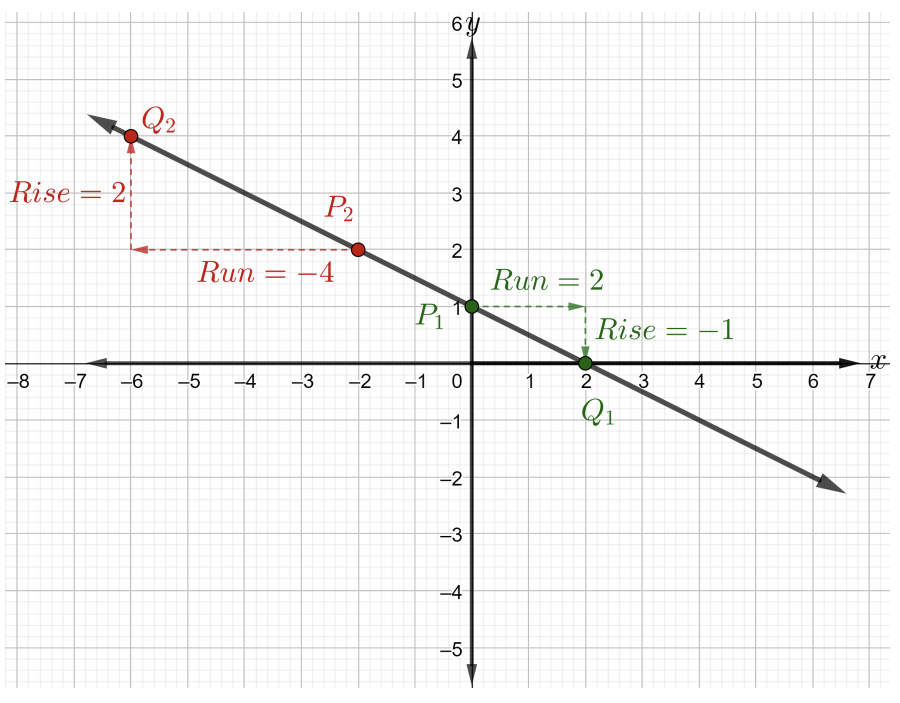
\(\begin{array} &&m = \dfrac{\text{rise}}{\text{run}} &\text{slope of a line formula} \\ &= \dfrac{−1}{2} &\text{rise = \(-1\) and run = \(2\)} \end{array}\)
Therefore, the slope of the line in the figure above is \(m = −\dfrac{1}{2}\).
Now, choose point \(P_2\) to be \((-2, 2)\) and point \(Q_2\) to be \((-6, 4)\) as shown in the above figure. Starting at points \(P_2\), reach point \(Q_2\) by first running \(4\) grid squares to the left, which means that the \(\text{run} = -4\). Now, to arrive to point \(Q_2\) count upward \(2\) grid squares. Thus, the \(\text{rise} = 2\). The slope is \(m = \dfrac{2}{−4} = −\dfrac{1}{2}\). Notice, the slope is the same regardless of which \(2\) points we consider on a given line.
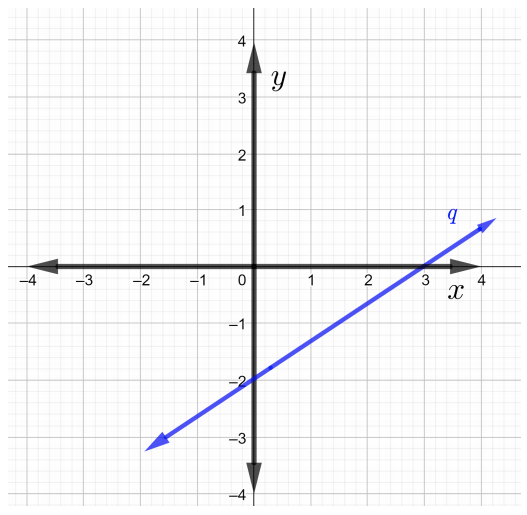
Find the slope of the line that passes through \((3, 2)\) and \((4, 4)\) using the slope formula. Graph the line that passes through the given points.
Note: The order the points are labeled will make no difference in the slope of a line formula as long as there is consistency.
Solution
Let \((x_1, y_1) = (3, 2)\) and \((x_2, y_2) = (4, 4)\) then,
\(\begin{array} &&m = \dfrac{y_2 − y_1}{x_2 − x_1} &\text{slope of a line formula} \\ &= \dfrac{4 − 2}{4 − 3} & \\ &= \dfrac{2}{1} &\text{rise \(= 2\) and run \(= 1\)} \\ &= 2 & \end{array}\)
Therefore, the slope of the line passing through points \((3, 2)\) and \((4, 4)\) is \(m = 2\). The line that passes through the given points is as shown in the figure below.
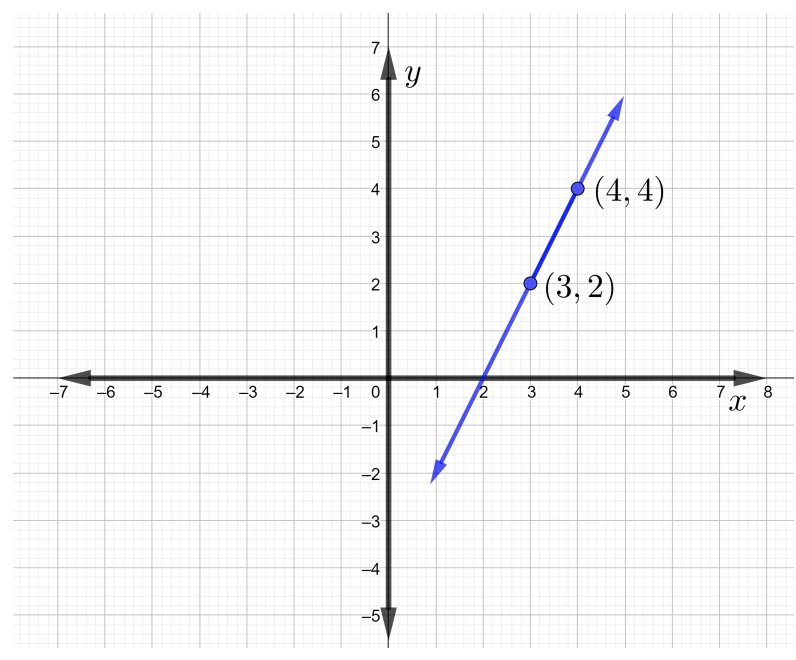
Notice that when the line rises from left to right, the line has a positive slope.
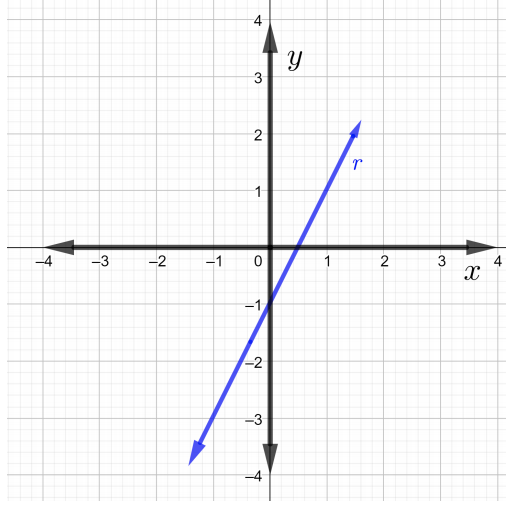
Find the slope of the line that passes through the points \((−1, 2)\) and \((3, −4)\). Plot the points and graph the line.
Solution
Let \((x_1, y_1) = (-1, 2)\) and \((x_2, y_2) = (3, -4)\) then,
\(\begin{array} &&m = \dfrac{y_2 − y_1}{x_2 − x_1} &\text{slope of a line formula} \\ &= \dfrac{-4 − 2}{3 − (-1)} & \\ &= \dfrac{-6}{4} &\text{Simplify} \\ &= -\dfrac{3}{2} & \end{array}\)
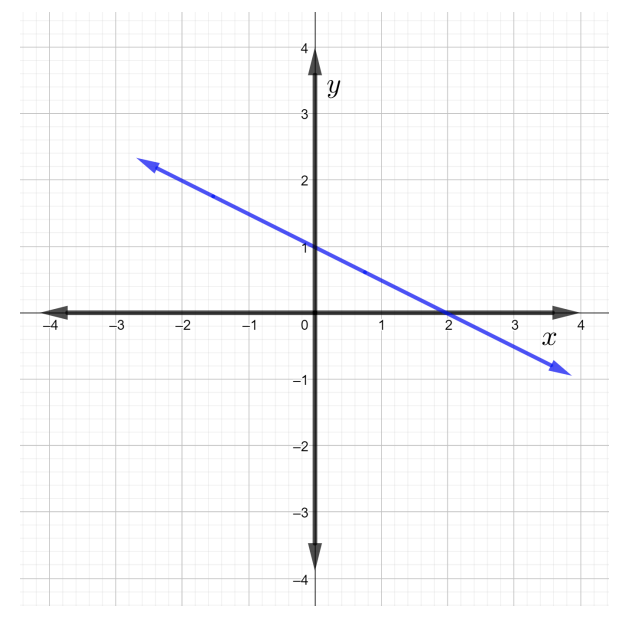
Now, to graph the line through the given points, first plot the two points, then draw a straight line through them, as shown in the Figure below.
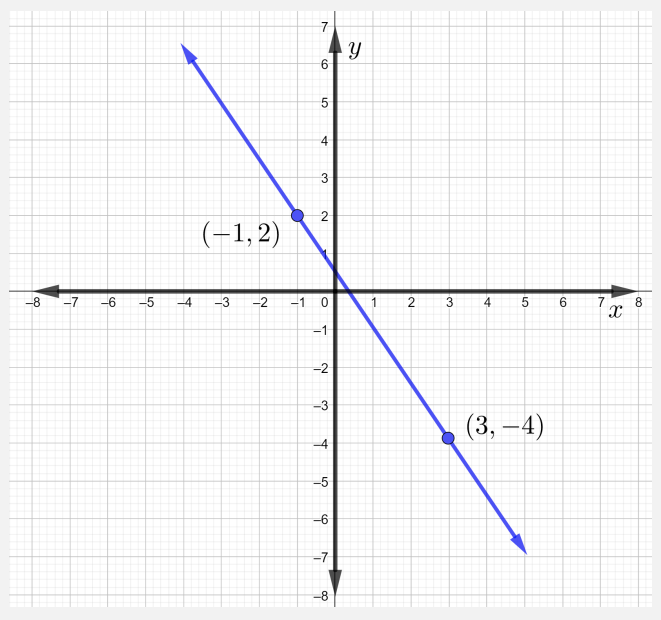
Notice that when the line falls from left to right, the line has a negative slope.
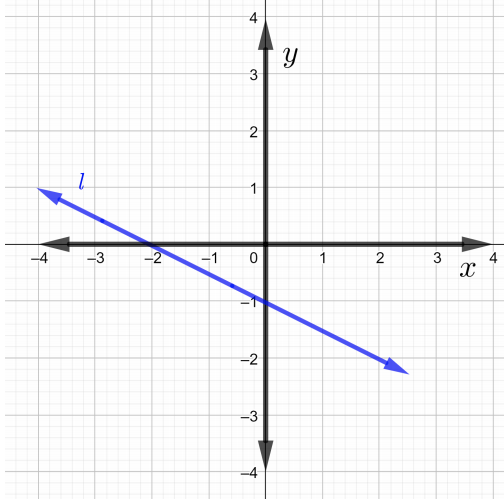
Find the slopes of each line in the graph in Problems \(1\) through \(4\)
Find the slope of the line that passes through the given points in Problems \(5\) through \(7\).
- \((−3, 5)\) and \((4, −5)\)
- \((2, 5)\) and \((0, −1)\)
- \((4, 1)\) and \((0, 0)\)