
5.7: Functions
- Page ID
- 129559

\( \newcommand{\vecs}[1]{\overset { \scriptstyle \rightharpoonup} {\mathbf{#1}} } \)
\( \newcommand{\vecd}[1]{\overset{-\!-\!\rightharpoonup}{\vphantom{a}\smash {#1}}} \)
\( \newcommand{\dsum}{\displaystyle\sum\limits} \)
\( \newcommand{\dint}{\displaystyle\int\limits} \)
\( \newcommand{\dlim}{\displaystyle\lim\limits} \)
\( \newcommand{\id}{\mathrm{id}}\) \( \newcommand{\Span}{\mathrm{span}}\)
( \newcommand{\kernel}{\mathrm{null}\,}\) \( \newcommand{\range}{\mathrm{range}\,}\)
\( \newcommand{\RealPart}{\mathrm{Re}}\) \( \newcommand{\ImaginaryPart}{\mathrm{Im}}\)
\( \newcommand{\Argument}{\mathrm{Arg}}\) \( \newcommand{\norm}[1]{\| #1 \|}\)
\( \newcommand{\inner}[2]{\langle #1, #2 \rangle}\)
\( \newcommand{\Span}{\mathrm{span}}\)
\( \newcommand{\id}{\mathrm{id}}\)
\( \newcommand{\Span}{\mathrm{span}}\)
\( \newcommand{\kernel}{\mathrm{null}\,}\)
\( \newcommand{\range}{\mathrm{range}\,}\)
\( \newcommand{\RealPart}{\mathrm{Re}}\)
\( \newcommand{\ImaginaryPart}{\mathrm{Im}}\)
\( \newcommand{\Argument}{\mathrm{Arg}}\)
\( \newcommand{\norm}[1]{\| #1 \|}\)
\( \newcommand{\inner}[2]{\langle #1, #2 \rangle}\)
\( \newcommand{\Span}{\mathrm{span}}\) \( \newcommand{\AA}{\unicode[.8,0]{x212B}}\)
\( \newcommand{\vectorA}[1]{\vec{#1}} % arrow\)
\( \newcommand{\vectorAt}[1]{\vec{\text{#1}}} % arrow\)
\( \newcommand{\vectorB}[1]{\overset { \scriptstyle \rightharpoonup} {\mathbf{#1}} } \)
\( \newcommand{\vectorC}[1]{\textbf{#1}} \)
\( \newcommand{\vectorD}[1]{\overrightarrow{#1}} \)
\( \newcommand{\vectorDt}[1]{\overrightarrow{\text{#1}}} \)
\( \newcommand{\vectE}[1]{\overset{-\!-\!\rightharpoonup}{\vphantom{a}\smash{\mathbf {#1}}}} \)
\( \newcommand{\vecs}[1]{\overset { \scriptstyle \rightharpoonup} {\mathbf{#1}} } \)
\(\newcommand{\longvect}{\overrightarrow}\)
\( \newcommand{\vecd}[1]{\overset{-\!-\!\rightharpoonup}{\vphantom{a}\smash {#1}}} \)
\(\newcommand{\avec}{\mathbf a}\) \(\newcommand{\bvec}{\mathbf b}\) \(\newcommand{\cvec}{\mathbf c}\) \(\newcommand{\dvec}{\mathbf d}\) \(\newcommand{\dtil}{\widetilde{\mathbf d}}\) \(\newcommand{\evec}{\mathbf e}\) \(\newcommand{\fvec}{\mathbf f}\) \(\newcommand{\nvec}{\mathbf n}\) \(\newcommand{\pvec}{\mathbf p}\) \(\newcommand{\qvec}{\mathbf q}\) \(\newcommand{\svec}{\mathbf s}\) \(\newcommand{\tvec}{\mathbf t}\) \(\newcommand{\uvec}{\mathbf u}\) \(\newcommand{\vvec}{\mathbf v}\) \(\newcommand{\wvec}{\mathbf w}\) \(\newcommand{\xvec}{\mathbf x}\) \(\newcommand{\yvec}{\mathbf y}\) \(\newcommand{\zvec}{\mathbf z}\) \(\newcommand{\rvec}{\mathbf r}\) \(\newcommand{\mvec}{\mathbf m}\) \(\newcommand{\zerovec}{\mathbf 0}\) \(\newcommand{\onevec}{\mathbf 1}\) \(\newcommand{\real}{\mathbb R}\) \(\newcommand{\twovec}[2]{\left[\begin{array}{r}#1 \\ #2 \end{array}\right]}\) \(\newcommand{\ctwovec}[2]{\left[\begin{array}{c}#1 \\ #2 \end{array}\right]}\) \(\newcommand{\threevec}[3]{\left[\begin{array}{r}#1 \\ #2 \\ #3 \end{array}\right]}\) \(\newcommand{\cthreevec}[3]{\left[\begin{array}{c}#1 \\ #2 \\ #3 \end{array}\right]}\) \(\newcommand{\fourvec}[4]{\left[\begin{array}{r}#1 \\ #2 \\ #3 \\ #4 \end{array}\right]}\) \(\newcommand{\cfourvec}[4]{\left[\begin{array}{c}#1 \\ #2 \\ #3 \\ #4 \end{array}\right]}\) \(\newcommand{\fivevec}[5]{\left[\begin{array}{r}#1 \\ #2 \\ #3 \\ #4 \\ #5 \\ \end{array}\right]}\) \(\newcommand{\cfivevec}[5]{\left[\begin{array}{c}#1 \\ #2 \\ #3 \\ #4 \\ #5 \\ \end{array}\right]}\) \(\newcommand{\mattwo}[4]{\left[\begin{array}{rr}#1 \amp #2 \\ #3 \amp #4 \\ \end{array}\right]}\) \(\newcommand{\laspan}[1]{\text{Span}\{#1\}}\) \(\newcommand{\bcal}{\cal B}\) \(\newcommand{\ccal}{\cal C}\) \(\newcommand{\scal}{\cal S}\) \(\newcommand{\wcal}{\cal W}\) \(\newcommand{\ecal}{\cal E}\) \(\newcommand{\coords}[2]{\left\{#1\right\}_{#2}}\) \(\newcommand{\gray}[1]{\color{gray}{#1}}\) \(\newcommand{\lgray}[1]{\color{lightgray}{#1}}\) \(\newcommand{\rank}{\operatorname{rank}}\) \(\newcommand{\row}{\text{Row}}\) \(\newcommand{\col}{\text{Col}}\) \(\renewcommand{\row}{\text{Row}}\) \(\newcommand{\nul}{\text{Nul}}\) \(\newcommand{\var}{\text{Var}}\) \(\newcommand{\corr}{\text{corr}}\) \(\newcommand{\len}[1]{\left|#1\right|}\) \(\newcommand{\bbar}{\overline{\bvec}}\) \(\newcommand{\bhat}{\widehat{\bvec}}\) \(\newcommand{\bperp}{\bvec^\perp}\) \(\newcommand{\xhat}{\widehat{\xvec}}\) \(\newcommand{\vhat}{\widehat{\vvec}}\) \(\newcommand{\uhat}{\widehat{\uvec}}\) \(\newcommand{\what}{\widehat{\wvec}}\) \(\newcommand{\Sighat}{\widehat{\Sigma}}\) \(\newcommand{\lt}{<}\) \(\newcommand{\gt}{>}\) \(\newcommand{\amp}{&}\) \(\definecolor{fillinmathshade}{gray}{0.9}\)- Use function notation.
- Determine if a relation is a function with different representations.
- Apply the vertical line test.
- Determine the domain and range of a function.
In this section, we will learn about relations and functions. As we go about our daily lives, we have many data items or quantities that are paired to our names. Our social security number, student ID number, email address, phone number, and our birthday are matched to our name. There is a relationship between our name and each of those items. When your teacher gets their class roster, the names of all the students in the class are listed in one column and then the student ID number is likely to be in the next column. If we think of the correspondence as a set of ordered pairs, where the first element is a student name and the second element is that student’s ID number, we call this a relation.
(Student name, Student ID #)
The set of all the names of the students in the class is called the domain of the relation and the set of all student ID numbers paired with these students is the range of the relation. In general terms, a relation is any set of ordered pairs, (). All the \(x\)-values in the ordered pairs together make up the domain. All the -values in the ordered pairs together make up the range.
There are many situations similar to the student's name and student ID # where one variable is paired or matched with another. The set of ordered pairs that records this matching is a relation. A special type of relation, called a function, occurs extensively in mathematics. A function is a relation that assigns to each element in its domain exactly one element in the range. For each ordered pair in the relation, each \(x\)-value is matched with only one -value.
Let us look at the relation between your friends and their birthdays in Figure . Every friend has a birthday, but no one has two birthdays. It is okay for two people to share a birthday. It is okay that Danny and Stephen share July 24 as their birthday and that June and Liz share August 2. Since each person has exactly one birthday, the relation is a function.
Use Function Notation
It is very convenient to name a function; most often functions are named \(f, g, h, F, G\), or \(H\). In any function, for each \(x\)-value from the domain, we get a corresponding \(y\)-value in the range. In the function \(f\), we write this range value \(y\) as \(f(x)\). This notation \(f(x)\) is called function notation and is read "f of \(x\) " or "the value of f at \(x\)." In this case the parentheses do not indicate multiplication.
We call \(x\) the independent variable as it can be any value in the domain. We call \(y\) the dependent variable as its value depends on \(x\). Much like when you first encountered the variable \(x\), function notation may be rather unsettling. But the more you use the notation, the more familiar you become with the notation, and the more comfortable you will be with it.
Let's review the equation \(y=4 x-5\). To find the value of \(y\) when \(x=2\), we know to substitute \(x=2\) into the equation and then simplify.
| \(y=4 x-5\) | |
| Let \(x=2\). | \(\begin{array}{l}y=4 \cdot 2-5 \\ y=3\end{array}\) |
The value of the function at \(x=2\) is 3 . We do the same thing using function notation, the equation \(y=4 x-5\) can be written as \(f(x)=4 x-5\). To find the value when \(x=2\), we write:
| \(f(x)=4 x-5\) | |
| Let \(x=2\). | \(\begin{array}{l}f(2)=4 \cdot 2-5 \\ f(2)=3\end{array}\) |
The value of the function at is 3. This process of finding the value of for a given value of \(x\) is called evaluating the function.
For the function \(f(x)=2 x^2+3 x-1\), evaluate the function.
- \(f(3)\)
- \(f(-2)\)
- \(f(a)\)
- Answer
-
1. To evaluate \(f(3)\), substitute 3 , for \(x\).
Simplify.
\[\begin{array}{l}
f(x)=2 x^2+3 x-1 \\
f(\mathbf{3})=2(\mathbf{3})^2+3 \cdot \mathbf{3}-1 \\
f(3)=2 \cdot 9+3 \cdot 3-1 \\
f(3)=18+9-1 \\
f(3)=26
\end{array} \nonumber \]2. To evaluate \(f(-2)\), substitute -2 for \(x\).
Simplify.
\[\begin{aligned}
f(x) & =2 x^2+3 x-1 \\
f(-2) & =2(-2)^2+3(-2)-1 \\
f(-2) & =2 \cdot 4+(-6)-1 \\
f(-2) & =8+(-6)-1 \\
f(-2) & =1
\end{aligned} \nonumber \]3. To evaluate \(f(a)\), substitute \(a\) for \(x\).
Simplify.
\[\begin{array}{l}
f(x)=2 x^2+3 x-1 \\
f(\boldsymbol{a})=2(\boldsymbol{a})^2+3 \cdot \boldsymbol{a}-1 \\
f(a)=2 a^2+3 a-1
\end{array} \nonumber \]
For the function \(f\left( x \right) = 3{x^2} - 2x + 1\), evaluate the function.
- \(f\left( 3 \right)\)
- \(f\left( { - 1} \right)\)
- \(f\left( t \right)\)
The number of unread emails in Sylvia's inbox is 75 . This number grows by 10 unread emails a day. The function \(N(t)=75+10 t\) represents the relation between the number of emails, \(N\), and the time, \(t\), measured in days. Find \(N(5)\). Explain what this result means.
- Answer
-
Find \(N(5)\). Explain what this result means.
Substitute in \(t=5\).
Simplify.\[\begin{aligned}
N(\mathbf{5}) & =75+10 \cdot \mathbf{5} \\
N(t) & =75+10 t \\
N(5) & =75+50 \\
N(5) & =125
\end{aligned} \nonumber \]If 5 is the number of days, \(N(5)\) is the number of unread emails after 5 days. After 5 days, there are 125 unread emails in Sylvia's inbox.
The number of unread emails in Bryan’s account is 100. This number grows by 15 unread emails a day. The function \(N\left( t \right) = 100 + 15t\) represents the relation between the number of emails, \(N\), and the time, \(t\), measured in days. Find \(N\)(7). Explain what the result means.
Determining If a Relation Is a Function with Different Representations
We can determine whether a relation is a function by identifying the input and the output values. If each input value leads to only one output value, classify the relation as a function. If any input value leads to two or more outputs, do not classify the relation as a function.
We will review three different representations of relations and determine if they are functions: ordered pairs, mapping, and equations.
Use the set of ordered pairs to determine whether the relation is a function.
- \(\{(-3,27),(-2,8),(-1,1),(0,0),(1,1),(2,8),(3,27)\}\)
- \(\{(9,-3),(4,-2),(1,-1),(0,0),(1,1),(4,2),(9,3)\}\)
- Answer
-
- Each \(x\)-value is matched with only one -value. This relation is a function.
- The \(x\)-value 9 is matched with two \(y\)-values, both 3 and -3. This relation is not a function.
Use the set of ordered pairs to determine whether the relation is a function.
- \(\left\{ {\left( {-3,-6} \right),\left( {-2,-4} \right),\left( {-1,-2} \right),\left( {0,0} \right),\left( {1,2} \right),\left( {2,4} \right),\left( {3,6} \right)} \right\}\)
- \(\{(8,-4),(4,-2),(2,-1),(0,0),(2,1),(4,2),(8,4)\}\)
A mapping is sometimes used to show a relation. The arrows show the pairing of the elements of the domain with the elements of the range. Consider the example of the relation between your friends and their birthdays used in Figure 5.60. In this particular example, the domain is the set of people’s names, and the range is the set of their birthdays. This mapping was a function because everybody’s name maps to exactly one birthday.
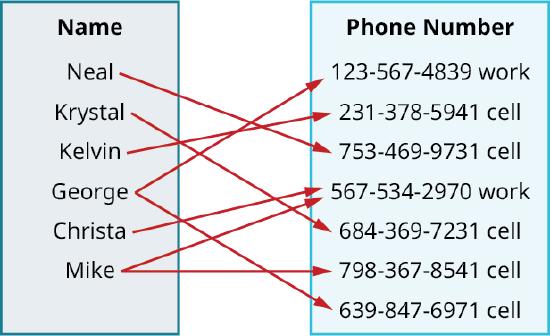
Use the mapping in Figure to determine whether the relation is a function.
- Answer
-
Both Lydia and Marty have two phone numbers. Each \(x\)-value is not matched with only one -value. This relation is not a function.
Use the mapping in the given figure to determine whether the relation is a function.
In algebra functions will usually be represented by an equation. It is easiest to see if the equation is a function when it is solved for . If each value of \(x\) results in only one value of , then the equation defines a function.
Determine whether each equation is a function. Assume \(x\) is the independent variable.
1. \(2 x+y=7\)
2. \(y=x^2+1\)
3. \(x+y^2=3\)
- Answer
-
1. \(2 x+y=7\)
For each value of \(x\), we multiply it by -2 and then add 7 to get the \(y\)-value.
For example, if \(x=3\) :\[\begin{array}{l}
y=-2 x+7 \\
y=-2 \cdot \mathbf{3}+7 \\
y=1
\end{array} \nonumber \]We have that when \(x=3\), then \(y=1\). It would work similarly for any value of \(x\). Since each value of \(x\), corresponds to only one value of \(y\) the equation defines a function.
2. \(y=x^2+1\)
For each value of \(x\), we square it and then add 1 to get the \(y\)-value.
For example, if \(x=2\)\[\begin{array}{l}
y=x^2+1 \\
y=\mathbf{2}^2+1 \\
y=5
\end{array} \nonumber \]We have that when \(x=2\), then \(y=5\). It would work similarly for any value of \(x\). Since each value of \(x\) corresponds to only one value of \(y\), the equation defines a function.
3. \(x+y^2=3\)
\[x+y^2=3 \nonumber \]
Isolate the \(y\) term.
\[y^2=-x+3 \nonumber \]
Let us substitute \(x=2\).
\[\begin{array}{l}
y^2=-\mathbf{2}+3 \\
y^2=1
\end{array} \nonumber \]This gives us two values for \(y\).
\[y=1, y=-1 \nonumber \]
We have shown that when \(x=2\), then \(y=1\) and \(y=-1\). It would work similarly for any value of \(x\). Since each value of \(x\) does not corresponds to only one value of \(y\) the equation does not define a function.
Determine whether each equation is a function.
1. \(\backslash(4 x+y=-3 \backslash)\)
2. \(\backslash\left(x+\left\{y^{\wedge} 2\right\}=1 \backslash\right)\)
3. \(\backslash\left(y-\left\{x^{\wedge} 2\right\}=2 \backslash\right)\)
Relations and Functions
Applying the Vertical Line Test
We reviewed how to determine if a relation is a function. The relations we looked at were expressed as a set of ordered pairs, a mapping, or an equation. We will now cover how to tell if a graph is that of a function.
An ordered pair \((x, y)\) is a solution of a linear equation, if the equation is a true statement when the \(x\)-values and \(y\) -values of the ordered pair are substituted into the equation. The graph of a linear equation is a straight line where every point on the line is a solution of the equation, and every solution of this equation is a point on this line. Figure
A relation is a function if every element of the domain has exactly one value in the range. The relation defined by the equation vertical line test, which states that a set of points in a rectangular coordinate system is the graph of a function if every vertical line intersects the graph in at most one point. If any vertical line intersects the graph in more than one point, the graph does not represent a function.
Determine whether the graph (Figure ) is the graph of a function applying the vertical line test.
- Answer
-
On the graph (Figure ), only three vertical dashed lines are drawn. However, it can be determined that any vertical dashed line that is drawn will intersect the solid line at exactly one point. It is the graph of a function.
Figure
Determine whether the graph is the graph of a function.

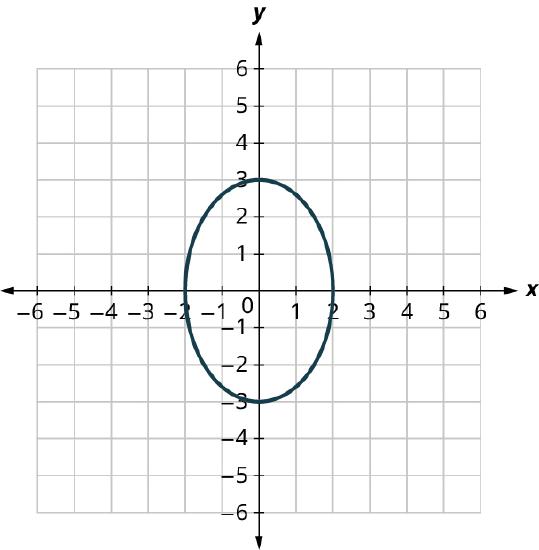
Determine whether the graph is the graph of a function (Figure ).
Determine whether the graph is the graph of a function.
Determining the Domain and Range of a Function
For the function \( y = f(x)\), \(x\) is the independent variable as it can be any value in the domain, and \(y\) is the dependent variable since its value depends on \(x\). For the function \( y = f(x)\), the values of \(x\) make up the domain and the values of \(y\) make up the range.
For \(\{(1,1),(2,4),(3,9),(4,16),(5,25)\}\):
- Find the domain of the relation.
- Find the range of the relation.
- Answer
-
1. The domain is the set of all \(x\)-values of the relation: \(\{1,2,3,4,5\}\)
2. The range is the set of all \(y\)-values of the relation: \(\{1,4,9,16,25\}\)
For the relation \(\left\{ {\left( {1,1} \right),\left( {2,8} \right),\left( {3,27} \right),\left( {4,64} \right),\left( {5,125} \right)} \right\}\):
- Find the domain of the relation.
- Find the range of the relation.
Use Figure \(\PageIndex{11}\) to:
- List the ordered pairs of the relation.
- Find the domain of the relation.
- Find the range of the relation.
- Answer
-
1. The ordered pairs of the relation are: \(\{(1,5),(-3,-1),(4,-2),(0,3),(2,-2),(-3,4)\}\).
2. The domain is the set of all \(x\)-values of the relation: \(\{-3,0,1,2,4\}\). Notice that while -3 repeats, it is only listed once.
3. The range is the set of all \(y\)-values of the relation: \(\{-2,-1,3,4,5\}\). Notice that while -2 repeats, it is only listed once.
Use the given figure to:
- List the ordered pairs of the relation.
- Find the domain of the relation.
- Find the range of the relation.

Domain and Range on Graphs
In 1673, Gottfried Leibniz, the German mathematician who co-invented calculus, seems to be the first person to use the word function in a mathematical sense, although his use of it does not exactly fit with the modern use and definition. The person who is credited with the modern definition of function is Swiss mathematician Johann Bernoulli, who wrote about it in a letter to Leibniz in 1698. Supposedly, Leibniz wrote Bernoulli back, approving of this use of the word. In 1734, the use of the notation for a function was first used by Swiss mathematician Leonhard Euler (pronounced “Oiler”). Euler had a knack for inventing notation. He also introduced the notation for the base of natural logs (1727), for the square root of (1777), for summation (1755), and many others. Euler also introduced many other ideas associated with functions. Euler defined exponential functions and defined logarithmic functions as their inverse; he also introduced the beta and gamma functions, and was the first person to consider the trigonometric identities (sine, cosine, etc.) as functions.
Check Your Understanding
-
True
-
False
-
True
-
False

-
True
-
False

-
True
-
False
-
True
-
False