
8.2.1: Measures of Center
- Page ID
- 63946

- Find the mean, median, and mode of a set of numbers.
- Find the range and midrange of a data set.
- Read and interpret data from box-and-whisker plots.
- Solve application problems that require the calculation of the mean, median, range, or midrange.
Introduction
Mean, median, and mode are important tools in the statistician’s toolbox. These measures of center all use data points to approximate and understand a “middle value” or “average” of a given data set. Two more measures of interest are the range and midrange, which use the greatest and least values of the data set to help describe the spread of the data.
So why would you need to find out the middle of a data set? And why do you need three measures instead of just one? Let’s look closely at these measures of center and learn how they can help us understand sets of data.
Mean, Median, and Mode
“Mean” is a mathematical term for “average” which you may already know. Also referred to as the “arithmetic mean,” it is found by adding together all the data values in a set and dividing that sum by the number of data items.
You can often find the average of two familiar numbers, such as 10 and 16, in your head without much calculation. What number lies half way between them? 13. A mathematical way to solve this, though, is to add 10 and 16 (which gives you 26) and then divide by 2 (since there are 2 numbers in the data set). \(\ 26 \div 2=13\)
Knowing the process helps when you need to find the mean of more than two numbers. For example, if you are asked to find the mean of the numbers 2, 5, 3, 4, 5, and 5, first find the sum: 2 + 5 + 3 + 4 + 5 + 5 = 24. Then, divide this sum by the number of numbers in the set, which is 6. So the mean of the data is \(\ 24 \div 6\), or 4.
In the previous data set, notice that the mean was 4 and that the set also contained a value of 4. This does not always occur. In the example that follows, the mean is 18, although 18 is not in the data set at all.
Find the mean of the set: 4, 7, 28, 33.
Solution
| \(\ 4+7+28+33=72\) | Add all the values. |
| \(\ \frac{72}{4}=18\) | Divide by 4, the number of values. |
The mean is 18.
Next, let’s look at the “median.” The median is the middle value when the data is ordered. If there are two middle values, the median is the average of the two middle values.
To calculate the median, you first put your data into numerical order from least to greatest. Then identify the middle value(s).
For example, let’s look at the following values: 4, 5, 1, 3, 2, 7, 6. To find the median of this set, you would put it in order from least to greatest.
\(\ \begin{array}{lllllll}
1 & 2 & 3 & \bf4 & 5 & 6 & 7
\end{array}\)
Then identify the middle value. There are three values to the right of four and three values to the left of four. The middle value is 4, so 4 is the median.
If there is an even number of data items, however, the median will be the mean of the two center data items.
Find the median of the set: 2, 5, 3, 4, 5, 5
Solution
| \(\ 2,3,4,5,5,5\) | Arrange the values from least to greatest. |
|
\(\ 2,3, \mathbf{4}, \mathbf{5}, 5,5\) \(\ \frac{9}{2}=4.5\) |
The set has 2 middle values, 4 and 5. So take the mean (average) of the two values. |
The median is 4.5.
Finally, let’s consider the “mode.” The mode is found by looking for the data value that appears most often. If there is a two-way tie for most often, the data is bimodal and you use both data values as the modes. Sometimes there is no mode. This happens when there is no data value that occurs most often. In our example data set (2, 3, 4, 5, 5, 5), the number 5 appears 3 times and all other numbers appear once, so the mode is 5.
Find the mode of the set: 12, 4, 12, 5, 5, 8, 12, 0, 1, 12
Solution
| 0, 1, 4, 5, 5, 8, 12, 12, 12, 12 | Arrange the values from least to greatest (although this is not a necessary step, it sometimes helps to find the mode if the numbers are arranged in ascending order). |
| 0, 1, 4, 5, 5, 8, 12, 12, 12, 12 | 0, 1, 4, 5, 5, 8, 12, 12, 12, 12 |
The mode is 12.
Let’s look at an example with some relevant data.
Carlos received the following scores on his mathematics exams: 84, 92, 74, 98, and 82. Find the mean, median, and mode of his scores.
Solution
| \(\ \frac{84+92+74+98+82}{5}\) | To find the mean, add all the test scores together and divide by the number of tests. |
| \(\ \frac{430}{5}=86\) | The mean is 86. |
| \(\ 74,82,84,92,98\) | To find the median, order the test scores from least to greatest. |
| \(\ 84\) | There are five scores, so the middle test score is the third in the ordered list. This is the median. |
| \(\ 74,82,84,92,98\) | Since each number appears exactly one time, there is no mode. |
The mean is 86.
The median is 84.
There is no mode.
What can be learned from the mean, median, and mode of Carlos’ test scores? Notice that these values are not the same.
Both the mean and the median give us a picture of how Carlos is doing. Looking at these measures, you notice that the middle of the data set is in the mid-80s: the mean value is 86, and the median value is 84. That’s all you are really after when using median and mean: finding the center, or middle, of the data. Notice, also, that there is no mode, since Carlos did not score the same on two tests. In the case of test taking, the mode is often meaningless, unless there are a lot of 0s, which could mean that the student didn’t do his homework, or really doesn’t know what’s going on!
Find the mean, median, and mode of the following set of numbers: 12, 11, 13, 11, 12, 10, 10, 11, 13, 14
Solution
| \(\ \frac{12+11+13+11+12+10+10+11+13+14}{10}=\frac{117}{10}=11.7\) | To find the mean, add together all the numbers and divide that sum by the number of numbers. |
| \(\ 10,10,11,11,11,12,12,13,13,14\) | To find the median, first order the numbers from least to greatest. |
| \(\ \frac{11+12}{2}=\frac{23}{2}=11.5\) | Since there are 10 numbers (an even number) the median is the mean of the middle two numbers (the 5th and 6th), or halfway between 11 and 12. |
| \(\ 10,10, \mathbf{1 1}, \mathbf{1 1}, \mathbf{1 1}, 12,12,13,13,14\) | To find the mode, look for the number that appears most often. |
| \(\ 11\) | The number 11 appears most often, 3 times. |
The mean is 11.7.
The median is 11.5.
The mode is 11.
In this case, the mean, median, and mode are very close in value. This shows some consistency in the data, with a middle (average) value of about 11. If this data represented the ages of students on a chess team, for example, you would have a good idea that everyone on the team was about 11 years old, with a few older and younger members.
During a seven-day period in July, a meteorologist recorded that the median daily high temperature was 91o.
Which of the following are true statements?
- The high temperature was exactly 91o on each of the seven days.
- The high temperature was never lower than 92o.
- Half the high temperatures were above 91o and half were below 91o.
- 1 only
- 2 only
- 3 only
- 1, 2, and 3
- Answer
-
- Incorrect. Just because the median high was 91o does not mean that the temperature reached 91o on each day. The correct answer is statement 3 only.
- Incorrect. You know the median is 91o, so 91o is a member of the data set, meaning that the temperature had to have been lower than 92o at least one time during the week. The correct answer is statement 3 only.
- Correct. Half of the high temperatures were above 91o and half were below 91o since the median will always represent the value where half the data is higher and half the data is lower.
- Incorrect. Statement 1 is incorrect because a median high of 91o does not necessarily mean that the temperature reached 91o on each day. Statement 2 is incorrect because you know that the median is 91o, so 91o is a member of the data set, meaning that the temperature had to have been lower than 92o at least one time during the week. The correct answer is statement 3 only.
Range and Midrange
There are other useful measures other than mean, median, and mode to help you analyze a data set. When looking at data, you often want to understand the spread of the data: the gap between the greatest number and the least number. This is the range of the data. To find the range, subtract the least value of the data set from the greatest value. For example, in the data of 2, 5, 3, 4, 5, and 5, the least value is 2 and the greatest value is 5, so the range is 5-2, or 3.
It is also useful to know what number is mid-way between the least value and the greatest value of the data set. This number is called the midrange. To find the midrange, add together the least and greatest values and divide by two, or in other words, find the mean of the least and greatest values.
The midrange of 2, 5, 3, 4, 5, and 5 is \(\ \frac{2+5}{2}=\frac{7}{2}=3.5\).
Let’s look at a couple of examples.
Find the range and midrange for the following set of numbers: 2, 4, 7, 10, 14, 35.
Solution
| range: \(\ 35-2=33\) | Subtract the least value from the greatest value to find the range. |
| midrange: \(\ \frac{35+2}{2}=\frac{37}{2}=18.5\) | Add together the greatest value and the least value and divide by 2. |
The range is 33.
The midrange is 18.5.
Find the range and midrange for the following set of numbers: 62, 88, 20, 145, 37, 105, 93, 22.
Solution
|
least number: 20 greatest number: 145 |
Since the data set isn’t ordered from least to greatest, identify the least and greatest numbers. |
| range: 145-20=125 | Subtract the least value from the greatest value to find the range. |
| midrange: \(\ \frac{145+20}{2}=\frac{165}{2}=82.5\) | Add together the greatest value and the least value and divide by 2. |
The range is 125.
The midrange is 82.5.
Box-and Whisker-Plots
Another type of graph that you might see is called a box-and-whisker plot. These graphs provide a visual way of understanding both the range and the middle of a data set.
Here is a sample set of 15 numbers to get us started.
12, 5, 18, 20, 11, 9, 3, 5, 7, 18, 12, 15, 6, 10, 11
Creating a box-and-whisker plot from this data requires finding the median of the set. To do this, order the data.
3, 5, 5, 6, 7, 9, 10, 11, 11, 12, 12, 15, 18, 18, 20
This data set has 15 numbers, so the median will be the 8th number in the set: 11.
Finding the median of the data set essentially divides it into two: a set of numbers below the median, and a set of numbers above the median. A box-and-whisker plot requires you to find the median of these numbers as well!
Lower set: 3, 5, 5, 6, 7, 9, 10. Median: 6
Upper set: 11, 12, 12, 15, 18, 18, 20. Median: 15
So, the median of the set is 11, the median of the lower half is 6, and the median of the upper half is 15.
3, 5, 5, 6, 7, 9, 10, 11, 11, 12, 12, 15, 18, 18, 20
A box-and-whisker plot for this data set is shown here. Do you notice any similarities between the numbers above and the location of the box?
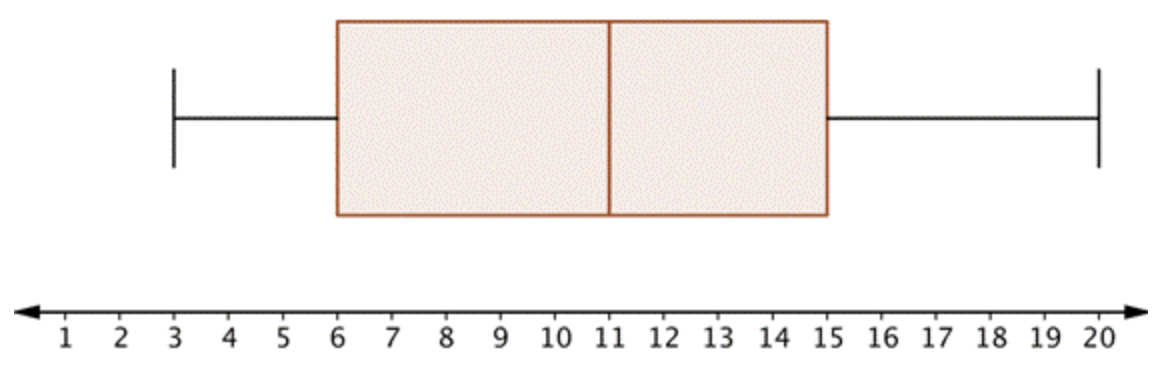
Notice that one “box” (rectangle section) begins at 6 (the median of the lower set) and goes to 11 (the median of the full set), and the other box goes from 11 to 15 (the median of the upper set).
The “whiskers” are the line segments on either end. One stretches from 3 (the least value in the set) to 6, and the other goes from 15 to 20 (the greatest value in the set).
The box-and-whisker plot essentially divides the data set into four sections (or quartiles): whisker, box, box, whisker. The size of the quartiles may be different, but the number of data points in each quartile is the same.
You can use a box-and-whisker plot to analyze how data in a set are distributed. You can also use the box-and-whisker plots to compare two sets of data.
Using Measures of Center to Solve Problems
Using mean, median, and mode, as well as range and midrange can help you to analyze situations and make decisions about things like which is the best, whether it is more reliable to walk or take the bus to school, or even whether to buy or sell a particular stock on the stock market.
Let’s look at an example of how analyzing data using measures of center can help you to make choices (and even get to school on time!).
Below is a table listing the amount of time it took Marta to get to school by either riding the bus or by walking, on 12 separate days. The times are door to door, meaning the clock starts when she leaves her front door and ends when she enters school.
| Bus | Walking |
| 16 minutes | 22 minutes |
| 14 minutes | 19 minutes |
| 15 minutes | 21 minutes |
| 14 minutes | 20 minutes |
| 31 minutes | 21 minutes |
| 15 minutes | 20 minutes |
- Which method of travel is faster?
- If she leaves her house 25 minutes before school starts, should she walk or take the bus to be assured of arriving at school on time?
Solution
|
bus: \(\ \frac{16+14+15+14+31+15}{6}=17.5\) walking: \(\ \frac{22+19+21+20+21+20}{6}=20.5\) |
Determine the mean of each travel method. |
|
bus: \(\ 31-14=17\) walking: \(\ 22-19=3\) |
Determine the range each travel method. |
|
bus: \(\ 14,14,15,15,16,31\) \(\ \frac{15+15}{2}=15\) walking: \(\ 19,20,20,21,21,22\) \(\ \frac{20+21}{2}=20.5\) |
Determine the median for each travel method. |
|
bus: \(\ 14,15\) walking: \(\ 20,21\) |
Determine the mode for each travel method. |
| Bus | Walking | |
| Mean | 17.5 | 20.5 |
| Median | 15 | 20.5 |
| Mode | 14, 15 | 20, 21 |
| Range | 17 | 3 |
Looking at the mean, median, and the mode, the faster way to school is riding the bus. The data also shows that the bus is the most variable, with a range of 17, so if Marta wants to be sure that she gets to school on time, she should walk.
In the previous example, riding the bus is, on average, a faster way to school than walking. This is revealed in the mean of each method, which shows that the bus is 3 minutes faster. The mode and median show an even greater time advantage to riding the bus, and this is due to the one time high value of 31 minutes that isn’t really accounted for in these measures. Notice the difference in the mean (17.5) and the median (15) for riding the bus, which lets you know there is some variance in the data.
As far as getting to school on time is concerned, while not being the fastest method, walking is the most reliable, with consistent values for mean, median, and mode, and a low value for the range, meaning that the spread of the data is very small.
Let’s look at another example.
The top three men’s tennis players during July in the years 2007 through 2011 were (in no particular order), Roger Federer, Rafael Nadal, and Novak Djokovic. Based on their July rankings, who has been the top performer over this time span?
| July | Nadal | Federer | Djokovic |
| 2011 | 2 | 3 | 1 |
| 2010 | 1 | 3 | 2 |
| 2009 | 2 | 1 | 4 |
| 2008 | 2 | 1 | 3 |
| 2007 | 2 | 1 | 3 |
Data taken from ATP World Tour, August 2011
Solution
|
Nadal: \(\ \frac{2+1+2+2+2}{5}=\frac{9}{5}=1.8\) Federer: \(\ \frac{3+3+1+1+1}{5}=\frac{9}{5}=1.8\) Djokovic: \(\ \frac{1+2+4+3+3}{5}=\frac{13}{5}=2.6\) |
Find the mean of each player’s ranking. |
|
Nadal: \(\ 1,2,2,2,2=2\) Federer: \(\ 1,1,1,3,3=1\) Djokovic: \(\ 1,2,3,3,4=3\) |
Find the median of each player’s ranking. |
|
Nadal: \(\ 1,2,2,2,2=2\) Federer: \(\ 1,1,1,3,3=1\) Djokovic: \(\ 1,2,3,3,4=3\) |
Find the mode of each player’s ranking. |
|
Nadal: \(\ 2-1=1\) Federer: \(\ 3-1=2\) Djokovic: \(\ 4-1=3\) |
Find the range of each player’s ranking. |
It appears that Nadal and Federer are virtually tied for the best performer over those 5 years, with Djokovic in third. Nadal’s and Federer’s mean ranking is 1.8, so they are even there. And while Federer’s rankings have a median of 1 and a mode of 1 (beating out Nadal both times), he also has a wider range: Federer has spent some time in 3rd place, which Nadal has not.
Depending on your viewpoint (and your preference of player!), you could make an argument that either Federer or Nadal is better than the other, but the data seems to show that they are nearly equal. Clearly, over time, the performance of Nadal and Federer is very close, with the mean of their rankings identical. The mean probably gives the best evaluation of overall performance, but does not tell us the whole story. Using the range, Nadal has been more consistent than Federer, although he has fewer number one rankings. Not shown in any of these measures is how Djokovic’s ranking has been moving upward and Federer’s ranking has been moving downward. It is also worth noting that it is hard to make a conclusion with such a small amount of data; using other measures, like tournaments won and average ranking of opponents may also help you understand who the best player was over this time.
Summary
Measures of center help you to analyze numerical data. The mean (or arithmetic mean) is often called the “average,” and is found by dividing the sum of the data items by the number of items. The median is the number that is in the middle when the data is ordered from least to greatest, and the mode is the number that appears most often. The range is the difference between the least number and the greatest number, and the midrange is the mean of the greatest value and the least value. Box-and-whisker plots use the median and range to help you to interpret the data visually.