
2.6: What Is Average?
- Page ID
- 148722

\( \newcommand{\vecs}[1]{\overset { \scriptstyle \rightharpoonup} {\mathbf{#1}} } \)
\( \newcommand{\vecd}[1]{\overset{-\!-\!\rightharpoonup}{\vphantom{a}\smash {#1}}} \)
\( \newcommand{\id}{\mathrm{id}}\) \( \newcommand{\Span}{\mathrm{span}}\)
( \newcommand{\kernel}{\mathrm{null}\,}\) \( \newcommand{\range}{\mathrm{range}\,}\)
\( \newcommand{\RealPart}{\mathrm{Re}}\) \( \newcommand{\ImaginaryPart}{\mathrm{Im}}\)
\( \newcommand{\Argument}{\mathrm{Arg}}\) \( \newcommand{\norm}[1]{\| #1 \|}\)
\( \newcommand{\inner}[2]{\langle #1, #2 \rangle}\)
\( \newcommand{\Span}{\mathrm{span}}\)
\( \newcommand{\id}{\mathrm{id}}\)
\( \newcommand{\Span}{\mathrm{span}}\)
\( \newcommand{\kernel}{\mathrm{null}\,}\)
\( \newcommand{\range}{\mathrm{range}\,}\)
\( \newcommand{\RealPart}{\mathrm{Re}}\)
\( \newcommand{\ImaginaryPart}{\mathrm{Im}}\)
\( \newcommand{\Argument}{\mathrm{Arg}}\)
\( \newcommand{\norm}[1]{\| #1 \|}\)
\( \newcommand{\inner}[2]{\langle #1, #2 \rangle}\)
\( \newcommand{\Span}{\mathrm{span}}\) \( \newcommand{\AA}{\unicode[.8,0]{x212B}}\)
\( \newcommand{\vectorA}[1]{\vec{#1}} % arrow\)
\( \newcommand{\vectorAt}[1]{\vec{\text{#1}}} % arrow\)
\( \newcommand{\vectorB}[1]{\overset { \scriptstyle \rightharpoonup} {\mathbf{#1}} } \)
\( \newcommand{\vectorC}[1]{\textbf{#1}} \)
\( \newcommand{\vectorD}[1]{\overrightarrow{#1}} \)
\( \newcommand{\vectorDt}[1]{\overrightarrow{\text{#1}}} \)
\( \newcommand{\vectE}[1]{\overset{-\!-\!\rightharpoonup}{\vphantom{a}\smash{\mathbf {#1}}}} \)
\( \newcommand{\vecs}[1]{\overset { \scriptstyle \rightharpoonup} {\mathbf{#1}} } \)
\( \newcommand{\vecd}[1]{\overset{-\!-\!\rightharpoonup}{\vphantom{a}\smash {#1}}} \)
\(\newcommand{\avec}{\mathbf a}\) \(\newcommand{\bvec}{\mathbf b}\) \(\newcommand{\cvec}{\mathbf c}\) \(\newcommand{\dvec}{\mathbf d}\) \(\newcommand{\dtil}{\widetilde{\mathbf d}}\) \(\newcommand{\evec}{\mathbf e}\) \(\newcommand{\fvec}{\mathbf f}\) \(\newcommand{\nvec}{\mathbf n}\) \(\newcommand{\pvec}{\mathbf p}\) \(\newcommand{\qvec}{\mathbf q}\) \(\newcommand{\svec}{\mathbf s}\) \(\newcommand{\tvec}{\mathbf t}\) \(\newcommand{\uvec}{\mathbf u}\) \(\newcommand{\vvec}{\mathbf v}\) \(\newcommand{\wvec}{\mathbf w}\) \(\newcommand{\xvec}{\mathbf x}\) \(\newcommand{\yvec}{\mathbf y}\) \(\newcommand{\zvec}{\mathbf z}\) \(\newcommand{\rvec}{\mathbf r}\) \(\newcommand{\mvec}{\mathbf m}\) \(\newcommand{\zerovec}{\mathbf 0}\) \(\newcommand{\onevec}{\mathbf 1}\) \(\newcommand{\real}{\mathbb R}\) \(\newcommand{\twovec}[2]{\left[\begin{array}{r}#1 \\ #2 \end{array}\right]}\) \(\newcommand{\ctwovec}[2]{\left[\begin{array}{c}#1 \\ #2 \end{array}\right]}\) \(\newcommand{\threevec}[3]{\left[\begin{array}{r}#1 \\ #2 \\ #3 \end{array}\right]}\) \(\newcommand{\cthreevec}[3]{\left[\begin{array}{c}#1 \\ #2 \\ #3 \end{array}\right]}\) \(\newcommand{\fourvec}[4]{\left[\begin{array}{r}#1 \\ #2 \\ #3 \\ #4 \end{array}\right]}\) \(\newcommand{\cfourvec}[4]{\left[\begin{array}{c}#1 \\ #2 \\ #3 \\ #4 \end{array}\right]}\) \(\newcommand{\fivevec}[5]{\left[\begin{array}{r}#1 \\ #2 \\ #3 \\ #4 \\ #5 \\ \end{array}\right]}\) \(\newcommand{\cfivevec}[5]{\left[\begin{array}{c}#1 \\ #2 \\ #3 \\ #4 \\ #5 \\ \end{array}\right]}\) \(\newcommand{\mattwo}[4]{\left[\begin{array}{rr}#1 \amp #2 \\ #3 \amp #4 \\ \end{array}\right]}\) \(\newcommand{\laspan}[1]{\text{Span}\{#1\}}\) \(\newcommand{\bcal}{\cal B}\) \(\newcommand{\ccal}{\cal C}\) \(\newcommand{\scal}{\cal S}\) \(\newcommand{\wcal}{\cal W}\) \(\newcommand{\ecal}{\cal E}\) \(\newcommand{\coords}[2]{\left\{#1\right\}_{#2}}\) \(\newcommand{\gray}[1]{\color{gray}{#1}}\) \(\newcommand{\lgray}[1]{\color{lightgray}{#1}}\) \(\newcommand{\rank}{\operatorname{rank}}\) \(\newcommand{\row}{\text{Row}}\) \(\newcommand{\col}{\text{Col}}\) \(\renewcommand{\row}{\text{Row}}\) \(\newcommand{\nul}{\text{Nul}}\) \(\newcommand{\var}{\text{Var}}\) \(\newcommand{\corr}{\text{corr}}\) \(\newcommand{\len}[1]{\left|#1\right|}\) \(\newcommand{\bbar}{\overline{\bvec}}\) \(\newcommand{\bhat}{\widehat{\bvec}}\) \(\newcommand{\bperp}{\bvec^\perp}\) \(\newcommand{\xhat}{\widehat{\xvec}}\) \(\newcommand{\vhat}{\widehat{\vvec}}\) \(\newcommand{\uhat}{\widehat{\uvec}}\) \(\newcommand{\what}{\widehat{\wvec}}\) \(\newcommand{\Sighat}{\widehat{\Sigma}}\) \(\newcommand{\lt}{<}\) \(\newcommand{\gt}{>}\) \(\newcommand{\amp}{&}\) \(\definecolor{fillinmathshade}{gray}{0.9}\)INTRODUCTION
The terms mean, median, and mode are three different kinds of averages. In your group, discuss how you would describe each of these terms to someone who didn’t know what they meant.
- Mean:
- Median:
- Mode:
Imagine a place that has varying daily temperatures. The following table shows the temperatures for one week. What is the mean temperature?
|
Monday |
62° |
|
Tuesday |
90° |
|
Wednesday |
106° |
|
Thursday |
10° |
|
Friday |
50° |
|
Saturday |
0° |
|
Sunday |
50° |
SPECIFIC OBJECTIVES
By the end of this collaboration, you should understand that
- numerical data can be summarized using measures of central tendency.
- the mean and median statistics for a set of data can provide different snapshots of the data.
- conclusions derived from statistical summaries are subject to error.
- a spreadsheet can be used to organize data.
By the end of this collaboration, you should be able to
- calculate the mean and median for numerical data.
- create a data set that meets certain criteria for measures of central tendency.
PROBLEM SITUATION: SUMMARIZING DATA ABOUT CREDIT CARDS
A revolving line of credit is an agreement between a consumer and lender that allows the consumer to obtain credit for an undetermined amount of time. The debt is repaid periodically and can be borrowed again once it is repaid. The use of a credit card is an example of a revolving line of credit.
According to CreditCards.com, U.S. consumers own more than 455 million credit cards. About 98% of the total U.S. revolving debt is made up of credit card debt. Average credit card debt per household with a credit card is $5,525. In the US alone, there are more than $4 trillion in transactions annually. It is estimated that there are 12,000 credit card payment transactions made every second.
According to the College Finance survey, released in 2021, 38% of college students are behind on their payments and 45% are only paying their minimum amount. The median debt carried by college students was $3,280. Recall that the median is the middle number of a data set when the numeric values are arranged in order of size. In 2020, 79% of all American consumers had at least one credit card, but only 55% carried a balance. If a credit card user carries a balance (e.g., does not pay the monthly debt in full) the credit card company assesses a finance charge (interest) for the use of their money. This can be avoided by paying the balance in full.18
In the first part of this collaboration, you will use this information about credit cards to learn about some ways to summarize quantitative information.
The word mean (the sum of all numbers in the data set divided by the number of numbers in the data set) was introduced in Preparation 2.5 and will be used throughout this collaboration. (Note: There are actually several different kinds of means. The one you will discuss in this collaboration is the arithmetic mean. An arithmetic mean is the same as an average.)
(1) The population of the United States is slightly more than 330 million people. There are about 120 million households in the United States. What is the mean number of credit cards per capita? What is the mean number of credit cards per household?
(2) Consider the statement: “Average credit card debt per household with a credit card is $5,525” How would you explain this statement? Discuss in your group.
(3) Recall that “average credit card debt per household with a credit card is $5,525.” Imagine you ask four groups of five households what their credit card debt is. The amount of debt for each household in each group is shown in the table.
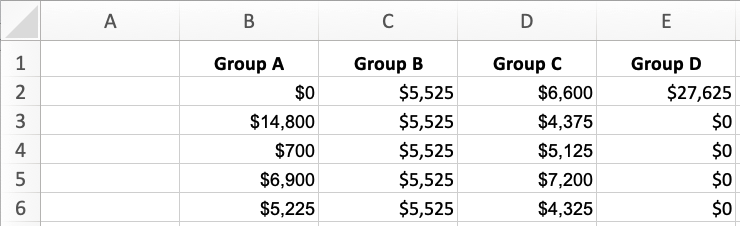
(a) Find the mean debt of each group of households. Make sure the value you found is reasonable given the values in the table.
(b) Create your own data set of the debt of five other households. This data set should have a mean debt of $5,525. You can choose the credit card debt for the individual college seniors, but the mean debt should be $5,525. Write your data in the table below.
|
Your Data |
(c) Find the median of each set of data including the one you created.
|
Group A |
Group B |
Group C |
Group D |
Your Data |
(4) The introductory information in this problem situation gives data credit card debt carried by freshmen. We are told that the median debt carried by college students was $3,280. Create a data set of six students so that the data set has the same median reported for all college students. Enter your data in the table below.
|
Debt of College Students |
MAKING CONNECTIONS
Record the important mathematical ideas from the discussion.
____________________________________
18 https://www.creditcards.com/statistics/ownership-statistics/