
8.10.2: Exercise 4.2-W Trends in Social Media
- Page ID
- 152930

\( \newcommand{\vecs}[1]{\overset { \scriptstyle \rightharpoonup} {\mathbf{#1}} } \)
\( \newcommand{\vecd}[1]{\overset{-\!-\!\rightharpoonup}{\vphantom{a}\smash {#1}}} \)
\( \newcommand{\id}{\mathrm{id}}\) \( \newcommand{\Span}{\mathrm{span}}\)
( \newcommand{\kernel}{\mathrm{null}\,}\) \( \newcommand{\range}{\mathrm{range}\,}\)
\( \newcommand{\RealPart}{\mathrm{Re}}\) \( \newcommand{\ImaginaryPart}{\mathrm{Im}}\)
\( \newcommand{\Argument}{\mathrm{Arg}}\) \( \newcommand{\norm}[1]{\| #1 \|}\)
\( \newcommand{\inner}[2]{\langle #1, #2 \rangle}\)
\( \newcommand{\Span}{\mathrm{span}}\)
\( \newcommand{\id}{\mathrm{id}}\)
\( \newcommand{\Span}{\mathrm{span}}\)
\( \newcommand{\kernel}{\mathrm{null}\,}\)
\( \newcommand{\range}{\mathrm{range}\,}\)
\( \newcommand{\RealPart}{\mathrm{Re}}\)
\( \newcommand{\ImaginaryPart}{\mathrm{Im}}\)
\( \newcommand{\Argument}{\mathrm{Arg}}\)
\( \newcommand{\norm}[1]{\| #1 \|}\)
\( \newcommand{\inner}[2]{\langle #1, #2 \rangle}\)
\( \newcommand{\Span}{\mathrm{span}}\) \( \newcommand{\AA}{\unicode[.8,0]{x212B}}\)
\( \newcommand{\vectorA}[1]{\vec{#1}} % arrow\)
\( \newcommand{\vectorAt}[1]{\vec{\text{#1}}} % arrow\)
\( \newcommand{\vectorB}[1]{\overset { \scriptstyle \rightharpoonup} {\mathbf{#1}} } \)
\( \newcommand{\vectorC}[1]{\textbf{#1}} \)
\( \newcommand{\vectorD}[1]{\overrightarrow{#1}} \)
\( \newcommand{\vectorDt}[1]{\overrightarrow{\text{#1}}} \)
\( \newcommand{\vectE}[1]{\overset{-\!-\!\rightharpoonup}{\vphantom{a}\smash{\mathbf {#1}}}} \)
\( \newcommand{\vecs}[1]{\overset { \scriptstyle \rightharpoonup} {\mathbf{#1}} } \)
\( \newcommand{\vecd}[1]{\overset{-\!-\!\rightharpoonup}{\vphantom{a}\smash {#1}}} \)
\(\newcommand{\avec}{\mathbf a}\) \(\newcommand{\bvec}{\mathbf b}\) \(\newcommand{\cvec}{\mathbf c}\) \(\newcommand{\dvec}{\mathbf d}\) \(\newcommand{\dtil}{\widetilde{\mathbf d}}\) \(\newcommand{\evec}{\mathbf e}\) \(\newcommand{\fvec}{\mathbf f}\) \(\newcommand{\nvec}{\mathbf n}\) \(\newcommand{\pvec}{\mathbf p}\) \(\newcommand{\qvec}{\mathbf q}\) \(\newcommand{\svec}{\mathbf s}\) \(\newcommand{\tvec}{\mathbf t}\) \(\newcommand{\uvec}{\mathbf u}\) \(\newcommand{\vvec}{\mathbf v}\) \(\newcommand{\wvec}{\mathbf w}\) \(\newcommand{\xvec}{\mathbf x}\) \(\newcommand{\yvec}{\mathbf y}\) \(\newcommand{\zvec}{\mathbf z}\) \(\newcommand{\rvec}{\mathbf r}\) \(\newcommand{\mvec}{\mathbf m}\) \(\newcommand{\zerovec}{\mathbf 0}\) \(\newcommand{\onevec}{\mathbf 1}\) \(\newcommand{\real}{\mathbb R}\) \(\newcommand{\twovec}[2]{\left[\begin{array}{r}#1 \\ #2 \end{array}\right]}\) \(\newcommand{\ctwovec}[2]{\left[\begin{array}{c}#1 \\ #2 \end{array}\right]}\) \(\newcommand{\threevec}[3]{\left[\begin{array}{r}#1 \\ #2 \\ #3 \end{array}\right]}\) \(\newcommand{\cthreevec}[3]{\left[\begin{array}{c}#1 \\ #2 \\ #3 \end{array}\right]}\) \(\newcommand{\fourvec}[4]{\left[\begin{array}{r}#1 \\ #2 \\ #3 \\ #4 \end{array}\right]}\) \(\newcommand{\cfourvec}[4]{\left[\begin{array}{c}#1 \\ #2 \\ #3 \\ #4 \end{array}\right]}\) \(\newcommand{\fivevec}[5]{\left[\begin{array}{r}#1 \\ #2 \\ #3 \\ #4 \\ #5 \\ \end{array}\right]}\) \(\newcommand{\cfivevec}[5]{\left[\begin{array}{c}#1 \\ #2 \\ #3 \\ #4 \\ #5 \\ \end{array}\right]}\) \(\newcommand{\mattwo}[4]{\left[\begin{array}{rr}#1 \amp #2 \\ #3 \amp #4 \\ \end{array}\right]}\) \(\newcommand{\laspan}[1]{\text{Span}\{#1\}}\) \(\newcommand{\bcal}{\cal B}\) \(\newcommand{\ccal}{\cal C}\) \(\newcommand{\scal}{\cal S}\) \(\newcommand{\wcal}{\cal W}\) \(\newcommand{\ecal}{\cal E}\) \(\newcommand{\coords}[2]{\left\{#1\right\}_{#2}}\) \(\newcommand{\gray}[1]{\color{gray}{#1}}\) \(\newcommand{\lgray}[1]{\color{lightgray}{#1}}\) \(\newcommand{\rank}{\operatorname{rank}}\) \(\newcommand{\row}{\text{Row}}\) \(\newcommand{\col}{\text{Col}}\) \(\renewcommand{\row}{\text{Row}}\) \(\newcommand{\nul}{\text{Nul}}\) \(\newcommand{\var}{\text{Var}}\) \(\newcommand{\corr}{\text{corr}}\) \(\newcommand{\len}[1]{\left|#1\right|}\) \(\newcommand{\bbar}{\overline{\bvec}}\) \(\newcommand{\bhat}{\widehat{\bvec}}\) \(\newcommand{\bperp}{\bvec^\perp}\) \(\newcommand{\xhat}{\widehat{\xvec}}\) \(\newcommand{\vhat}{\widehat{\vvec}}\) \(\newcommand{\uhat}{\widehat{\uvec}}\) \(\newcommand{\what}{\widehat{\wvec}}\) \(\newcommand{\Sighat}{\widehat{\Sigma}}\) \(\newcommand{\lt}{<}\) \(\newcommand{\gt}{>}\) \(\newcommand{\amp}{&}\) \(\definecolor{fillinmathshade}{gray}{0.9}\)MAKING CONNECTIONS TO THE COLLABORATION
(1) Which of the following was one of the main mathematical ideas of the collaboration?
(i) Instagram usership is increasing faster than Twitter usership.
(ii) A slope is a ratio with units that describes how two variables change in relationship to each other.
(iii) A slope tells you how much one variable has changed.
(iv) A slope can be written as a fraction or a decimal.
(2) You have learned about absolute change, relative change, and average rate of change. Identify which type of change best describes each of the following values and explain your answer.
(i) 30%
(ii) $30/year
(iii) $30
DEVELOPING SKILLS AND UNDERSTANDING
(3) The three graphs below model the relationship between time spent in class and time spent studying for three students. Use the graphs to answer the following questions.
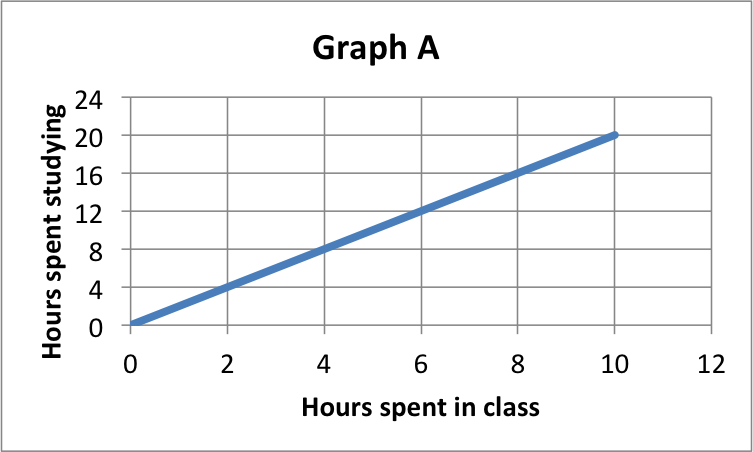
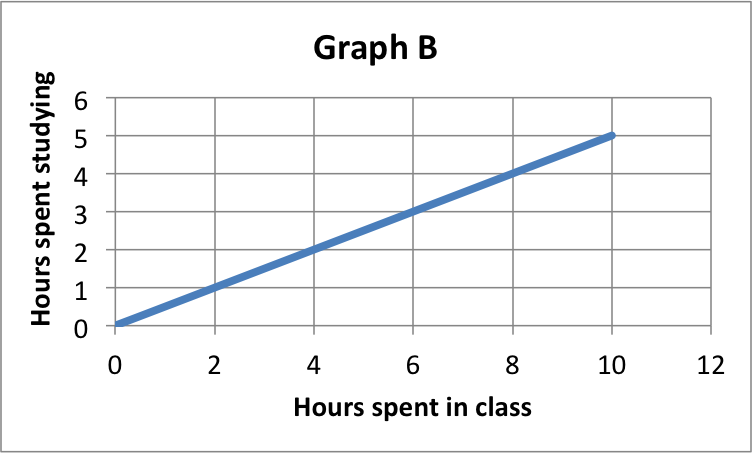
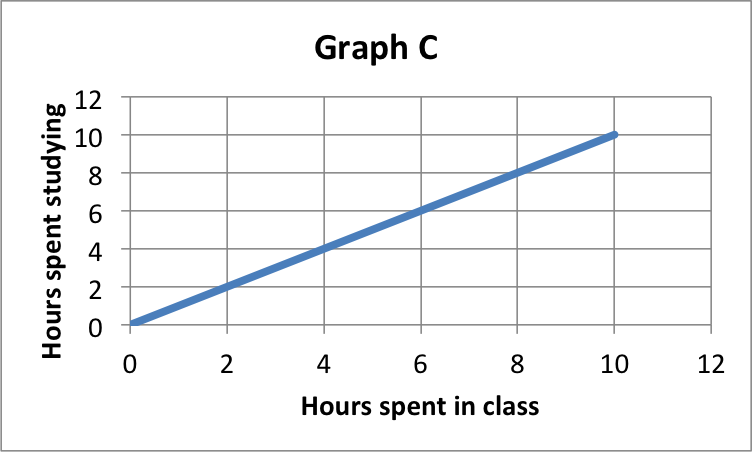
(a) Which of the graphs has a slope of 2?
(b) Which graph shows a relationship of one hour studying for each hour in class?
(c) Which graph matches the following table?
|
Hours in class |
1 |
4 |
7 |
9 |
|
Hours studying |
2 |
8 |
14 |
18 |
(d) What is the equation for Graph B? Use C for hours in class and s for hours studying.
(e) Which graph would contain the point (20, 10) if it were extended?
(4) A parents’ group is writing a grant to support an afterschool program for their children. They want to make the point that government funding for afterschool programs in their school has decreased over the last decade while the cost of offering programs has increased. Their argument is based on the data below.
|
2000 |
2010 |
|
|
Government funding for afterschool programs ($/child) |
$3,000 |
$1,800 |
|
Cost of services ($/child) |
$3,800 |
$5,100 |
(a) Which of the following is the best interpretation of the average rate of change in the government funding?
(i) Government funding has changed by an average of $120 each year.
(ii) Government funding has decreased by an average of $120 per child each year.
(iii) Government funding has decreased by an average of $1,200 per child each year.
(iv) Government funding has decreased by an average of $1,800 per child each year.
(b) Write an interpretation of the average rate of change in the cost of services.
(c) Sketch a graph showing linear models of the two sets of data: government funding and cost of services. Be sure to include a title, scales, and labels on the axes. Label each of the models on the graph.
(5) In a study by PricewaterhouseCoopers (PwC), it was found that DVD sales totaled $12.2 billion in 2013.1 According to PwC, it’s expected that DVD sales will be $11.5 billion in 2014 and $8.7 billion in 2018.2
The study also projected an increase in sales from streaming videos. It’s expected that revenue will double by 2018, from $8.5 billion in 2014 to $17 billion in 2018.
(a) What is the slope, including units, of the model for DVD sales?
(b) Write a statement interpreting the meaning of the slope in the context of the problem.
(c) Write an equation that represents the linear model for DVD sales. Let D = the sales of DVDs in billions of dollars, and t = the number of years after 2014.
(d) What is the slope, including units, of the model for streaming videos?
(e) Write a statement interpreting the meaning of the slope in the context of the problem.
(f) Write an equation that represents the linear model for streaming videos. Let S = the total sales of streaming videos in billions of dollars, and t = the number of years after 2014.
(g) In what year do you expect streaming video sales to exceed DVD sales?
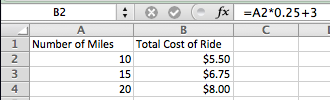
(6) Suppose you work for a shuttle service. You see the following spreadsheet that gives information about what your company will charge for rides of different lengths. The formula shown is for cell B2. Write a statement that tells how the fare is calculated based on the number of miles.
(7) Delilah wants to join a gym, so she shops around to find the one with the lowest overall price (she is not sure how long she will be a member). She finds the Harbor Square Athletic Club is running a special, and only charges a $25 initiation fee plus $87 a month to be a member. The local YMCA charges $100 to join, and has a monthly fee of $72.
(a) Find the equations for the linear models for the costs to join the Harbor Square Athletic Club and the YMCA. Use C = cost in dollars and m = months.
(b) Calculate how many months Delilah would have to be a gym member for it to be less expensive to join the YMCA. Then fill in the blank.
The YMCA will be less expensive if she remains a member for more than ________ months.
MAKING CONNECTIONS ACROSS THE COURSE
(8) In Unit 2.3, you used the following data about population changes in the United States. Suppose state planners in Indiana and Michigan think that the average rate of change will continue through 2015.
|
State |
2000 Population |
2010 Population |
|
Indiana |
6,080,485 |
6,483,802 |
|
Michigan |
9,938,444 |
9,883,640 |
(a) Write equations to model the populations for each state. Use M for the population of Michigan; I for the population of Indiana and t for time in years after 2000.
(b) Use your equations to find the projected populations for Michigan and Indiana in 2015.
________________________________________
2 http://www.pwc.com/gx/en/global-entertainment-media-outlook/assets/2014/images/filmed-large3.jpg