
38.3: Interpreting Points on a Coordinate Plane
- Page ID
- 40827
Lesson
Let's examine what points on the coordinate plane can tell us.
Exercise \(\PageIndex{1}\): Unlabeled Points
Label each point on the coordinate plane with the appropriate letter and ordered pair.
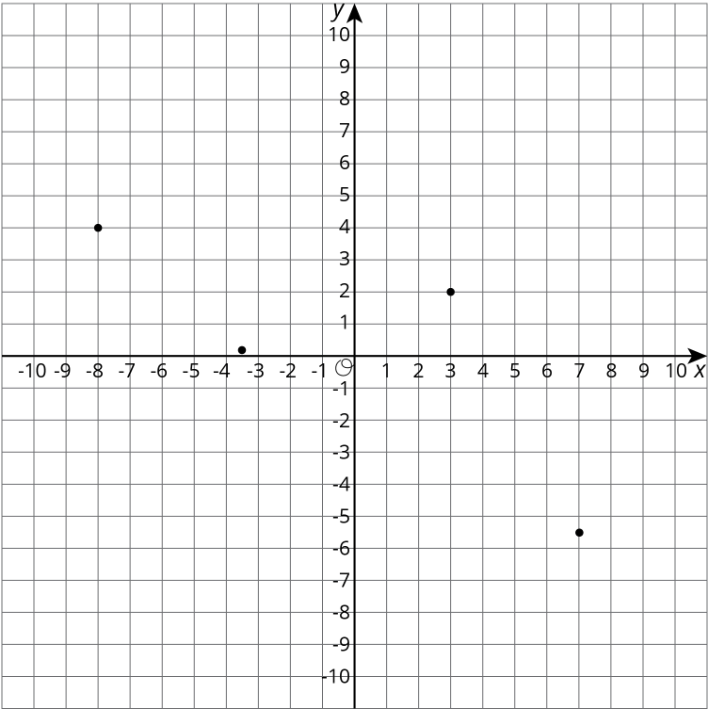
\(A=(7,-5.5)\qquad B=(-8,4)\qquad C=(3,2)\qquad D=(-3.5,0.2)\)
Exercise \(\PageIndex{2}\): Account Balance
The graph shows the balance in a bank account over a period of 14 days. The axis labeled \(b\) represents account balance in dollars. The axis labeled \(d\) represents the day.
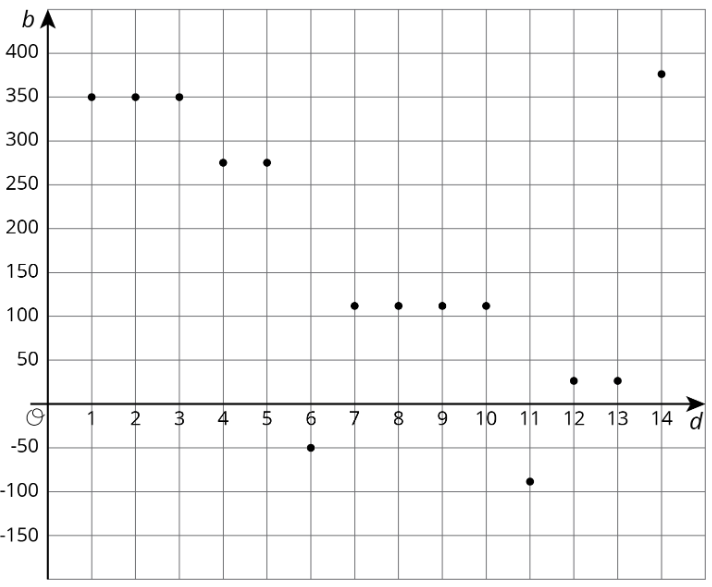
- Estimate the greatest account balance. On which day did it occur?
- Estimate the least account balance. On which day did it occur?
- What does the point \((6,-50)\) tell you about the account balance?
- How can we interpret \(|-50|\) in the context?
Exercise \(\PageIndex{3}\): High and Low Temperatures
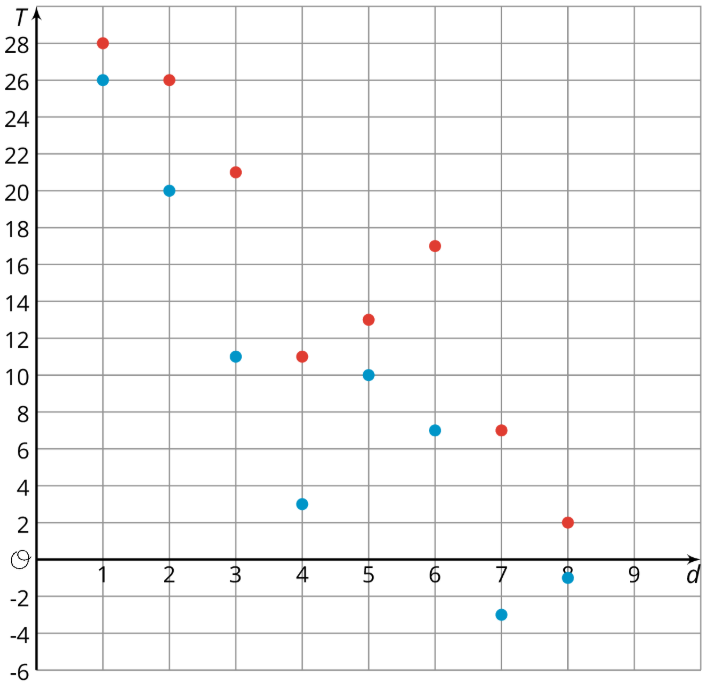
The coordinate plane shows the high and low temperatures in Nome, Alaska over a period of 8 days. The axis labeled \(T\) represents temperatures in degrees Fahrenheit. The axis labeled \(d\) represents the day.
-
- What was the warmest high temperature?
- Write an inequality to describe the high temperatures, \(H\), over the 8-day period.
-
- What was the coldest low temperature?
- Write an inequality to describe the low temperatures, \(L\), over the 8-day period.
-
- On which day(s) did the largest difference between the high and low temperatures occur? Write down this difference.
- On which day(s) did the smallest difference between the high and low temperatures occur? Write down this difference.
Are you ready for more?
Before doing this problem, do the problem about taxicab distance in an earlier lesson.
The point \((0,3)\) is 4 taxicab units away from \((-4,3)\) and 4 taxicab units away from \((2,1)\).
- Find as many other points as you can that are 4 taxicab units away from both \((-4,3)\) and \((2,1)\).
- Are there any points that are 3 taxicab units away from both points?
Summary
Points on the coordinate plane can give us information about a context or a situation. One of those contexts is about money.
To open a bank account, we have to put money into the account. The account balance is the amount of money in the account at any given time. If we put in $350 when opening the account, then the account balance will be 350.
Sometimes we may have no money in the account and need to borrow money from the bank. In that situation, the account balance would have a negative value. If we borrow $200, then the account balance is -200.
A coordinate grid can be used to display both the balance and the day or time for any balance. This allows to see how the balance changes over time or to compare the balances of different days.
Similarly, if we plot on the coordinate plane data such as temperature over time, we can see how temperature changes over time or compare temperatures of different times.
Glossary Entries
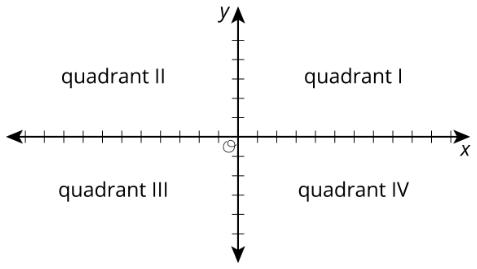
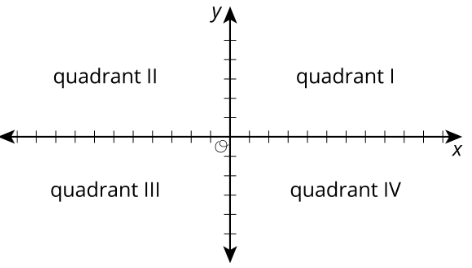
Definition: Quadrant
The coordinate plane is divided into 4 regions called quadrants. The quadrants are numbered using Roman numerals, starting in the top right corner.
Practice
Exercise \(\PageIndex{4}\)
The elevation of a submarine is shown in the table. Draw and label coordinate axes with an appropriate scale and plot the points.
| time after noon (hours) | elevation (meters) |
|---|---|
| \(0\) | \(-567\) |
| \(1\) | \(-892\) |
| \(2\) | \(-1,606\) |
| \(3\) | \(-1,289\) |
| \(4\) | \(-990\) |
| \(5\) | \(-702\) |
| \(6\) | \(-365\) |
Exercise \(\PageIndex{5}\)
The inequalities \(h>42\) and \(h<60\) represent the height requirements for an amusement park ride, where \(h\) represents a person's height in inches.
Write a sentence or draw a sign that describes these rules as clearly as possible.
(From Unit 7.2.1)
Exercise \(\PageIndex{6}\)
The \(x\)-axis represents the number of hours before or after noon, and the \(y\)-axis represents the temperature in degrees Celsius.
- At 9 a.m., it was below freezing. In what quadrant would this point be plotted?
- At 11 a.m., it was \(10^{\circ}\text{C}\). In what quadrant would this point be plotted?
- Choose another time and temperature. Then tell the quadrant where the point should be plotted.
- What does the point \((0,0)\) represent in this context?
Exercise \(\PageIndex{7}\)
Solve each equation.
\(\begin{array}{lllll}{3a=12}&{\qquad}&{b+3.3=8.9}&{\qquad}&{1=\frac{1}{4}c}\\{5\frac{1}{2}=d+\frac{1}{4}}&{\qquad}&{2e=6.4}&{}&{}\end{array}\)
(From Unit 6.1.4)