
2.3: The slope of a secant line is the average rate of change
- Page ID
- 121088

\( \newcommand{\vecs}[1]{\overset { \scriptstyle \rightharpoonup} {\mathbf{#1}} } \)
\( \newcommand{\vecd}[1]{\overset{-\!-\!\rightharpoonup}{\vphantom{a}\smash {#1}}} \)
\( \newcommand{\id}{\mathrm{id}}\) \( \newcommand{\Span}{\mathrm{span}}\)
( \newcommand{\kernel}{\mathrm{null}\,}\) \( \newcommand{\range}{\mathrm{range}\,}\)
\( \newcommand{\RealPart}{\mathrm{Re}}\) \( \newcommand{\ImaginaryPart}{\mathrm{Im}}\)
\( \newcommand{\Argument}{\mathrm{Arg}}\) \( \newcommand{\norm}[1]{\| #1 \|}\)
\( \newcommand{\inner}[2]{\langle #1, #2 \rangle}\)
\( \newcommand{\Span}{\mathrm{span}}\)
\( \newcommand{\id}{\mathrm{id}}\)
\( \newcommand{\Span}{\mathrm{span}}\)
\( \newcommand{\kernel}{\mathrm{null}\,}\)
\( \newcommand{\range}{\mathrm{range}\,}\)
\( \newcommand{\RealPart}{\mathrm{Re}}\)
\( \newcommand{\ImaginaryPart}{\mathrm{Im}}\)
\( \newcommand{\Argument}{\mathrm{Arg}}\)
\( \newcommand{\norm}[1]{\| #1 \|}\)
\( \newcommand{\inner}[2]{\langle #1, #2 \rangle}\)
\( \newcommand{\Span}{\mathrm{span}}\) \( \newcommand{\AA}{\unicode[.8,0]{x212B}}\)
\( \newcommand{\vectorA}[1]{\vec{#1}} % arrow\)
\( \newcommand{\vectorAt}[1]{\vec{\text{#1}}} % arrow\)
\( \newcommand{\vectorB}[1]{\overset { \scriptstyle \rightharpoonup} {\mathbf{#1}} } \)
\( \newcommand{\vectorC}[1]{\textbf{#1}} \)
\( \newcommand{\vectorD}[1]{\overrightarrow{#1}} \)
\( \newcommand{\vectorDt}[1]{\overrightarrow{\text{#1}}} \)
\( \newcommand{\vectE}[1]{\overset{-\!-\!\rightharpoonup}{\vphantom{a}\smash{\mathbf {#1}}}} \)
\( \newcommand{\vecs}[1]{\overset { \scriptstyle \rightharpoonup} {\mathbf{#1}} } \)
\( \newcommand{\vecd}[1]{\overset{-\!-\!\rightharpoonup}{\vphantom{a}\smash {#1}}} \)
- Define average rate of change; explain its connection with the slope of a secant line.
- Compute the average rate of change using time-dependent data over a given time interval.
- Given two points on the graph of a function, or two discrete data points, find both the slope and the equation of a secant line through those points.
We generalize the ideas in Section \(2.2\) to consider rates of change for relationships other than linear. Let \(y=f(t)\) describe some relationship between time \(t\) and a variable of interest \(y\). (This could be a set of discrete data points as in Figure 2.2, or a formula, as in Equation 2.1.1.)
- Sketch some nonlinear function and two different secant lines.
- Is there any reason why we must draw secant lines between pairs of successive data points? Definition 2.2 (Secant Line) A secant line is a straight line connecting any two specific points on the graph of a function.
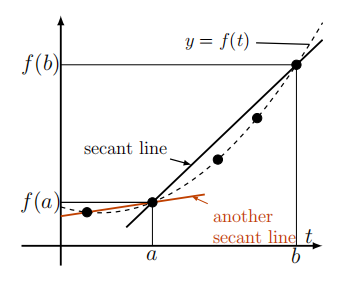
Pick any two points \((a, f(a))\), and \((b, f(b))\) satisfying \(y=f(t)\), and connect the points with a straight line. We refer to this line as the secant line, and we call its slope an average rate of change over the interval \(a \leq t \leq b\). Formally, we define
A secant line is a straight line connecting any two specific points on the graph of a function.
The average rate of change of \(y=f(t)\) over the time interval \(a \leq t \leq b\) is the slope of the secant line through the two points \((a, f(a))\), and \((b, f(b))\).
Based on the above definition, we compute the average rate of change of \(f\) over the time interval \(a \leq t \leq b\) as
\[\text { Average rate of change }=\frac{\text { Change in } f}{\text { Change in } t}=\frac{\Delta f}{\Delta t}=\frac{f(b)-f(a)}{b-a} \text {. } \nonumber \]
Observe that the average rate of changes in general depending on which two points we select, in contrast to the linear case. (See left panel in Figure 2.6.) The word "average" sometimes causes confusion. One often speaks in a different context about the average value of a set of numbers (e.g. the average of \(\{7,1,3,5\}\) is \((7+1+3+5) / 4=4\).) However the term average rate of change always means the slope of the straight line joining a pair of points.
For example, the average rate of change of milk temperature discussed in Example 2.1 is
\[\frac{\text { Change in temperature }}{\text { Time taken }}=\frac{\Delta T}{\Delta t} \nonumber \]
Featured Problem \(2.2\) (Average rate of change of milk temperature)
- Use the data in Tables \(2.1\) and \(2.2\) to show that the average rates of change of the temperature over the time interval \(2 \leq t \leq 4 \mathrm{~min}\) for the cooling phase is \(-5.7^{\circ} / \mathrm{min}\). Repeat the calculation over a similar interval for the heating phase, and show that you get \(26.95^{\circ} / \mathrm{min}\).
- Write the equation of the secant line through the data points \(t=2\) and \(t=4\) for the heating phase.
For a moving body, the average velocity over a time interval \(a \leq t \leq b\) is the average rate of change of distance over the given time interval.
Use the tuna swimming data in Figure 2.3 to answer the following questions:
(a) Determine the average velocity of each of these two fish over the \(35 \mathrm{~h}\) shown in the figure.
(b) What is the fastest average velocity shown in this figure, and over what time interval and for which fish did it occur?
Solution
(a) We find that Tuna 1 swam \(180 \mathrm{~km}\), whereas Tuna 2 swam \(218 \mathrm{~km}\) over the course of \(35 \mathrm{hr}\). Thus, the average velocity of Tuna 1 was \(\bar{v}=180 / 35 \approx\) \(5.14 \mathrm{~km} / \mathrm{h}\), whereas for Tuna 2 it was \(6.23 \mathrm{~km} / \mathrm{h}\).
(b) The fastest average velocity corresponds to the segment of the graph that has the greatest slope. This occurs for Tuna 2 during the time interval \(15 \leq t \leq 20\). Indeed, over that \(5 \mathrm{hr}\) interval the tuna has a displacement (net distance covered) of \(140-78=62 \mathrm{~km}\). Its average velocity over that time interval was thus \(62 / 5=12.4 \mathrm{~km} / \mathrm{h}\).
- What was the average velocity of Tuna 1 during \(15 \leq t \leq 20\) ?
Find the equation of the secant line connecting the first and last data points for the Tuna 1 swimming distances in Figure 2.3.
Solution
We defined the distance as 0 at time \(t=0\), so that the \(y\) intercept of the secant line is 0 . We have already computed the slope of the secant line (average rate of change) as \(5.14 \mathrm{~km} / \mathrm{h}\). Hence the equation of the secant line is
\[y_{S}=5.14 t . \nonumber \]
We can extend the definition of average rate of change to any function \(f(x)\).
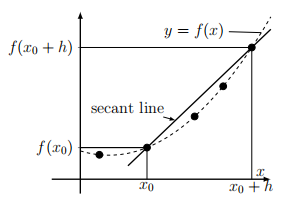
Suppose \(y=f(x)\) is a function of some arbitrary variable \(x\). The average rate of change of \(f\) between two points \(x_{0}\) and \(x_{0}+h\) is given by
\[\frac{\text { Change in } y}{\text { Change in } x}=\frac{\Delta y}{\Delta x}=\frac{\left[f\left(x_{0}+h\right)-f\left(x_{0}\right)\right]}{\left(x_{0}+h\right)-x_{0}}=\frac{\left[f\left(x_{0}+h\right)-f\left(x_{0}\right)\right]}{h} \text {. } \nonumber \]
Here \(h\) is the difference of the \(x\) coordinates. The above ratio is the slope of the secant line shown in Figure 2.7.
Consider a falling object. Suppose that the total distance fallen at time \(t\) is given by Equation (2.1), \(y(t)=c t^{2}\). Find the average velocity \(\bar{v}\), of the object over the time interval \(t_{0} \leq t \leq t_{0}+h\).
Solution
In Figure 2.8, we reproduce the data for the falling object from Figure \(2.4\) and superimpose a secant line connecting two points labeled \(t_{0}\) and \(t_{0}+h\)
We compute the average velocity as follows:
\[\begin{aligned} \bar{v} & =\frac{y\left(t_{0}+h\right)-y\left(t_{0}\right)}{h} \leftarrow \text { (definition of average velocity) } \\ & =\frac{c\left(t_{0}+h\right)^{2}-c\left(t_{0}\right)^{2}}{h} \leftarrow \text { the function of interest } \\ & =c\left(\frac{\left(t_{0}^{2}+2 h t_{0}+h^{2}\right)-\left(t_{0}^{2}\right)}{h}\right) \quad \text { some algebra } \\ & =c\left(\frac{2 h t_{0}+h^{2}}{h}\right) \quad \text { simplifying the expression } \\ & =c\left(2 t_{0}+h\right) \end{aligned} \nonumber \]
The average velocity over the time interval \(t_{0}<t<t_{0}+h\) is \(\bar{v}=c\left(2 t_{0}+h\right) .\)

A secant line between two points, \(x_{0}\) and \(x_{0}+h\) on the graph of a function \(f(x)\) is shown in this link. You can change the base point \(x_{0}\), the distance between the \(x\) coordinates, \(h\), or you can input your own function for \(f(x)\). The slope of the secant line is the average rate of change of \(f\) over the interval \(x_{0} \leq x \leq x_{0}+h\)