
5.2.2: Tables, Equations, and Graphs of Functions
- Page ID
- 36027

\( \newcommand{\vecs}[1]{\overset { \scriptstyle \rightharpoonup} {\mathbf{#1}} } \)
\( \newcommand{\vecd}[1]{\overset{-\!-\!\rightharpoonup}{\vphantom{a}\smash {#1}}} \)
\( \newcommand{\id}{\mathrm{id}}\) \( \newcommand{\Span}{\mathrm{span}}\)
( \newcommand{\kernel}{\mathrm{null}\,}\) \( \newcommand{\range}{\mathrm{range}\,}\)
\( \newcommand{\RealPart}{\mathrm{Re}}\) \( \newcommand{\ImaginaryPart}{\mathrm{Im}}\)
\( \newcommand{\Argument}{\mathrm{Arg}}\) \( \newcommand{\norm}[1]{\| #1 \|}\)
\( \newcommand{\inner}[2]{\langle #1, #2 \rangle}\)
\( \newcommand{\Span}{\mathrm{span}}\)
\( \newcommand{\id}{\mathrm{id}}\)
\( \newcommand{\Span}{\mathrm{span}}\)
\( \newcommand{\kernel}{\mathrm{null}\,}\)
\( \newcommand{\range}{\mathrm{range}\,}\)
\( \newcommand{\RealPart}{\mathrm{Re}}\)
\( \newcommand{\ImaginaryPart}{\mathrm{Im}}\)
\( \newcommand{\Argument}{\mathrm{Arg}}\)
\( \newcommand{\norm}[1]{\| #1 \|}\)
\( \newcommand{\inner}[2]{\langle #1, #2 \rangle}\)
\( \newcommand{\Span}{\mathrm{span}}\) \( \newcommand{\AA}{\unicode[.8,0]{x212B}}\)
\( \newcommand{\vectorA}[1]{\vec{#1}} % arrow\)
\( \newcommand{\vectorAt}[1]{\vec{\text{#1}}} % arrow\)
\( \newcommand{\vectorB}[1]{\overset { \scriptstyle \rightharpoonup} {\mathbf{#1}} } \)
\( \newcommand{\vectorC}[1]{\textbf{#1}} \)
\( \newcommand{\vectorD}[1]{\overrightarrow{#1}} \)
\( \newcommand{\vectorDt}[1]{\overrightarrow{\text{#1}}} \)
\( \newcommand{\vectE}[1]{\overset{-\!-\!\rightharpoonup}{\vphantom{a}\smash{\mathbf {#1}}}} \)
\( \newcommand{\vecs}[1]{\overset { \scriptstyle \rightharpoonup} {\mathbf{#1}} } \)
\( \newcommand{\vecd}[1]{\overset{-\!-\!\rightharpoonup}{\vphantom{a}\smash {#1}}} \)
Lesson
Let's connect equations and graphs of functions.
Exercise \(\PageIndex{1}\): Notice and Wonder: Doubling Back
What do you notice? What do you wonder?

Exercise \(\PageIndex{2}\): Equations and Graphs of Functions
The graphs of three functions are shown.

- Match one of these equations to each of the graphs.
- \(d=60t\), where \(d\) is the distance in miles that you would travel in \(t\) hours if you drove at 60 miles per hour.
- \(q=50-0.4d\), where \(q\) is the number of quarters, and \(d\) is the number of dimes, in a pile of coins worth $12.50.
- \(A=\pi r^{2}\), where \(A\) is the area in square centimeters of a circle with radius \(r\) centimeters.
- Label each of the axes with the independent and dependent variables and the quantities they represent.
- For each function: What is the output when the input is 1? What does this tell you about the situation? Label the corresponding point on the graph.
- Find two more input-output pairs. What do they tell you about the situation? Label the corresponding points on the graph.
Are you ready for more?
A function inputs fractions \(\frac{a}{b}\) between 0 and 1 where \(a\) and \(b\) have no common factors, and outputs the fraction \(\frac{1}{b}\). For example, given the input \(\frac{3}{4}\) the function outputs \(\frac{1}{4}\), and to the input \(\frac{1}{2}\) the function outputs \(\frac{1}{2}\). These two input-output pairs are shown on the graph.
Plot at least 10 more points on the graph of this function. Are most points on the graph above or below a height of \(0.3\)? Of height \(0.01\)?

Exercise \(\PageIndex{3}\): Running around a Track
- Kiran was running around the track. The graph shows the time, \(t\), he took to run various distances, \(d\). The table shows his time in seconds after every three meters.

| \(d\) | 0 | 3 | 6 | 9 | 12 | 15 | 18 | 21 | 24 | 27 |
|---|---|---|---|---|---|---|---|---|---|---|
| \(t\) | 0 | 1.0 | 2.0 | 3.2 | 3.8 | 4.6 | 6.0 | 6.9 | 8.09 | 9.0 |
- How long did it take Kiran to run 6 meters?
- How far had he gone after 6 seconds?
- Estimate when he had run 19.5 meters.
- Estimate how far he ran in 4 seconds.
- Is Kiran's time a function of the distance he has run? Explain how you know.
2. Priya is running once around the track. The graph shows her time given how far she is from her starting point.

- What was her farthest distance from her starting point?
- Estimate how long it took her to run around the track.
- Estimate when she was 100 meters from her starting point.
- Estimate how far she was from the starting line after 60 seconds.
- Is Priya's time a function of her distance from her starting point? Explain how you know.
Summary
Here is the graph showing Noah's run.
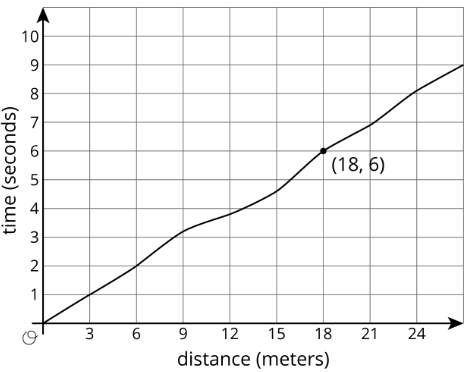
The time in seconds since he started running is a function of the distance he has run. The point (18,6) on the graph tells you that the time it takes him to run 18 meters is 6 seconds. The input is 18 and the output is 6.
The graph of a function is all the coordinate pairs, (input, output), plotted in the coordinate plane. By convention, we always put the input first, which means that the inputs are represented on the horizontal axis and the outputs, on the vertical axis.
Glossary Entries
Definition: Dependent Variable
A dependent variable represents the output of a function.
For example, suppose we need to buy 20 pieces of fruit and decide to buy apples and bananas. If we select the number of apples first, the equation \(b=20-a\) shows the number of bananas we can buy. The number of bananas is the dependent variable because it depends on the number of apples.
Definition: Independent Variable
An independent variable represents the input of a function.
For example, suppose we need to buy 20 pieces of fruit and decide to buy some apples and bananas. If we select the number of apples first, the equation \(b=20-a\) shows the number of bananas we can buy. The number of apples is the independent variable because we can choose any number for it.
Definition: Radius
A radius is a line segment that goes from the center to the edge of a circle. A radius can go in any direction. Every radius of the circle is the same length. We also use the word radius to mean the length of this segment.
For example, \(r\) is the radius of this circle with center \(O\).

Practice
Exercise \(\PageIndex{4}\)
The graph and the table show the high temperatures in a city over a 10-day period.

| day | 1 | 2 | 3 | 4 | 5 | 6 | 7 | 8 | 9 | 10 |
|---|---|---|---|---|---|---|---|---|---|---|
| temperature (degrees F) | 60 | 61 | 63 | 61 | 62 | 61 | 60 | 65 | 67 | 63 |
- What was the high temperature on Day 7?
- On which days was the high temperature 61 degrees?
- Is the high temperature a function of the day? Explain how you know.
- Is the day a function of the high temperature? Explain how you know.
Exercise \(\PageIndex{5}\)
The amount Lin’s sister earns at her part-time job is proportional to the number of hours she works. She earns $9.60 per hour.
- Write an equation in the form \(y=kx\) to describe this situation, where \(x\) represents the hours she works and \(y\) represents the dollars she earns.
- Is \(y\) a function of \(x\)? Explain how you know.
- Write an equation describing \(x\) as a function of \(y\).
Exercise \(\PageIndex{6}\)
Use the equation \(2m+4s=16\) to complete the table, then graph the line using \(s\) as the dependent variable.
| \(m\) | 0 | -2 | ||
|---|---|---|---|---|
| \(s\) | 3 | 0 |
Exercise \(\PageIndex{7}\)
Solve the system of equations:
\[\left\{\begin{array}{l}{y=7x+10}\\{y=-4x-23}\end{array}\right.\nonumber\]
(From Unit 4.3.4)