
8.3: Graphing Linear Equations
- Page ID
- 22510

\( \newcommand{\vecs}[1]{\overset { \scriptstyle \rightharpoonup} {\mathbf{#1}} } \)
\( \newcommand{\vecd}[1]{\overset{-\!-\!\rightharpoonup}{\vphantom{a}\smash {#1}}} \)
\( \newcommand{\dsum}{\displaystyle\sum\limits} \)
\( \newcommand{\dint}{\displaystyle\int\limits} \)
\( \newcommand{\dlim}{\displaystyle\lim\limits} \)
\( \newcommand{\id}{\mathrm{id}}\) \( \newcommand{\Span}{\mathrm{span}}\)
( \newcommand{\kernel}{\mathrm{null}\,}\) \( \newcommand{\range}{\mathrm{range}\,}\)
\( \newcommand{\RealPart}{\mathrm{Re}}\) \( \newcommand{\ImaginaryPart}{\mathrm{Im}}\)
\( \newcommand{\Argument}{\mathrm{Arg}}\) \( \newcommand{\norm}[1]{\| #1 \|}\)
\( \newcommand{\inner}[2]{\langle #1, #2 \rangle}\)
\( \newcommand{\Span}{\mathrm{span}}\)
\( \newcommand{\id}{\mathrm{id}}\)
\( \newcommand{\Span}{\mathrm{span}}\)
\( \newcommand{\kernel}{\mathrm{null}\,}\)
\( \newcommand{\range}{\mathrm{range}\,}\)
\( \newcommand{\RealPart}{\mathrm{Re}}\)
\( \newcommand{\ImaginaryPart}{\mathrm{Im}}\)
\( \newcommand{\Argument}{\mathrm{Arg}}\)
\( \newcommand{\norm}[1]{\| #1 \|}\)
\( \newcommand{\inner}[2]{\langle #1, #2 \rangle}\)
\( \newcommand{\Span}{\mathrm{span}}\) \( \newcommand{\AA}{\unicode[.8,0]{x212B}}\)
\( \newcommand{\vectorA}[1]{\vec{#1}} % arrow\)
\( \newcommand{\vectorAt}[1]{\vec{\text{#1}}} % arrow\)
\( \newcommand{\vectorB}[1]{\overset { \scriptstyle \rightharpoonup} {\mathbf{#1}} } \)
\( \newcommand{\vectorC}[1]{\textbf{#1}} \)
\( \newcommand{\vectorD}[1]{\overrightarrow{#1}} \)
\( \newcommand{\vectorDt}[1]{\overrightarrow{\text{#1}}} \)
\( \newcommand{\vectE}[1]{\overset{-\!-\!\rightharpoonup}{\vphantom{a}\smash{\mathbf {#1}}}} \)
\( \newcommand{\vecs}[1]{\overset { \scriptstyle \rightharpoonup} {\mathbf{#1}} } \)
\(\newcommand{\longvect}{\overrightarrow}\)
\( \newcommand{\vecd}[1]{\overset{-\!-\!\rightharpoonup}{\vphantom{a}\smash {#1}}} \)
\(\newcommand{\avec}{\mathbf a}\) \(\newcommand{\bvec}{\mathbf b}\) \(\newcommand{\cvec}{\mathbf c}\) \(\newcommand{\dvec}{\mathbf d}\) \(\newcommand{\dtil}{\widetilde{\mathbf d}}\) \(\newcommand{\evec}{\mathbf e}\) \(\newcommand{\fvec}{\mathbf f}\) \(\newcommand{\nvec}{\mathbf n}\) \(\newcommand{\pvec}{\mathbf p}\) \(\newcommand{\qvec}{\mathbf q}\) \(\newcommand{\svec}{\mathbf s}\) \(\newcommand{\tvec}{\mathbf t}\) \(\newcommand{\uvec}{\mathbf u}\) \(\newcommand{\vvec}{\mathbf v}\) \(\newcommand{\wvec}{\mathbf w}\) \(\newcommand{\xvec}{\mathbf x}\) \(\newcommand{\yvec}{\mathbf y}\) \(\newcommand{\zvec}{\mathbf z}\) \(\newcommand{\rvec}{\mathbf r}\) \(\newcommand{\mvec}{\mathbf m}\) \(\newcommand{\zerovec}{\mathbf 0}\) \(\newcommand{\onevec}{\mathbf 1}\) \(\newcommand{\real}{\mathbb R}\) \(\newcommand{\twovec}[2]{\left[\begin{array}{r}#1 \\ #2 \end{array}\right]}\) \(\newcommand{\ctwovec}[2]{\left[\begin{array}{c}#1 \\ #2 \end{array}\right]}\) \(\newcommand{\threevec}[3]{\left[\begin{array}{r}#1 \\ #2 \\ #3 \end{array}\right]}\) \(\newcommand{\cthreevec}[3]{\left[\begin{array}{c}#1 \\ #2 \\ #3 \end{array}\right]}\) \(\newcommand{\fourvec}[4]{\left[\begin{array}{r}#1 \\ #2 \\ #3 \\ #4 \end{array}\right]}\) \(\newcommand{\cfourvec}[4]{\left[\begin{array}{c}#1 \\ #2 \\ #3 \\ #4 \end{array}\right]}\) \(\newcommand{\fivevec}[5]{\left[\begin{array}{r}#1 \\ #2 \\ #3 \\ #4 \\ #5 \\ \end{array}\right]}\) \(\newcommand{\cfivevec}[5]{\left[\begin{array}{c}#1 \\ #2 \\ #3 \\ #4 \\ #5 \\ \end{array}\right]}\) \(\newcommand{\mattwo}[4]{\left[\begin{array}{rr}#1 \amp #2 \\ #3 \amp #4 \\ \end{array}\right]}\) \(\newcommand{\laspan}[1]{\text{Span}\{#1\}}\) \(\newcommand{\bcal}{\cal B}\) \(\newcommand{\ccal}{\cal C}\) \(\newcommand{\scal}{\cal S}\) \(\newcommand{\wcal}{\cal W}\) \(\newcommand{\ecal}{\cal E}\) \(\newcommand{\coords}[2]{\left\{#1\right\}_{#2}}\) \(\newcommand{\gray}[1]{\color{gray}{#1}}\) \(\newcommand{\lgray}[1]{\color{lightgray}{#1}}\) \(\newcommand{\rank}{\operatorname{rank}}\) \(\newcommand{\row}{\text{Row}}\) \(\newcommand{\col}{\text{Col}}\) \(\renewcommand{\row}{\text{Row}}\) \(\newcommand{\nul}{\text{Nul}}\) \(\newcommand{\var}{\text{Var}}\) \(\newcommand{\corr}{\text{corr}}\) \(\newcommand{\len}[1]{\left|#1\right|}\) \(\newcommand{\bbar}{\overline{\bvec}}\) \(\newcommand{\bhat}{\widehat{\bvec}}\) \(\newcommand{\bperp}{\bvec^\perp}\) \(\newcommand{\xhat}{\widehat{\xvec}}\) \(\newcommand{\vhat}{\widehat{\vvec}}\) \(\newcommand{\uhat}{\widehat{\uvec}}\) \(\newcommand{\what}{\widehat{\wvec}}\) \(\newcommand{\Sighat}{\widehat{\Sigma}}\) \(\newcommand{\lt}{<}\) \(\newcommand{\gt}{>}\) \(\newcommand{\amp}{&}\) \(\definecolor{fillinmathshade}{gray}{0.9}\)Consider \(y = x + 1\) an equation in two variables. If we substitute the ordered pair \((x, y) = (1, 2)\) into the equation \(y = x + 1\), that is, if we replace x with 1 and y with 2, we get a true statement.
\[ \begin{aligned} y = x + 1 ~ & \textcolor{red}{ \text{ Original equation.}} \\ 2=1+1 ~ & \textcolor{red}{ \text{ Substitute: 1 for } x \text{ and 2 for } y.} \\ 2=2 ~ & \textcolor{red}{ \text{ Simplify.}} \end{aligned}\nonumber \]
We say that the ordered pair (1, 2) is a solution of the equation \(y = x + 1\).
If substituting the ordered pair (x, y)=(a, b) into an equation (replace x with a and y with b) produces a true statement, then the ordered pair (a, b) is called a solution of the equation and is said to “satisfy the equation.”
Which of the ordered pairs are solutions of the equation \(y = 2x + 5\): (a) (−3, −2), or (b) (5, 15)?
Solution
Substitute the points into the equation to determine which are solutions.
a) To determine if (−3, −2) is a solution of \(y = 2x + 5\), substitute −3 for x and −2 for y in the equation \(y = 2x + 5\).
\[ \begin{aligned} y = 2x + 5 ~ & \textcolor{red}{ \text{ Original equation.}} \\ −2 = 2(−3) + 5 ~ & \textcolor{red}{ \text{ Substitute: −3 for } x \text{ and } −2 \text{ for } y.} \\ −2 = −6+5 ~ & \textcolor{red}{ \text{ Multiply first: } 2(−3) = −6} \\ −2 = −1 ~ & \textcolor{red}{ \text{ Add: } −6+5= −1.} \end{aligned}\nonumber \]
Because the resulting statement is false, the ordered pair (−3, −2) does not satisfy the equation. The ordered pair (−3, −2) is not a solution of \(y = 2x + 5\).
a) To determine if (5, 15) is a solution of \(y = 2x + 5\), substitute 5 for x and 15 for y in the equation \(y = 2x + 5\).
\[ \begin{aligned} y = 2x + 5 ~ & \textcolor{red}{ \text{ Original equation.}} \\ 15 = 2(5) + 5 ~ & \textcolor{red}{ \text{ Substitute: 5 for } x \text{ and } 15 \text{ for } y.} \\ 15 = 10 + 5 ~ & \textcolor{red}{ \text{ Multiply first: } 2(5) = 10} \\ 15 = 15 ~ & \textcolor{red}{ \text{ Add: } 10 + 5 = 15.} \end{aligned}\nonumber \]
The resulting statement is true. The ordered pair (5, 15) does satisfy the equation. Hence, (5, 15) is a solution of \(y = 2x + 5\).
Which of the ordered pairs (1, 7) and (2, 9) are solution of the equation \(y = 3x + 4\)?
- Answer
-
(1, 7)
The Graph of an Equation
We turn our attention to the graph of an equation.
The graph of an equation is the set of all ordered pairs that are solutions of the equation.
In the equation \(y = 2x + 5\), the variable y depends on the value of the variable x. For this reason, we call y the dependent variable and x the independent variable. We’re free to make choices for x, but the value of y will depend upon our choice for x.
We will also assign the horizontal axis to the independent variable x and the vertical axis to the dependent variable y (see Figure 8.7).
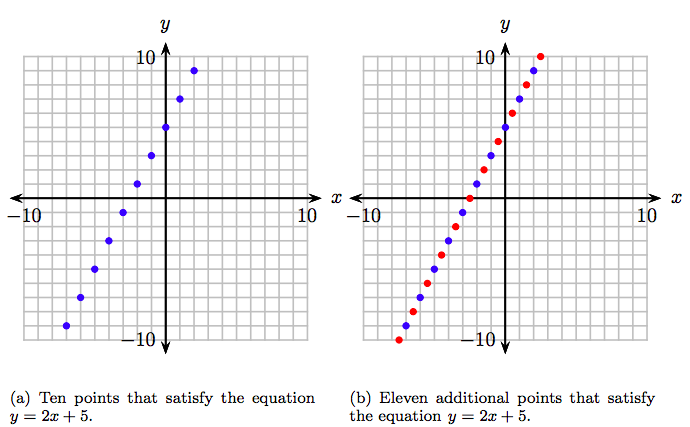
The graph of \(y = 2x+5\) consists of all ordered pairs that are solutions of the equation \(y = 2x+ 5\). So, our first task is to find ordered pairs that are solutions of \(y = 2x + 5\). This is easily accomplished by selecting an arbitrary number of values, substituting them for x in the equation \(y = 2x + 5\), then calculating the resulting values of y. With this thought in mind, we pick arbitrary integers −7, −6, . . . , 2, substitute them for x in the equation \(y = 2x + 5\), calculate the resulting value of y, and store the results in a table.
\[ \begin{array}{|r|r|r|r|} \hline y = 2x+5 & x & y & (x,~y) \\ \hline y = 2(−7) + 5 = −9 & −7 & −9 & (−7, −9) \\ y = 2(−6) + 5 = −7 & −6 & −7 & (−6, −7) \\ y = 2(−5) + 5 = −5 & −5 & −5 & (−5, −5) \\ y = 2(−4) + 5 = −3 & −4 & −3 & (−4, −3) \\ y = 2(−3) + 5 = −1 & −3 & −1 & (−3, −1) \\ y = 2(−2) + 5 = 1 & −2 & 1 & (−2, 1) \\ y = 2(−1) + 5 = 3 & −1 & 3 & (−1, 3) \\ y = 2(0) + 5 = 5 & 0 & 5 & (0, 5) \\ y = 2(1) + 5 = 7 & 1 & 7 & (1, 7) \\ y = 2(2) + 5 = 9 & 2 & 9 & (2, 9) \\ \hline \end{array}\nonumber \]
The result is 10 ordered pairs that satisfy the equation \(y = 2x + 5\). Therefore, we have 10 ordered pairs that belong to the graph of \(y = 2x + 5\). They are plotted in Figure 8.7(a).
However, we’re not finished, because the graph of the equation \(y = 2x + 5\) is the set of all points that satisfy the equation and we’ve only plotted 10 such points. Let’s plot some more points. Select some more x-values, compute the corresponding y-value, and record the results in a table.
\[ \begin{array}{|r|r|r|r|} \hline y = 2x + 5 & x & y & (x, y) \\ \hline y = 2(−7.5) + 5 = −10 & −7.5 & −10 & (−7.5, −10) \\ y = 2(−6.5) + 5 = −8 & −6.5 & −8 & (−6.5, −8) \\ y = 2(−5.5) + 5 = −6 & −5.5 & −6 & (−5.5, −6) \\ y = 2(−4.5) + 5 = −4 & −4.5 & −4 & (−4.5, −4) \\ y = 2(−3.5) + 5 = −2 & −3.5 & −2 & (−3.5, −2) \\ y = 2(−2.5) + 5 = 0 & −2.5 & 0 & (−2.5, 0) \\ y = 2(−1.5) + 5 = 2 & −1.5 & 2 & (−1.5, 2) \\ y = 2(−0.5) + 5 = 4 & −0.5 & 4 & (−0.5, 4) \\ y = 2(0.5) + 5 = 6 & 0.5 & 6 & (0.5, 6) \\ y = 2(1.5) + 5 = 8 & 1.5 & 8 & (1.5, 8) \\ y = 2(2.5) + 5 = 10 & 2.5 & 10 & (2.5, 10) \\ \hline \end{array}\nonumber \]
That’s 11 additional points that we add to the graph in Figure 8.7(b).
Note that we can continue indefinitely in this manner, adding points to the table and plotting them. However, sooner or later, we have to make a leap of faith, and imagine what the final graph will look like when all of the points that satisfy the equation y = 2x+ 5 are plotted. We do so in Figure 8.8, where the final graph takes on the appearance of a line.
All lines must be drawn with a ruler. This includes the x- and y-axes.
Important Observation. When we use a ruler to draw a line through the plotted points in Figure 8.7(b), arriving at the final result in Figure 8.8, we must understand that this is a shortcut technique for plotting all of the remaining ordered pairs that satisfy the equation. We’re not really drawing a line through the plotted points. Rather, we’re shading all of the ordered pairs that satisfy the equation \(y = 2x + 5\).
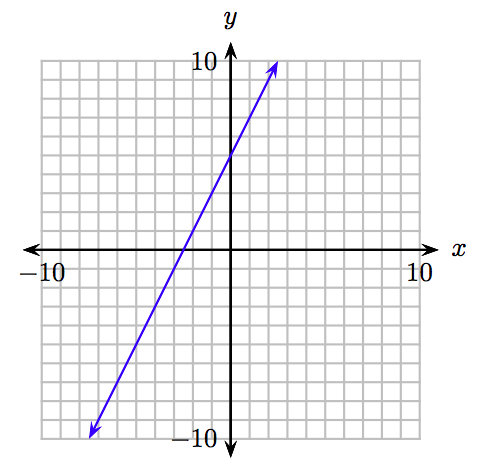
The Result. The graph of the equation \(y = 2x + 5\), pictured in Figure 8.8, is a line. Actually, the graph is an infinite collection of points satisfying the equation \(y = 2x + 5\) that takes the shape of a line, but it’s all right to say the graph of \(y = 2x + 5\) is a line.
Because the graph of an equation is the collection of all ordered pairs that satisfy the equation, we have two important results:
- If an ordered pair satisfies an equation, then the point in the Cartesian plane represented by the ordered pair is on the graph of the equation.
- If a point is on the graph of an equation, then the ordered pair representation of that point satisfies the equation.
Find the value of k so that the point (2, k) is on the graph of the equation \(y = 3x − 2\).
Solution
If the point (2, k) is on the graph of \(y = 3x−2\), then it must satisfy the equation \(y = 3x − 2\).
\[ \begin{aligned} y = 3x − 2 ~ & \textcolor{red}{ \text{ Original equation.}} \\ k = 3(2) − 2 ~ & \begin{array}{l} \textcolor{red}{ \text{ The point (2, } k) \text{ is on the graph.}} \\ \textcolor{red}{ \text{ Substitute 2 for } x \text{ and } k \text{ for } y \text{ in } y = 3x − 2.} \end{array} \\ k = 6 − 2 ~ & \textcolor{red}{ \text{ Multiply: } 3(2) = 6.} \\ k = 4 ~ & \textcolor{red}{ \text{ Subtract: } 6 − 2 = 4.} \end{aligned}\nonumber \]
Thus, k = 4.
Find the value of k so that the point (k, −3) is on the graph of the equation \(y = 4x + 2\).
- Answer
-
k = −5/4
Linear Equations
Let’s plot the graph of another equation.
Sketch the graph of \(y = −2x + 1\).
Solution
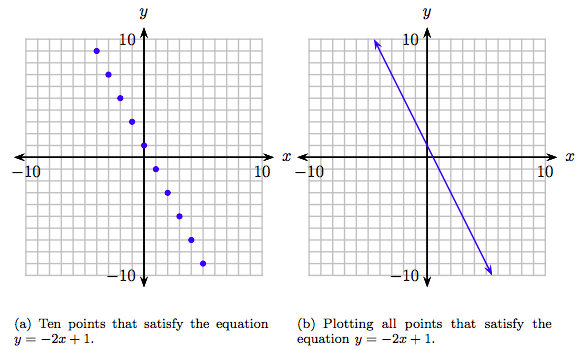
Select arbitrary values of x: −4, −3, . . . , 5. Substitute these values into the equation \(y = −2x + 1\), calculate the resulting value of y, then arrange your results in a table.
\[ \begin{array}{|r|r|r|r|} \hline y = −2x + 1 & x & y & (x, y) \\ \hline y = −2(−4) + 1 = 9 & −4 & 9 & (−4, 9) \\ y = −2(−3) + 1 = 7 & −3 & 7 & (−3, 7) \\ y = −2(−2) + 1 = 5 & −2 & 5 & (−2, 5) \\ y = −2(−1) + 1 = 3 & −1 & 3 & (−1, 3) \\ y = −2(0) + 1 = 1 & 0 & 1 & (0, 1) \\ y = −2(1) + 1 = −1 & 1 & −1 & (1, −1) \\ y = −2(2) + 1 = −3 & 2 & −3 & (2, −3) \\ y = −2(3) + 1 = −5 & 3 & −5 & (3, −5) \\ y = −2(4) + 1 = −7 & 4 & −7 & (4, −7) \\ y = −2(5) + 1 = −9 & 5 & −9 & (5, −9) \\ \hline \end{array}\nonumber \]
We’ve plotted the points in the table in Figure 8.9(a). There is enough evidence in Figure 8.9(a) to imagine that if we plotted all of the points that satisfied the equation \(y = −2x + 1\), the result would be the line shown in Figure 8.9(b).
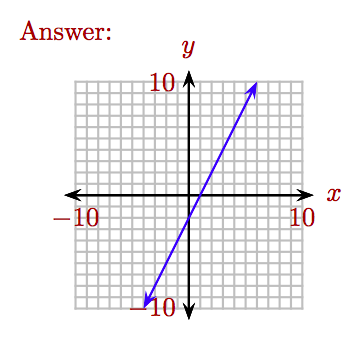
Sketch the graph of \(y = 2x − 2\).
- Answer
-
The graph of \(y = 2x + 5\) in Figure 8.8 is a line. The graph of \(y = −2x + 1\) in Figure 8.9(b) is also a line. This would lead one to suspect that the graph of the equation \(y = mx+b\), where m and b are constants, will always be a line. Indeed, this is always the case.
The graph of \(y = mx + b\), where m and b are constants, will always be a line. For this reason, the equation \(y = mx+b\) is called a linear equation.
Which of the following equations is a linear equation? 1. \(y = −3x + 4\), 2. \(y = \frac{2}{3}x + 3\), and 3. \(y = 2x^2 + 4\).
Solution
Compare each equation with the general form of a linear equation, \(y = mx + b\).
- Note that \(y = −3x + 4\) has the form \(y = mx + b\), where m = −3 and b = 4. Hence, \(y = −3x + 4\) is a linear equation. Its graph is a line.
- Note that \(y = \frac{2}{3} x+ 3\) has the form \(y = mx+b\), where m = 2/3 and b = 3. Hence, \(y = \frac{2}{3} x + 3\) is a linear equation. Its graph is a line.
- The equation \(y = 2x^2 + 4\) does not have the form \(y = mx + b\). The exponent of 2 on the x prevents this equation from being linear. This is a nonlinear equation. Its graph is not a line.
Which of the following equations is a linear equation? a) \(y = 2x^3 + 5\) b) \(y= -3x-5\)
- Answer
-
\(y = −3x − 5\)
The fact that \(y = mx + b\) is a linear equation enables us to quickly sketch its graph.
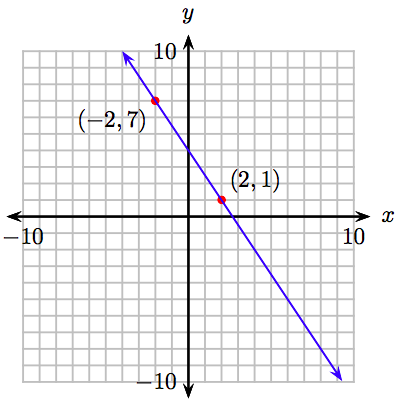
Sketch the graph of \(y = − \frac{3}{2} x + 4\).
Solution
The equation \(y = −3 2x+ 4\) has the form \(y = mx+b\). Therefore, the equation is linear and the graph will be a line. Because two points determine a line, we need only find two points that satisfy the equation \(y = − \frac{3}{2} x + 4\), plot them, then draw a line through them with a ruler. We choose x = −2 and x = 2, calculate y, and record the results in a table.
\[ \begin{array}{|r|r|r|r|} \hline y = − \frac{3}{2} x + 4 & x & y & (x, y) \\ \hline y = − \frac{3}{2} (−2) + 4 = 3 + 4 = 7 & −2 & 7 & (−2, 7) \\ y = − \frac{3}{2} (2) + 4 = −3+4=1 & 2 & 1 & (2, 1) \\ \hline \end{array}\nonumber \]
Plot the points (−2, 7) and (2, 1) and draw a line through them. The result is shown in Figure 8.10.
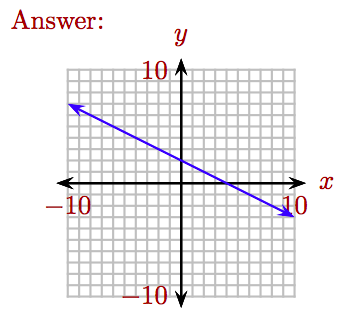
Sketch the graph of \(y = − \frac{1}{2} x + 2\).
- Answer
-
You may have noted in Example 5 that are choices of −2 and 2 for x eased the calculation of the corresponding y-values because of the resulting cancellation.
When plotting a linear equation, it is a good strategy to choose values of x that simplify the calculation of the corresponding y-values.
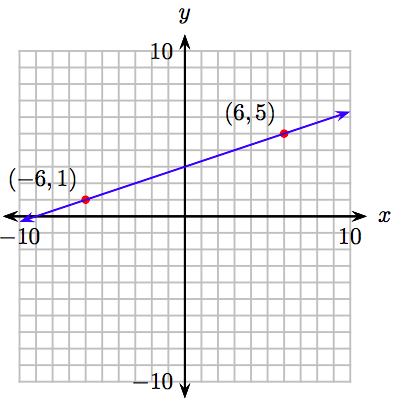
Sketch the graph of y = \frac{1}{3} x + 3.
Solution
The equation \(y = \frac{1}{3} x + 3\) has the form \(y = mx + b\). Therefore, the equation is linear and the graph will be a line. Because two points determine a line, we need only find two points that satisfy the equation y = 1 3x + 3, plot them, then draw a line through them with a ruler. We choose x = −6 and x = 6, calculate y, and record the results in a table.
\[ \begin{array}{|r|r|r|r|} \hline y = \frac{1}{3} x + 3 & x & y & (x, y) \\ \hline y = \frac{1}{3} (−6) + 3 = −2+3=1 & −6 & 1 & (−6, 1) \\ y = \frac{1}{3} (6) + 3 = 2 + 3 = 5 & 6 & 5 & (6, 5) \\ \hline \end{array}\nonumber \]
Plot the points (−6, 1) and (6, 5) and draw a line through them. The result is shown in Figure 8.11.
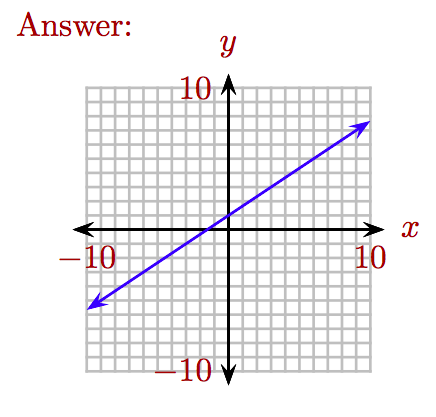
Sketch the graph of \(y = \frac{2}{3} x + 1\).
- Answer
-
Exercises
1. Which of the points (2, −14), (−1, −6), (−8, 11), and (3, −13) is a solution of the equation \(y = −2x − 8\)?
2. Which of the points (1, −2), (8, 23), (−3, −23), and (8, 24) is a solution of the equation \(y = 4x − 9\)?
3. Which of the points (1, −1), (−2, 20), (−4, 31), and (−9, 64) is a solution of the equation \(y = −6x + 7\)?
4. Which of the points (−8, −61), (4, 42), (−3, −18), and (−6, −46) is a solution of the equation \(y = 9x + 8\)?
5. Which of the points (2, 15), (−8, −74), (2, 18), and (5, 40) is a solution of the equation \(y = 9x − 3\)?
6. Which of the points (−9, −52), (−8, −44), (−7, −37), and (8, 35) is a solution of the equation \(y = 5x − 5\)?
7. Which of the points (−2, 12), (−1, 12), (3, −10), and (−2, 14) is a solution of the equation \(y = −5x + 4\)?
8. Which of the points (6, 25), (−8, −14), (8, 33), and (−7, −9) is a solution of the equation \(y = 3x + 9\)?
9. Determine k so that the point (9, k) is a solution of \(y = −6x + 1\).
10. Determine k so that the point (−9, k) is a solution of \(y = 2x + 3\).
11. Determine k so that the point (k, 7) is a solution of \(y = −4x + 1\).
12. Determine k so that the point (k, −4) is a solution of \(y = 8x + 3\).
13. Determine k so that the point (k, 1) is a solution of \(y = 4x + 8\).
14. Determine k so that the point (k, −7) is a solution of \(y = −7x + 5\).
15. Determine k so that the point (−1, k) is a solution of \(y = −5x + 3\).
16. Determine k so that the point (−3, k) is a solution of \(y = 3x + 3\).
In Exercises 17-24, which of the given equations is a linear equation?
17. \(y = 6x^2 + 4, ~ y = x^2 + 6x + 4, ~ y = 6x + 4, ~ y = \sqrt{6x + 4}\)
18. \(y = −2x + 1, ~ y = x^2 − 2x + 1, ~ y = \sqrt{−2x + 1}, ~ y = −2x^2 + 1\)
19. \(y = x + 7, ~ y = \sqrt{x + 7}, ~ y = x^2 + 7, ~ y = x^2 + x + 7\)
20. \(y = x^2 + 5x + 1, ~ y = 5x^2 + 1, ~ y = \sqrt{5x + 1}, ~ y = 5x + 1\)
21. \(y = x^2 − 2x − 2, ~ y = −2x^2 − 2, ~ y = \sqrt{−2x − 2}, ~ y = −2x − 2\)
22. \(y = x^2 + 5x − 8, ~ y = 5x^2 − 8, ~ y = \sqrt{5x − 8}, ~ y = 5x − 8\)
23. \(y = x^2 + 7x − 3, ~ y = 7x^2 − 3, ~ y = 7x − 3, ~ y = \sqrt{7x − 3}\)
24. \(y = \sqrt{−4x − 3}, ~ y = x^2 − 4x − 3, ~ y = −4x − 3, ~ y = −4x^2 − 3\)
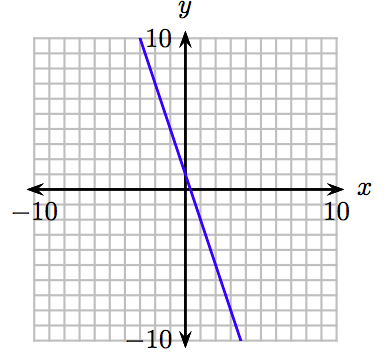
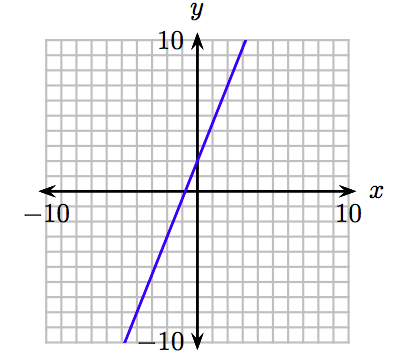
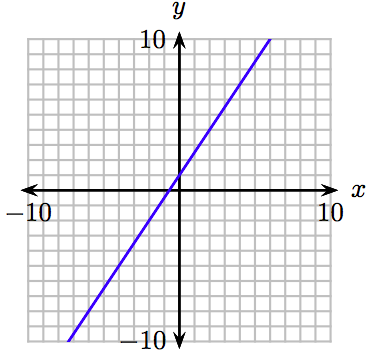
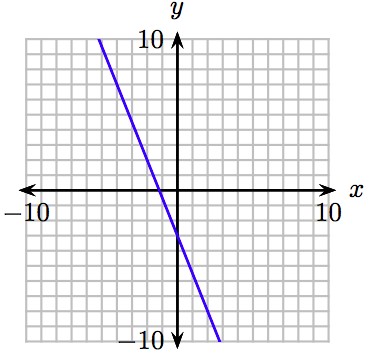
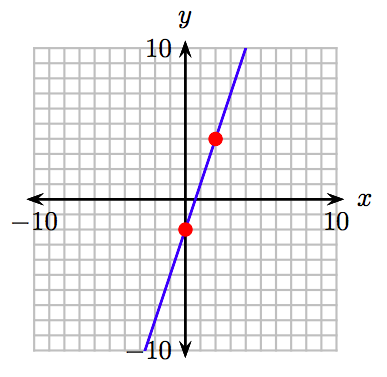
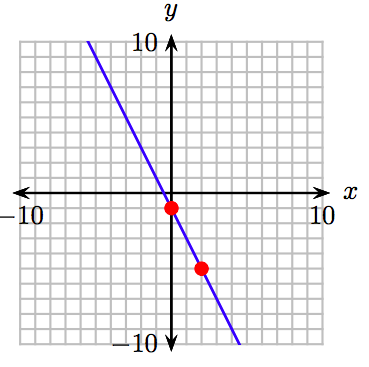
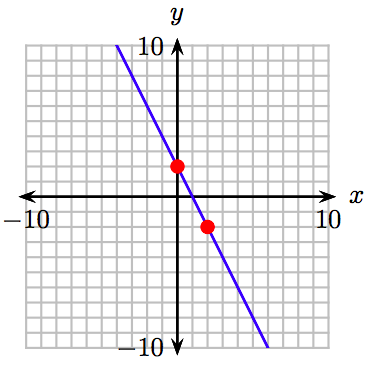
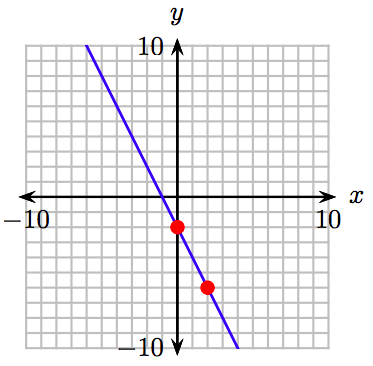
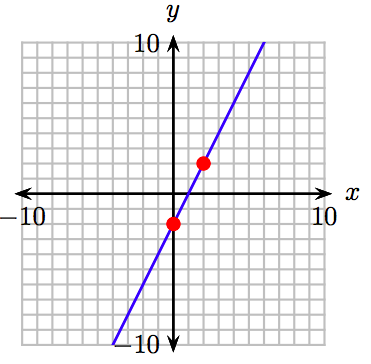
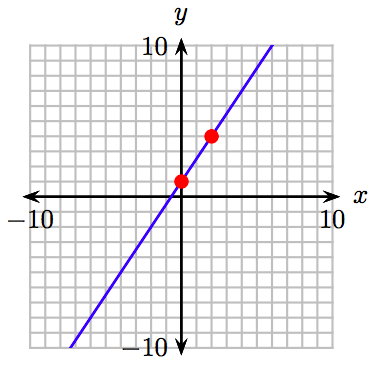
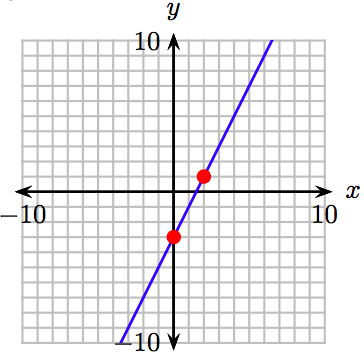
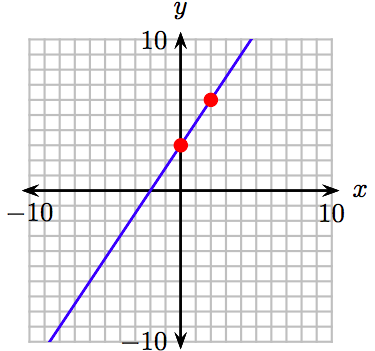
In Exercises 25-28, which of the given equations has the given graph?
25. \(y = − \frac{3}{2}x + 2, ~ y = \frac{3}{2} x − 3, ~ y = −3x + 1, ~ y = −2x + 1\)
26. \(y = −3x − 2, ~ y = \frac{3}{2} x + 1, ~ y = −2x − 1, ~ y = \frac{5}{2}x + \)2
27. \(y = \frac{5}{2} x − 2, ~ y = 3x + 3, ~ y = \frac{3}{2} x + 1, ~ y = \frac{1}{2} x + 1\)
28. \(y = 3x + 1, ~ y = \frac{5}{2} x − 1, ~ y = − \frac{5}{2} x − 3, ~ y = \frac{3}{2} x − 2\)
29. \(y = 3x − 2\)
30. \(y = \frac{5}{2}x + 1\)
31. \(y = −2x − 1\)
32. \(y = \frac{5}{2} x + 2\)
33. \(y = −2x + 2\)
34. \(y = − \frac{5}{2}x − 2\)
35. \(y = −2x − 2\)
36. \(y = − \frac{5}{2}x + 1\)
37. \(y = 2x − 2\)
38. \(y = \frac{5}{2} x − 1\)
39. \(y = \frac{3}{2}x + 1\)
40. \(y = 2x + 2\)
41. \(y = 2x − 3\)
42. \(y = − \frac{5}{2}x − 1\)
43. \(y = \frac{3}{2}x + 3\)
44. \(y = 3x + 1\)
45. Sketch the lines \(y = \frac{1}{2} x−1\) and \(y = \frac{5}{2} x−2\) on graph paper. As you sweep your eyes from left to right, which line rises more quickly?
46. Sketch the lines \(y = \frac{5}{2} x+ 1\) and \(y = 3x+ 1\) on graph paper. As you sweep your eyes from left to right, which line rises more quickly?
47. Sketch the line \(y = − \frac{1}{2} x + 1\) and \(y = −3x+ 3\). As you sweep your eyes from left to right, which line falls more quickly?
48. Sketch the line \(y = −3x − 1\) and \(y = − \frac{5}{2} x−2\). As you sweep your eyes from left to right, which line falls more quickly?
49. Sketch the line \(y = −3x − 1\) and \(y = − \frac{1}{2} x−2\). As you sweep your eyes from left to right, which line falls more quickly?
50. Sketch the line \(y = −3x − 1\) and \(y = − \frac{1}{2}x+1\). As you sweep your eyes from left to right, which line falls more quickly?
51. Sketch the lines \(y = \frac{3}{2} x−2\) and \(y = 3x+ 1\) on graph paper. As you sweep your eyes from left to right, which line rises more quickly?
52. Sketch the lines \(y = \frac{1}{2} x+ 3\) and \(y = \frac{5}{2}x+ 1\) on graph paper. As you sweep your eyes from left to right, which line rises more quickly?
Answers
1. (−1, −6)
3. (−4, 31)
5. (2, 15)
7. (−2, 14)
9. k = −53
11. k = \(− \frac{3}{2}\)
13. k = \(− \frac{7}{4}\)
15. k = 8
17. \(y = 6x + 4\)
19. \(y = x + 7\)
21. \(y = −2x − 2\)
23. \(y = 7x − 3\)
25. \(y = −3x + 1\)
27. \(y = \frac{3}{2} x + 1\)
29. \(y = 3x − 2\)
31. \(y = −2x − 1\)
33. \(y = −2x + 2\)
35. \(y = −2x -2\)
37. \(y = 2x-2\)
39. \(y = \frac{3}{2} + 1\)
41. \(y = 2x − 3\)
43. \(y = \frac{3}{2} x + 3\)
45. The graph of \(y = \frac{5}{2} x−2\) rises more quickly.
47. The graph of \(y = −3x + 3\) falls more quickly.
49. The graph of \(y = −3x − 1\) falls more quickly.
51. The graph of \(y = 3x+1\) rises more quickly.