
2.5: Combining the Transformations
- Page ID
- 37217

\( \newcommand{\vecs}[1]{\overset { \scriptstyle \rightharpoonup} {\mathbf{#1}} } \)
\( \newcommand{\vecd}[1]{\overset{-\!-\!\rightharpoonup}{\vphantom{a}\smash {#1}}} \)
\( \newcommand{\dsum}{\displaystyle\sum\limits} \)
\( \newcommand{\dint}{\displaystyle\int\limits} \)
\( \newcommand{\dlim}{\displaystyle\lim\limits} \)
\( \newcommand{\id}{\mathrm{id}}\) \( \newcommand{\Span}{\mathrm{span}}\)
( \newcommand{\kernel}{\mathrm{null}\,}\) \( \newcommand{\range}{\mathrm{range}\,}\)
\( \newcommand{\RealPart}{\mathrm{Re}}\) \( \newcommand{\ImaginaryPart}{\mathrm{Im}}\)
\( \newcommand{\Argument}{\mathrm{Arg}}\) \( \newcommand{\norm}[1]{\| #1 \|}\)
\( \newcommand{\inner}[2]{\langle #1, #2 \rangle}\)
\( \newcommand{\Span}{\mathrm{span}}\)
\( \newcommand{\id}{\mathrm{id}}\)
\( \newcommand{\Span}{\mathrm{span}}\)
\( \newcommand{\kernel}{\mathrm{null}\,}\)
\( \newcommand{\range}{\mathrm{range}\,}\)
\( \newcommand{\RealPart}{\mathrm{Re}}\)
\( \newcommand{\ImaginaryPart}{\mathrm{Im}}\)
\( \newcommand{\Argument}{\mathrm{Arg}}\)
\( \newcommand{\norm}[1]{\| #1 \|}\)
\( \newcommand{\inner}[2]{\langle #1, #2 \rangle}\)
\( \newcommand{\Span}{\mathrm{span}}\) \( \newcommand{\AA}{\unicode[.8,0]{x212B}}\)
\( \newcommand{\vectorA}[1]{\vec{#1}} % arrow\)
\( \newcommand{\vectorAt}[1]{\vec{\text{#1}}} % arrow\)
\( \newcommand{\vectorB}[1]{\overset { \scriptstyle \rightharpoonup} {\mathbf{#1}} } \)
\( \newcommand{\vectorC}[1]{\textbf{#1}} \)
\( \newcommand{\vectorD}[1]{\overrightarrow{#1}} \)
\( \newcommand{\vectorDt}[1]{\overrightarrow{\text{#1}}} \)
\( \newcommand{\vectE}[1]{\overset{-\!-\!\rightharpoonup}{\vphantom{a}\smash{\mathbf {#1}}}} \)
\( \newcommand{\vecs}[1]{\overset { \scriptstyle \rightharpoonup} {\mathbf{#1}} } \)
\(\newcommand{\longvect}{\overrightarrow}\)
\( \newcommand{\vecd}[1]{\overset{-\!-\!\rightharpoonup}{\vphantom{a}\smash {#1}}} \)
\(\newcommand{\avec}{\mathbf a}\) \(\newcommand{\bvec}{\mathbf b}\) \(\newcommand{\cvec}{\mathbf c}\) \(\newcommand{\dvec}{\mathbf d}\) \(\newcommand{\dtil}{\widetilde{\mathbf d}}\) \(\newcommand{\evec}{\mathbf e}\) \(\newcommand{\fvec}{\mathbf f}\) \(\newcommand{\nvec}{\mathbf n}\) \(\newcommand{\pvec}{\mathbf p}\) \(\newcommand{\qvec}{\mathbf q}\) \(\newcommand{\svec}{\mathbf s}\) \(\newcommand{\tvec}{\mathbf t}\) \(\newcommand{\uvec}{\mathbf u}\) \(\newcommand{\vvec}{\mathbf v}\) \(\newcommand{\wvec}{\mathbf w}\) \(\newcommand{\xvec}{\mathbf x}\) \(\newcommand{\yvec}{\mathbf y}\) \(\newcommand{\zvec}{\mathbf z}\) \(\newcommand{\rvec}{\mathbf r}\) \(\newcommand{\mvec}{\mathbf m}\) \(\newcommand{\zerovec}{\mathbf 0}\) \(\newcommand{\onevec}{\mathbf 1}\) \(\newcommand{\real}{\mathbb R}\) \(\newcommand{\twovec}[2]{\left[\begin{array}{r}#1 \\ #2 \end{array}\right]}\) \(\newcommand{\ctwovec}[2]{\left[\begin{array}{c}#1 \\ #2 \end{array}\right]}\) \(\newcommand{\threevec}[3]{\left[\begin{array}{r}#1 \\ #2 \\ #3 \end{array}\right]}\) \(\newcommand{\cthreevec}[3]{\left[\begin{array}{c}#1 \\ #2 \\ #3 \end{array}\right]}\) \(\newcommand{\fourvec}[4]{\left[\begin{array}{r}#1 \\ #2 \\ #3 \\ #4 \end{array}\right]}\) \(\newcommand{\cfourvec}[4]{\left[\begin{array}{c}#1 \\ #2 \\ #3 \\ #4 \end{array}\right]}\) \(\newcommand{\fivevec}[5]{\left[\begin{array}{r}#1 \\ #2 \\ #3 \\ #4 \\ #5 \\ \end{array}\right]}\) \(\newcommand{\cfivevec}[5]{\left[\begin{array}{c}#1 \\ #2 \\ #3 \\ #4 \\ #5 \\ \end{array}\right]}\) \(\newcommand{\mattwo}[4]{\left[\begin{array}{rr}#1 \amp #2 \\ #3 \amp #4 \\ \end{array}\right]}\) \(\newcommand{\laspan}[1]{\text{Span}\{#1\}}\) \(\newcommand{\bcal}{\cal B}\) \(\newcommand{\ccal}{\cal C}\) \(\newcommand{\scal}{\cal S}\) \(\newcommand{\wcal}{\cal W}\) \(\newcommand{\ecal}{\cal E}\) \(\newcommand{\coords}[2]{\left\{#1\right\}_{#2}}\) \(\newcommand{\gray}[1]{\color{gray}{#1}}\) \(\newcommand{\lgray}[1]{\color{lightgray}{#1}}\) \(\newcommand{\rank}{\operatorname{rank}}\) \(\newcommand{\row}{\text{Row}}\) \(\newcommand{\col}{\text{Col}}\) \(\renewcommand{\row}{\text{Row}}\) \(\newcommand{\nul}{\text{Nul}}\) \(\newcommand{\var}{\text{Var}}\) \(\newcommand{\corr}{\text{corr}}\) \(\newcommand{\len}[1]{\left|#1\right|}\) \(\newcommand{\bbar}{\overline{\bvec}}\) \(\newcommand{\bhat}{\widehat{\bvec}}\) \(\newcommand{\bperp}{\bvec^\perp}\) \(\newcommand{\xhat}{\widehat{\xvec}}\) \(\newcommand{\vhat}{\widehat{\vvec}}\) \(\newcommand{\uhat}{\widehat{\uvec}}\) \(\newcommand{\what}{\widehat{\wvec}}\) \(\newcommand{\Sighat}{\widehat{\Sigma}}\) \(\newcommand{\lt}{<}\) \(\newcommand{\gt}{>}\) \(\newcommand{\amp}{&}\) \(\definecolor{fillinmathshade}{gray}{0.9}\)In the previous sections, we have seen how the various transformations act on the trigonometric functions and we have worked with the first three (amplitude, period and vertical shift) in combination with each other. Combining the phase shift with the other transformations is tricky because of the way that the period and the phase shift interact with each other.
Now we have two standard equations for the sinusoid:
\[
y=A \sin (B x+C)+D
\]
and
\[
y=A \cos (B x+C)+D
\]
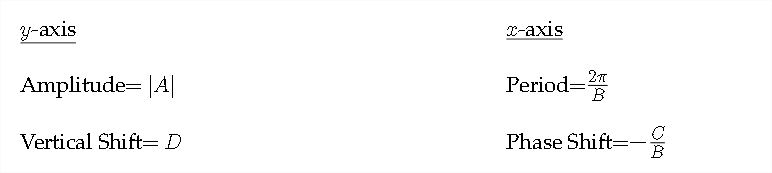
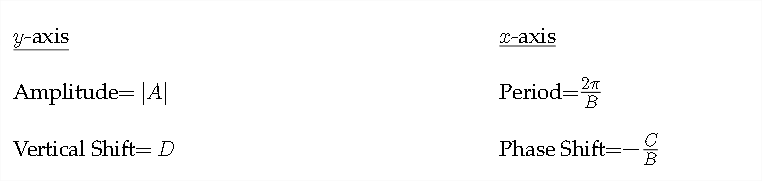
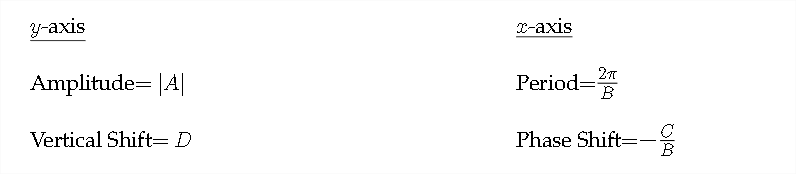
\(A\) and \(D,\) the amplitude and the vertical shift affect the \(y\) -axis, while \(B\) and \(C\) affect the \(x\) -axis.
Let's look at an example in which we need to combine a change in the period of the graph with a phase shift.
Example 1
Graph at least one period of the given function. Indicate the important values along the \(x\) and \(y\) axes.
\(y=\cos (4 x+\pi)\)
The transformations in this example only affect the \(x\) -axis. The period of the function is \(\frac{2 \pi}{B}=\frac{2 \pi}{4}=\frac{\pi}{2} .\) So, the function will complete one full cycle over a distance of \(\frac{\pi}{2}\) along the \(x\) -axis.
However, because of the phase shift, this graph will not start at 0 and end at \(\frac{\pi}{2} .\) We need to find the new starting point that is caused by the phase shift. So, we take what is called the "argument," or what it is we're finding the cosine of: \((4 x+\pi)\) and set that equal to zero.
\[
\begin{array}{c}
4 x+\pi=0 \\
4 x=-\pi \\
x=-\frac{\pi}{4}
\end{array}
\]
This is our new starting point. To identify the critical values along the \(x\) -axis, we'll need to determine how far each "jump \(^{\prime \prime}\) would be given a period of \(\frac{\pi}{2}\)
\[
\frac{\pi}{2} * \frac{1}{4}=\frac{\pi}{8}
\]
So, each subsequent critical value along the \(x\) -axis will be a distance of \(\frac{\pi}{8}\) from the previous one. If we start at our new starting point for this function \(-\frac{\pi}{4},\) then if we add \(\frac{\pi}{8}\) a total of 4 times, we will arrive at each of the five critical values for this function.
So, each subsequent critical value along the \(x\) -axis will be a distance of \(\frac{\pi}{8}\) from the previous one. If we start at our new starting point for this function \(-\frac{\pi}{4},\) then if we add \(\frac{\pi}{8}\) a total of 4 times, we will arrive at each of the five critical values for this function
\[
\begin{array}{c}
-\frac{\pi}{4}+\frac{\pi}{8}=-\frac{2 \pi}{8}+\frac{\pi}{8}=-\frac{\pi}{8} \\
-\frac{\pi}{8}+\frac{\pi}{8}=0 \\
0+\frac{\pi}{8}=\frac{\pi}{8} \\
\frac{\pi}{8}+\frac{\pi}{8}=\frac{2 \pi}{8}=\frac{\pi}{4}
\end{array}
\]
So the critical values along the \(x\) -axis would be:
\[
-\frac{\pi}{4},-\frac{\pi}{8}, 0, \frac{\pi}{8}, \text { and } \frac{\pi}{4}
\]
Notice that the distance between the starting point \(-\frac{\pi}{4}\) and the ending point \(\frac{\pi}{4}\) is equal to the period we found at the beginning of the problem, which was \(\frac{\pi}{2} .\) Now let's graph the function:
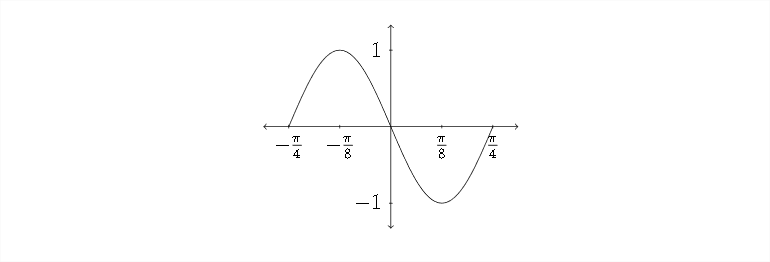
since there were no changes to the \(y\) -axis, the amplitude for the function is 1 and the vertical shift is 0. Along the \(x\) -axis, we see a positive sine function that starts \(\operatorname{at}\left(-\frac{\pi}{4}, 0\right)\) then goes up to \(\left(-\frac{\pi}{8}, 1\right),\) back down through (0,0) to \(\left(\frac{\pi}{8},-1\right)\) and back up to \(\left(\frac{\pi}{4}, 0\right)\) to complete one full cycle of the graph.
Let's look at an example in which there are some changes to the \(y\) -axis as well as the \(x\) -axis.
Example 2
Graph at least one period of the given function. Be sure to identify critical values along the \(x\) and \(y\) axes.
\[
y=-\frac{5}{2}+\cos (3 x-\pi)
\]
Remember which coefficients affect which axis in graphing:
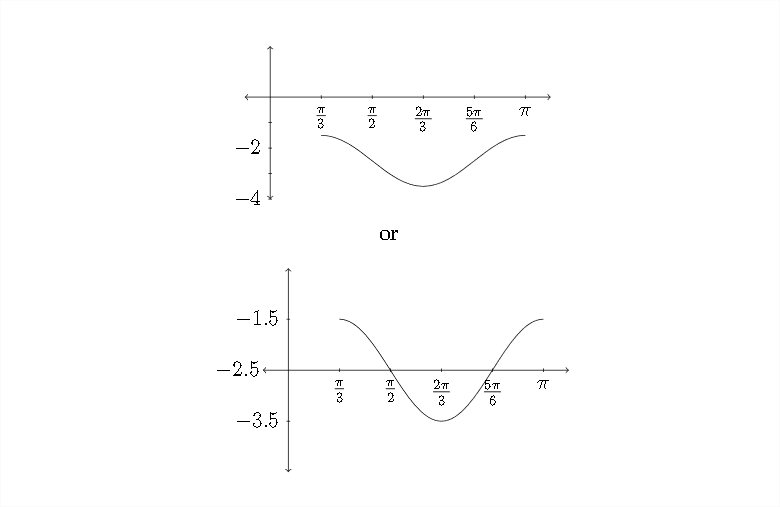
In this example, the amplitude is \(1,\) since there is no coefficient in front of the cosine function. The vertical shift is \(-\frac{5}{2},\) which will shift the function down a distance of 2.5 on the \(y\) -axis. So, the mid-line or "zero" points of the graph will be at \(-2.5,\) the maximum \(y\) value will be -1.5 and the minimum \(y\) value will be -3.5
Along the \(x\) -axis, the period for the graph will be \(\frac{2 \pi}{B}=\frac{2 \pi}{3},\) since the coefficient \(B\) in this problem is \(3 .\) To find the new starting point, we'll take the argument of the cosine function and set it equal to zero.
\[
\begin{array}{c}
3 x-\pi=0 \\
3 x=\pi \\
x=\pi * \frac{1}{3}=\frac{\pi}{3}
\end{array}
\]
So, our new starting point will be at \(\frac{\pi}{3} .\) To determine the other critical values along the \(x\) -axis, we can find out how far each "jump" between the critical values would be. To do this, we take the period \(\left(\frac{2 \pi}{3}\right)\) and divide it by 4 (or multiply by
\(\left.\frac{1}{4}\right)\)
\[
\frac{2 \pi}{3} * \frac{1}{4}=\frac{2 \pi}{12}=\frac{\pi}{6}
\]
Now we can add this value to our new starting point four times to determine the other critical values along the \(x\) -axis.
\[
\begin{array}{c}
\frac{\pi}{3}+\frac{\pi}{6}=\frac{2 \pi}{6}+\frac{\pi}{6}=\frac{3 \pi}{6}=\frac{\pi}{2} \\
\frac{3 \pi}{6}+\frac{\pi}{6}=\frac{4 \pi}{6}=\frac{2 \pi}{3} \\
\frac{4 \pi}{6}+\frac{\pi}{6}=\frac{5 \pi}{6} \\
\frac{5 \pi}{6}+\frac{\pi}{6}=\pi
\end{array}
\]
So the critical values along the \(x\) -axis would be:
\[
\frac{2 \pi}{6}, \frac{3 \pi}{6}, \frac{4 \pi}{6}, \frac{5 \pi}{6}, \text { and } \frac{6 \pi}{6}
\]
\[
\begin{array}{c}
\text { or } \\
\frac{\pi}{3}, \frac{\pi}{2}, \frac{2 \pi}{3}, \frac{5 \pi}{6}, \text { and } \pi
\end{array}
\]
Again, notice that the distance along the \(x\) -axis from the starting point to the ending point is the period: \(\frac{2 \pi}{3} .\) Now let's graph the function:
Let's look at one more example.
Example 3
Sometimes the coefficient \(B\) appears factored out of the argument as it does in the problem below.
Graph at least one period of the given function. Be sure to include the critical values along the \(x\) and \(y\) axes.
\(y=4 \sin 2\left(x+\frac{\pi}{3}\right)-1\)
First let's see how the \(x\) and \(y\) axes are affected by the transformations in this problem.
\[
y=4 \sin 2\left(x+\frac{\pi}{3}\right)-1
\]
The amplitude in this problem is 4 and the vertical shift is -1
The period for this graph is \(\frac{2 \pi}{B}=\frac{2 \pi}{2}=\pi .\) Notice that the value of \(B\) is 2 in this example, even though it's been factored out from the rest of the argument.
The new starting point for the graph is actually easier to find in problems of this type. If we take the argument as it is and set it equal to zero:
\[
2\left(x+\frac{\pi}{3}\right)=0
\]
we can divide through on both sides by 2 to cancel out the factor of \(B\) :
\[
\begin{array}{c}
\frac{2\left(x+\frac{\pi}{3}\right)}{2}=\frac{0}{2} \\
x+\frac{\pi}{3}=0 \\
x=-\frac{\pi}{3}
\end{array}
\]
So, the new starting point for the function is \(-\frac{\pi}{3}\)
Now let's find the rest of the critical values along the \(x\) -axis. The period for this graph is \(\pi,\) so the "jump " between the critical values along the \(x\) -axis will be:
\[
\pi * \frac{1}{4}=\frac{\pi}{4}
\]
To find the rest of the critical values we'll need to add \(\frac{\pi}{4}\) to the starting point of the graph \(\left(-\frac{\pi}{3}\right)\) four times:
\[
\begin{array}{c}
-\frac{\pi}{3}+\frac{\pi}{4}=-\frac{4 \pi}{12}+\frac{3 \pi}{12}=-\frac{\pi}{12} \\
-\frac{\pi}{12}+\frac{3 \pi}{12}=\frac{2 \pi}{12}=\frac{\pi}{6} \\
\frac{2 \pi}{12}+\frac{3 \pi}{12}=\frac{5 \pi}{12} \\
\frac{5 \pi}{12}+\frac{3 \pi}{12}=\frac{8 \pi}{12}=\frac{2 \pi}{3}
\end{array}
\]
So the critical values along the \(x\) -axis would be:
\[
-\frac{4 \pi}{12},-\frac{1 \pi}{12}, \frac{2 \pi}{12}, \frac{5 \pi}{12}, \text { and } \frac{8 \pi}{12}
\]
Or
\[
-\frac{\pi}{3},-\frac{\pi}{12}, \frac{\pi}{6}, \frac{5 \pi}{12}, \text { and } \frac{2 \pi}{3}
\]
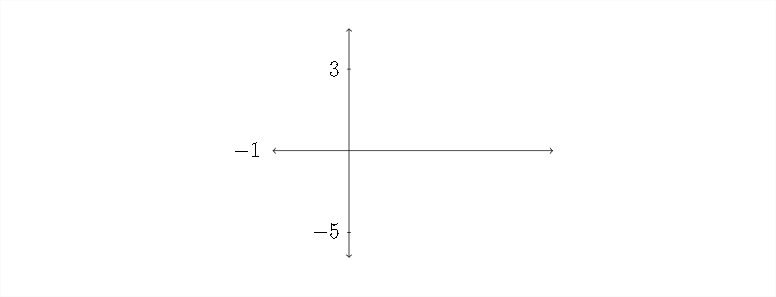
Now that we've addressed each of the four transformations let's use this information to draw the graph. First the \(y\) -axis - the amplitude is 4 and the vertical shift is -1:
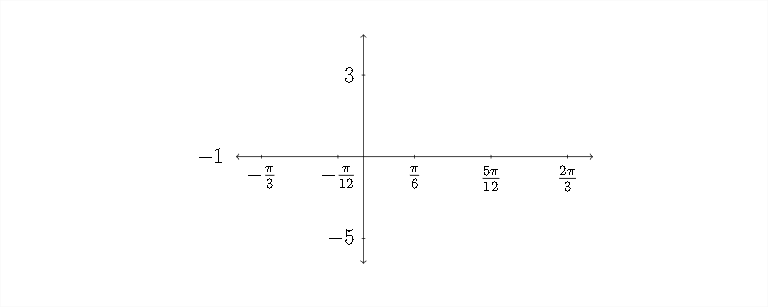
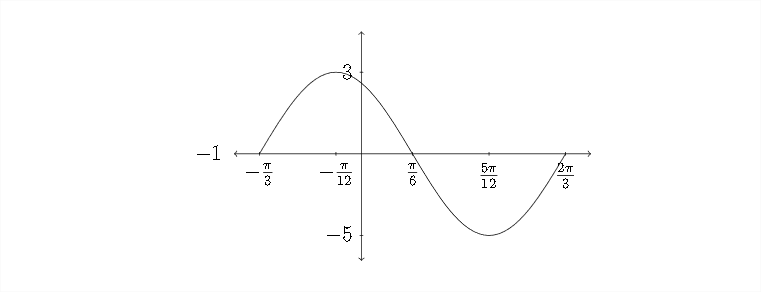
Now, let's fill in the information for the \(x\) -axis. The critical values along the \(x\) -axis \(\operatorname{are}-\frac{\pi}{3},-\frac{\pi}{12}, \frac{\pi}{6}, \frac{5 \pi}{12},\) and \(\frac{2 \pi}{3}\)
The function we're graphing is a positive sine function, so it will start at the "midline" or zero value (which in this case is -1 ), go up to the maximum, back through the mid-line to the minimum and back to the mid-line:
Determine the Amplitude, Period, Vertical Shift and Phase Shift for each function and graph at least one complete period. Be sure to identify the critical values along the \(x\) and \(y\) axes.
1. \(\quad y=\sin \left(x+\frac{\pi}{2}\right)\)
2. \(\quad y=\sin (x-\pi)\)
3. \(\quad y=3 \cos \left(x-\frac{\pi}{2}\right)\)
4. \(y=\frac{1}{2} \cos (x+\pi)\)
5. \(\quad y=3+\cos \left(x-\frac{\pi}{4}\right)\)
6. \(\quad y=-2+\sin \left(x+\frac{\pi}{6}\right)\)
7. \(\quad y=\sin (2 x-\pi)\)
\(8 . \quad y=\sin \left(4 x+\frac{\pi}{4}\right)\)
\(9 . \quad y=2 \cos \left(\frac{x}{2}+\pi\right)\)
\(10 . \quad y=-3 \sin (6 x-\pi)\)
11. \(y=-\frac{1}{3} \sin \left(2 x+\frac{\pi}{4}\right) \quad\)
12. \(\quad y=\frac{1}{2} \cos \left(\frac{x}{2}-\pi\right)\)
13. \(\quad y=2 \sin \left(2 x-\frac{\pi}{3}\right)-1\)
\(14 . \quad y=1+2 \cos \left(3 x+\frac{\pi}{2}\right)\)
15. \(\quad y=3 \cos 2\left(x+\frac{\pi}{6}\right)\)
16. \(\quad y=-4 \sin 2\left(x+\frac{\pi}{2}\right)\)
\(17 . \quad y=\sin \frac{1}{2}\left(x+\frac{\pi}{4}\right)\)
18. \(\quad y=3+2 \sin 3\left(x+\frac{\pi}{2}\right)\)
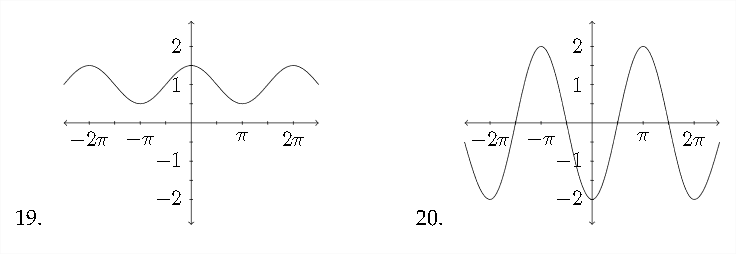
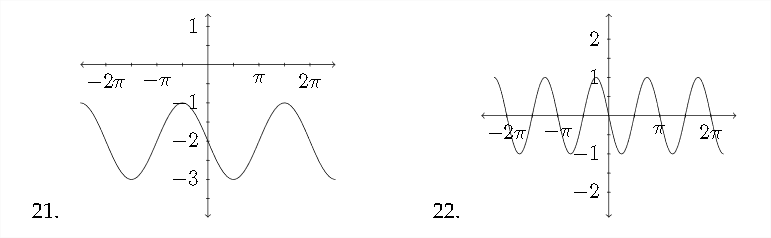
In problems \(19-22,\) determine an equation for the function that is shown.
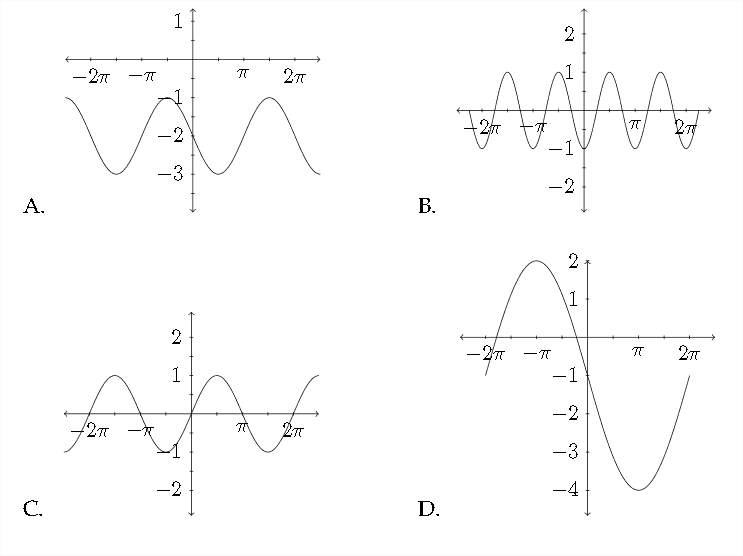
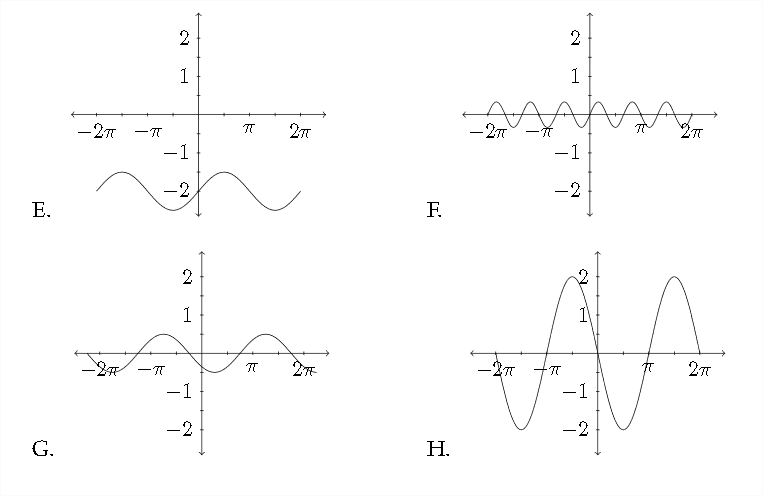
Match the function to the appropriate graph
23. \(\quad y=-\cos 2 x\)
24. \(\quad y=\frac{1}{2} \sin x-2\)
25. \(\quad y=2 \cos \left(x+\frac{\pi}{2}\right)\)
26. \(\quad y=-3 \sin \frac{1}{2} x-1\)
27. \(\quad y=\sin (x-\pi)-2\)
28. \(\quad y=-\frac{1}{2} \cos \left(x-\frac{\pi}{4}\right)\)
29. \(\quad y=\frac{1}{3} \sin 3 x\)
30. \(\quad y=\cos \left(x-\frac{\pi}{2}\right)\)
Determine the Amplitude, Period, Vertical Shift and Phase Shift for each function and graph at least one complete period. Be sure to identify the critical values along the \(x\) and \(y\) axes.
31. \(\quad y=2 \cos \left(2 x+\frac{\pi}{2}\right)-1\)
32. \(\quad y=-4 \cos (3 x-2 \pi)\)
33. \(\quad y=\sin \left(2 x-\frac{\pi}{4}\right)\)
\(34 . \quad y=-\sin (3 x+\pi)\)
35. \(\quad y=3 \cos \left(x+\frac{\pi}{3}\right)+1\)
36. \(\quad y=-2 \sin \left(3 x-\frac{\pi}{2}\right)+4\)
37. \(\quad y=-\frac{1}{2} \sin \left(x-\frac{\pi}{2}\right)-2\)
38. \(\quad y=2-\cos \left(2 x-\frac{\pi}{3}\right)\)