
1.1: An Introduction to the Whole Numbers
- Page ID
- 35389

\( \newcommand{\vecs}[1]{\overset { \scriptstyle \rightharpoonup} {\mathbf{#1}} } \)
\( \newcommand{\vecd}[1]{\overset{-\!-\!\rightharpoonup}{\vphantom{a}\smash {#1}}} \)
\( \newcommand{\dsum}{\displaystyle\sum\limits} \)
\( \newcommand{\dint}{\displaystyle\int\limits} \)
\( \newcommand{\dlim}{\displaystyle\lim\limits} \)
\( \newcommand{\id}{\mathrm{id}}\) \( \newcommand{\Span}{\mathrm{span}}\)
( \newcommand{\kernel}{\mathrm{null}\,}\) \( \newcommand{\range}{\mathrm{range}\,}\)
\( \newcommand{\RealPart}{\mathrm{Re}}\) \( \newcommand{\ImaginaryPart}{\mathrm{Im}}\)
\( \newcommand{\Argument}{\mathrm{Arg}}\) \( \newcommand{\norm}[1]{\| #1 \|}\)
\( \newcommand{\inner}[2]{\langle #1, #2 \rangle}\)
\( \newcommand{\Span}{\mathrm{span}}\)
\( \newcommand{\id}{\mathrm{id}}\)
\( \newcommand{\Span}{\mathrm{span}}\)
\( \newcommand{\kernel}{\mathrm{null}\,}\)
\( \newcommand{\range}{\mathrm{range}\,}\)
\( \newcommand{\RealPart}{\mathrm{Re}}\)
\( \newcommand{\ImaginaryPart}{\mathrm{Im}}\)
\( \newcommand{\Argument}{\mathrm{Arg}}\)
\( \newcommand{\norm}[1]{\| #1 \|}\)
\( \newcommand{\inner}[2]{\langle #1, #2 \rangle}\)
\( \newcommand{\Span}{\mathrm{span}}\) \( \newcommand{\AA}{\unicode[.8,0]{x212B}}\)
\( \newcommand{\vectorA}[1]{\vec{#1}} % arrow\)
\( \newcommand{\vectorAt}[1]{\vec{\text{#1}}} % arrow\)
\( \newcommand{\vectorB}[1]{\overset { \scriptstyle \rightharpoonup} {\mathbf{#1}} } \)
\( \newcommand{\vectorC}[1]{\textbf{#1}} \)
\( \newcommand{\vectorD}[1]{\overrightarrow{#1}} \)
\( \newcommand{\vectorDt}[1]{\overrightarrow{\text{#1}}} \)
\( \newcommand{\vectE}[1]{\overset{-\!-\!\rightharpoonup}{\vphantom{a}\smash{\mathbf {#1}}}} \)
\( \newcommand{\vecs}[1]{\overset { \scriptstyle \rightharpoonup} {\mathbf{#1}} } \)
\(\newcommand{\longvect}{\overrightarrow}\)
\( \newcommand{\vecd}[1]{\overset{-\!-\!\rightharpoonup}{\vphantom{a}\smash {#1}}} \)
\(\newcommand{\ket}[1]{\left| #1 \right>}\)
\(\newcommand{\bra}[1]{\left< #1 \right|}\)
\(\newcommand{\braket}[2]{\left< #1 \vphantom{#2} \right| \left. #2 \vphantom{#1} \right>}\)
\(\newcommand{\braopket}[3]{\left< #1 \vphantom{#2}\vphantom{#3} \right| #2 \vphantom{#1}\vphantom{#3} \left| #3 \vphantom{#1}\vphantom{#2} \right>}\)
\(\newcommand{\qmvec}[1]{\mathbf{\vec{#1}}}\)
\(\newcommand{\op}[1]{\hat{\mathbf{#1}}}\)
\(\newcommand{\expect}[1]{\langle #1 \rangle}\)
\(\newcommand{\dfn}[1]{\emph{\textbf{#1}}}\)
A set is a collection of objects. If the set is finite, we can describe the set completely by simply listing all the objects in the set and enclosing the list in curly braces. For example, the set
\( S=\{dog, \text { cat, parakeet }\}\)
is the set whose members are “dog”, “cat”, and “parakeet.” If the set is infinite, then we need to be more clever with our description. For example, the set of natural numbers (or counting numbers) is the set
\( \mathbb{N}=\{1,2,3,4,5, \ldots\}.\)
Because this set is infinite (there are an infinite number of natural numbers), we can’t list all of them. Instead, we list the first few then follow with “three dots,” which essentially mean “etcetera.” The implication is that the reader sees the intended pattern and can then intuit the remaining numbers in the set. Can you see that the next few numbers are 6, 7, 8, 9, etc.?
If we add the number zero to the set of natural numbers, then we have a set of numbers that are called the whole numbers.
The set
\( \mathbb{W}=\{0,1,2,3,4,5, \dots\}\)
is called the set of whole numbers.
The whole numbers will be our focus in the remainder of this chapter.
Graphing Numbers on the Number Line
It is a simple matter to set up a correspondence between the whole numbers and points on a number line. First, draw a number line, then set a tick mark at zero.

The next step is to declare a unit length.

The remainder of the whole numbers now fall easily in place on the number line.

When asked to graph a whole number on a number line, shade in a solid dot at the position on the number line that corresponds to the given whole number.
Graph the whole numbers 1, 3, and 5 on the number line.
Solution
Shade the numbers 1, 3, and 5 on the number line as solid dots.

Graph the whole numbers 3, 4, and 6 on the number line.
Ordering the whole numbers
Now that we have a correspondence between the whole numbers and points on the number line, we can order the whole numbers in a natural way. Note that as you move to the left along the number line, the numbers get smaller; as you move to the right, the numbers get bigger. This inspires the following definition.
Suppose that a and b are whole numbers located on the number line so that the point representing the whole number a lies to the left of the point representing the whole number b.

Then the whole number a is “less than” the whole number b and write
a < b.
Alternatively, we can also say that the whole number b is “greater than” the whole number a and write
b > a.
When comparing two whole numbers a and b, only one of three possibilities is true:
a < b or a = b or a > b.
Compare the whole numbers 25 and 31.
Solution
On the number line, 25 is located to the left of 31.

Therefore, 25 is less than 31 and write 25 < 31. Alternatively, we could also note that 31 is located to the right of 25. Therefore, 31 is greater than 25 and write 31 > 25.
Compare the whole numbers 18 and 12.
- Answer
-
18 > 12.
Expanded Notation
The whole numbers
\( D=\{0,1,2,3,4,5,6,7,8,9\}\)
are called digits and are used to construct larger whole numbers. For example, consider the whole number 222 (pronounced “two hundred twenty two”). It is made up of three twos, but the position of each two describes a different meaning or value.

- The first two is in the “hundreds” position and represents two hundreds or 200.
- The second two is in the “tens” position and represents two tens or 20.
- The third two is in the “ones” position and represents two ones or 2.
Consider the larger number 123,456,789. The following table shows the place value of each digit.
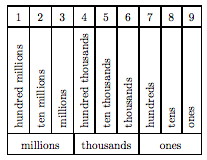
In “expanded notation,” we would write
1 hundred million + 2 ten millions + 3 millions + 4 hundred thousands + 5 ten thousands + 6 thousands + 7 hundreds + 8 tens + 9 ones.
We read the numeral 123,456,789 as “one hundred twenty three million, four hundred fifty six thousand, seven hundred eighty nine.”
Let’s look at another example.
Write the number 23,712 in expanded notation, then pronounce the result.
Solution
In expanded notation, 23,712 becomes
2 ten thousands + 3 thousands + 7 hundreds + 1 ten + 2 ones.
This is pronounced "twenty three thousand, seven hundred twelve."
Write the number 54,615 in expanded notation. Pronounce the result.
Write the number 203,405 in expanded notation, then pronounce the result.
Solution
In expanded notation, 203,405 becomes
2 hundred thousands + 0 ten thousands + 3 thousands + 4 hundreds + 0 tens + 5 ones.
Since 0 ten thousands is zero and 0 tens is also zero, this can also be written
2 hundred thousands + 3 thousands + 4 hundreds + 5 ones.
This is pronounced “two hundred three thousand, four hundred five.”
Write the number 430,705 in expanded notation. Pronounce the result.
- Answer
-
9,440
Rounding whole numbers
When less precision is needed, we round numbers to a particular place. For example, suppose a store owner needs approximately 87 boxes of ten-penny nails, but they can only be ordered in cartons containing ten boxes.

Note that 87 is located closer to 9 tens (or 90) than it is to 8 tens (or 80). Thus, rounded to the nearest ten, 87 ≈ 90 (87 approximately equals 90). The store owner decides that 90 boxes is probably a better fit for his needs. On the other hand, the same store owner estimates that he will need 230 bags of peatmoss for his garden section.

Note that 230 is closer to 2 hundreds (or 200) than it is to 3 hundreds (or 300). The store owner worries that might have overestimated his need, so he rounds down to the nearest hundred, 230 ≈ 200 (230 approximately equals 200). There is a simple set of rules to follow when rounding.
To round a number to a particular place, follow these steps:
1. Mark the place you wish to round to. This is called the rounding digit.
2. Check the next digit to the right of your digit marked in step 1. This is called the test digit.
a) If the test digit is greater than or equal to 5, add 1 to the rounding digit and replace all digits to the right of the rounding digit with zeros.
b) If the test digit is less than 5, keep the rounding digit the same and replace all digits to the right of rounding digit with zero
Let's try these rules with an example or two.
Round the number 8,769 to the nearest ten.
Solution
Mark the rounding and test digits.
Round the number 9,443 to the nearest ten.
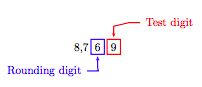
The test digit is greater than 5. The “Rules for Rounding” require that we add 1 to the rounding digit, then make all digits to the right of the rounding digit zeros. Thus, rounded to the nearest ten,
8, 769 ≈ 8, 770.
That is, 8,769 is approximately equal to 8,770.
The symbol
≈
means approximately equal.
Round the number 4,734 to the nearest hundred.
Solution
Mark the rounding and test digits.
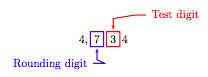
The test digit is less than 5. The “Rules for Rounding” require that we keep the rounding digit the same, then make all digits to the right of the rounding digit zeros. Thus, rounded to the nearest hundred,
4, 734 ≈ 4, 700.
| Year | 1965 | 1975 | 1985 | 1995 | 2005 |
| Atmospheric CO2 | 319 | 330 | 344 | 359 | 378 |
Tables and Graphs
Reading data in graphical form is an important skill. The data in Table 1.1 provides measures of the carbon dioxide content (CO2) in the atmosphere, gathered in the month of January at the observatory atop Mauna Loa in Hawaii.
In Figure 1.1(a), a bar graph is used to display the carbon dioxide measurements. The year the measurement was taken is placed on the horizontal axis, and the height of each bar equals the amount of carbon dioxide in the atmosphere during that year.
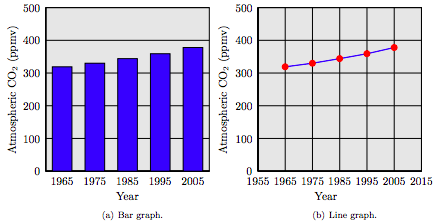
In Figure 1.1(b), a line graph is used to display the carbon dioxide measurements. Again, the dates of measurement are placed on the horizontal axis, and the amount of carbon dioxide in the atmosphere is placed on the vertical axis. Instead of using the height of a bar to represent the carbon dioxide measurement, we place a dot at a height that represents the carbon monoxide content. Once each data point is plotted, we connect consecutive data points with line segments.
Exercises
In Exercises 1-12, sketch the given whole numbers on a number line, then arrange them in order, from smallest to largest.
1. 2, 8, and 4
2. 2, 7, and 4
3. 1, 8, and 2
4. 0, 4, and 3
5. 0, 4, and 1
6. 3, 6, and 5
7. 4, 9, and 6
8. 2, 4, and 3
9. 0, 7, and 4
10. 2, 8, and 6
11. 1, 6, and 5
12. 0, 9, and 5
In Exercises 13-24, create a number line diagram to determine which of the two given statements is true.
13. 3 < 8 or 3 > 8
14. 44 < 80 or 44 > 80
15. 59 < 24 or 59 > 24
16. 15 < 11 or 15 > 11
17. 0 < 74 or 0 > 74
18. 11 < 18 or 11 > 18
19. 1 < 81 or 1 > 81
20. 65 < 83 or 65 > 83
21. 43 < 1 or 43 > 1
22. 62 < 2 or 62 > 2
23. 43 < 28 or 43 > 28
24. 73 < 21 or 73 > 21
25. Which digit is in the thousands column of the number 2,054,867,372?
26. Which digit is in the hundreds column of the number 2,318,999,087?
27. Which digit is in the hundred thousands column of the number 8,311,900,272?
28. Which digit is in the tens column of the number 1,143,676,212?
29. Which digit is in the hundred millions column of the number 9,482,616,000?
30. Which digit is in the hundreds column of the number 375,518,067?
31. Which digit is in the ten millions column of the number 5,840,596,473?
32. Which digit is in the hundred thousands column of the number 6,125,412,255?
33. Which digit is in the hundred millions column of the number 5,577,422,501?
34. Which digit is in the thousands column of the number 8,884,966,835?
35. Which digit is in the tens column of the number 2,461,717,362?
36. Which digit is in the ten millions column of the number 9,672,482,548?
37. Round the number 93, 857 to the nearest thousand.
38. Round the number 56, 872 to the nearest thousand.
39. Round the number 9, 725 to the nearest ten.
40. Round the number 6, 815 to the nearest ten.
41. Round the number 58, 739 to the nearest hundred.
42. Round the number 93, 146 to the nearest hundred.
43. Round the number 2, 358 to the nearest ten.
44. Round the number 8, 957 to the nearest ten.
45. Round the number 39, 756 to the nearest thousand.
46. Round the number 24, 965 to the nearest thousand.
47. Round the number 5, 894 to the nearest ten.
48. Round the number 3, 281 to the nearest ten.
49. Round the number 56, 123 to the nearest hundred.
50. Round the number 49, 635 to the nearest hundred.
51. Round the number 5, 483 to the nearest ten.
52. Round the number 9, 862 to the nearest ten.
53. According to the U.S. Census Bureau, the estimated population of the US is 304,059,724 as of July 2008. Round to the nearest hundred thousand.
54. According to the U.S. Census Bureau, the estimated population of California is 36,756,666 as of July 2008. Round to the nearest hundred thousand.
55. According to the U.S. Census Bureau, the estimated population of Humboldt County is 129,000 as of July 2008. Round to the nearest ten thousand.
56. According to the U.S. Census Bureau, the estimated population of the state of Alaska was 686,293 as of July 2008. Round to the nearest ten thousand.
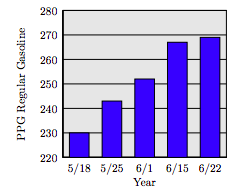
57. The following bar chart shows the average price (in cents) of one gallon of regular gasoline in the United States over five consecutive weeks in 2009, running from May 18 (5/18) through June 22 (6/22). What was the price (in cents) of one gallon of regular gasoline on June 1, 2009?
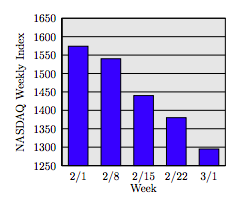
58. The following bar chart shows the average weekly NASDAQ index for five consecutive weeks in 2009, beginning with week starting February 1 (2/1) and ending with the week starting March 1 (3/1). What was the average NASDAQ index for the week starting February 8, 2009?
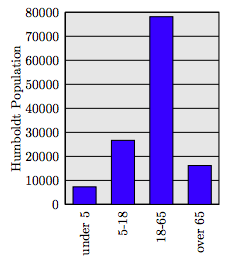
59. The population of Humboldt County is broken into age brackets in the following table. Source: WolframAlpha.
\( \begin{array}{c|c}{\text { Age in years }} & {\text { Number }} \\ \hline {\text { under } 5} & {7,322} \\ {5-18} & {26,672} \\ {18-65} & {78,142} \\ {\text { over } 65} & {16,194} \\ \hline\end{array}\)
Create a bar chart for this data set with one bar for each age category.
60. The five cities with the largest number of reported violent crimes in the year 2007 are reported in the following table. Source: Wikipedia.
\( \begin{array}{c|c}{\text { City }} & {\text { Violent Crimes }} \\ \hline \text { Setroit } & {2,289} \\ {\text { St. Louis }} & {2,196} \\ {\text { Memphis }} & {1,951} \\ {\text { Oakland }} & {1,918} \\ {\text { Baltimore }} & {1,631} \\ \hline\end{array}\)
Create a bar chart for this data set with one bar for each city.
61. The following bar chart tracks pirate attacks off the coast of Somalia.
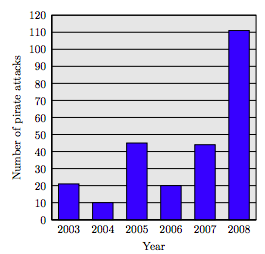
Source: ICC International Maritime Bureau, AP Times-Standard, 4/15/2009
a) How many pirate attacks were there in 2003?
b) How many pirate attacks were there in 2008?
62. A team of students separated a small bowl of M and M’s into five piles by color. The following line plot indicates the number of M and M’s of each color.
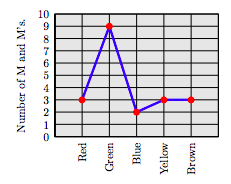
How many red M and M's were in the bowl?
63. A team of students separated a small bowl of M and M’s into five piles by color. The following line plot indicates the number of M and M’s of each color.
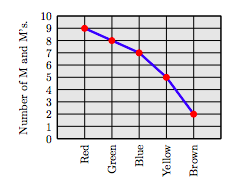
How many red M and M's were in the bowl?
64. A team of students separated a small bowl of M and M’s into five piles by color. The following table indicates the number of M and M’s of each color.
\( \begin{array}{c|c}{\text { Color }} & {\text { Number }} \\ \hline \text { Red } & {5} \\ {\text { Green }} & {9} \\ {\text { Blue }} & {7} \\ {\text { Yellow }} & {2} \\ {\text { Brown }} & {3} \\ \hline\end{array}\)
Create a lineplot for the M and M data. On the horizontal axis, arrange the colors in the same order as presented in the table above.
65. A team of students separated a small bowl of M and M’s into five piles by color. The following table indicates the number of M and M’s of every color.
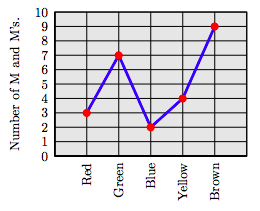
\( \begin{array}{c|c}{\text { Color }} & {\text { Number }} \\ \hline \text { Red } & {3} \\ {\text { Green }} & {7} \\ {\text { Blue }} & {2} \\ {\text { Yellow }} & {4} \\ {\text { Brown }} & {9} \\ \hline\end{array}\)
Create a lineplot for the M and M data. On the horizontal axis, arrange the colors in the same order as presented in the table above.
66. Salmon count. The table shows the number of adult coho salmon returning to the Shasta River over the past four years. Round the salmon count for each year to the nearest ten. Times-Standard Shasta River coho rescue underway.
\( \begin{array}{r|c}{\text { Year }} & {\text { Salmon count }} \\ \hline 2007 & {300} \\ {2008} & {31} \\ {2009} & {9} \\ {2010} & {4} \\ \hline\end{array}\)
Answers
1. Smallest to largest: 2, 4, and 8.

3. Smallest to largest: 1, 2, and 8.

5. Smallest to largest: 0, 1, and 4.

7. Smallest to largest: 4, 6, and 9.

9. Smallest to largest: 0, 4, and 7.

11. Smallest to largest: 1, 5, and 6.

13.

Therefore, 3 < 8.
15.

Therefore, 59 > 24.
17.

Therefore, 0 < 74.
19.

Therefore, 1 < 81.
21.

Therefore, 43 > 1.
23.

Therefore, 43 > 28.
25. 7
27. 9
29. 4
31. 4
33. 5
35. 6
37. 94000
39. 9730
41. 58700
43. 2360
45. 40000
47. 5890
49. 56100
51. 5480
53. 304,100,000
55. 130,000
57. Approximately 252 cents
59.
61.
a) Approximately 21
b) Approximately 111
63. 9
65.