

6.1: Volumes of Revolution - The Disk and Washer Methods
- Page ID
- 175577

\( \newcommand{\vecs}[1]{\overset { \scriptstyle \rightharpoonup} {\mathbf{#1}} } \)
\( \newcommand{\vecd}[1]{\overset{-\!-\!\rightharpoonup}{\vphantom{a}\smash {#1}}} \)
\( \newcommand{\dsum}{\displaystyle\sum\limits} \)
\( \newcommand{\dint}{\displaystyle\int\limits} \)
\( \newcommand{\dlim}{\displaystyle\lim\limits} \)
\( \newcommand{\id}{\mathrm{id}}\) \( \newcommand{\Span}{\mathrm{span}}\)
( \newcommand{\kernel}{\mathrm{null}\,}\) \( \newcommand{\range}{\mathrm{range}\,}\)
\( \newcommand{\RealPart}{\mathrm{Re}}\) \( \newcommand{\ImaginaryPart}{\mathrm{Im}}\)
\( \newcommand{\Argument}{\mathrm{Arg}}\) \( \newcommand{\norm}[1]{\| #1 \|}\)
\( \newcommand{\inner}[2]{\langle #1, #2 \rangle}\)
\( \newcommand{\Span}{\mathrm{span}}\)
\( \newcommand{\id}{\mathrm{id}}\)
\( \newcommand{\Span}{\mathrm{span}}\)
\( \newcommand{\kernel}{\mathrm{null}\,}\)
\( \newcommand{\range}{\mathrm{range}\,}\)
\( \newcommand{\RealPart}{\mathrm{Re}}\)
\( \newcommand{\ImaginaryPart}{\mathrm{Im}}\)
\( \newcommand{\Argument}{\mathrm{Arg}}\)
\( \newcommand{\norm}[1]{\| #1 \|}\)
\( \newcommand{\inner}[2]{\langle #1, #2 \rangle}\)
\( \newcommand{\Span}{\mathrm{span}}\) \( \newcommand{\AA}{\unicode[.8,0]{x212B}}\)
\( \newcommand{\vectorA}[1]{\vec{#1}} % arrow\)
\( \newcommand{\vectorAt}[1]{\vec{\text{#1}}} % arrow\)
\( \newcommand{\vectorB}[1]{\overset { \scriptstyle \rightharpoonup} {\mathbf{#1}} } \)
\( \newcommand{\vectorC}[1]{\textbf{#1}} \)
\( \newcommand{\vectorD}[1]{\overrightarrow{#1}} \)
\( \newcommand{\vectorDt}[1]{\overrightarrow{\text{#1}}} \)
\( \newcommand{\vectE}[1]{\overset{-\!-\!\rightharpoonup}{\vphantom{a}\smash{\mathbf {#1}}}} \)
\( \newcommand{\vecs}[1]{\overset { \scriptstyle \rightharpoonup} {\mathbf{#1}} } \)
\(\newcommand{\longvect}{\overrightarrow}\)
\( \newcommand{\vecd}[1]{\overset{-\!-\!\rightharpoonup}{\vphantom{a}\smash {#1}}} \)
\(\newcommand{\avec}{\mathbf a}\) \(\newcommand{\bvec}{\mathbf b}\) \(\newcommand{\cvec}{\mathbf c}\) \(\newcommand{\dvec}{\mathbf d}\) \(\newcommand{\dtil}{\widetilde{\mathbf d}}\) \(\newcommand{\evec}{\mathbf e}\) \(\newcommand{\fvec}{\mathbf f}\) \(\newcommand{\nvec}{\mathbf n}\) \(\newcommand{\pvec}{\mathbf p}\) \(\newcommand{\qvec}{\mathbf q}\) \(\newcommand{\svec}{\mathbf s}\) \(\newcommand{\tvec}{\mathbf t}\) \(\newcommand{\uvec}{\mathbf u}\) \(\newcommand{\vvec}{\mathbf v}\) \(\newcommand{\wvec}{\mathbf w}\) \(\newcommand{\xvec}{\mathbf x}\) \(\newcommand{\yvec}{\mathbf y}\) \(\newcommand{\zvec}{\mathbf z}\) \(\newcommand{\rvec}{\mathbf r}\) \(\newcommand{\mvec}{\mathbf m}\) \(\newcommand{\zerovec}{\mathbf 0}\) \(\newcommand{\onevec}{\mathbf 1}\) \(\newcommand{\real}{\mathbb R}\) \(\newcommand{\twovec}[2]{\left[\begin{array}{r}#1 \\ #2 \end{array}\right]}\) \(\newcommand{\ctwovec}[2]{\left[\begin{array}{c}#1 \\ #2 \end{array}\right]}\) \(\newcommand{\threevec}[3]{\left[\begin{array}{r}#1 \\ #2 \\ #3 \end{array}\right]}\) \(\newcommand{\cthreevec}[3]{\left[\begin{array}{c}#1 \\ #2 \\ #3 \end{array}\right]}\) \(\newcommand{\fourvec}[4]{\left[\begin{array}{r}#1 \\ #2 \\ #3 \\ #4 \end{array}\right]}\) \(\newcommand{\cfourvec}[4]{\left[\begin{array}{c}#1 \\ #2 \\ #3 \\ #4 \end{array}\right]}\) \(\newcommand{\fivevec}[5]{\left[\begin{array}{r}#1 \\ #2 \\ #3 \\ #4 \\ #5 \\ \end{array}\right]}\) \(\newcommand{\cfivevec}[5]{\left[\begin{array}{c}#1 \\ #2 \\ #3 \\ #4 \\ #5 \\ \end{array}\right]}\) \(\newcommand{\mattwo}[4]{\left[\begin{array}{rr}#1 \amp #2 \\ #3 \amp #4 \\ \end{array}\right]}\) \(\newcommand{\laspan}[1]{\text{Span}\{#1\}}\) \(\newcommand{\bcal}{\cal B}\) \(\newcommand{\ccal}{\cal C}\) \(\newcommand{\scal}{\cal S}\) \(\newcommand{\wcal}{\cal W}\) \(\newcommand{\ecal}{\cal E}\) \(\newcommand{\coords}[2]{\left\{#1\right\}_{#2}}\) \(\newcommand{\gray}[1]{\color{gray}{#1}}\) \(\newcommand{\lgray}[1]{\color{lightgray}{#1}}\) \(\newcommand{\rank}{\operatorname{rank}}\) \(\newcommand{\row}{\text{Row}}\) \(\newcommand{\col}{\text{Col}}\) \(\renewcommand{\row}{\text{Row}}\) \(\newcommand{\nul}{\text{Nul}}\) \(\newcommand{\var}{\text{Var}}\) \(\newcommand{\corr}{\text{corr}}\) \(\newcommand{\len}[1]{\left|#1\right|}\) \(\newcommand{\bbar}{\overline{\bvec}}\) \(\newcommand{\bhat}{\widehat{\bvec}}\) \(\newcommand{\bperp}{\bvec^\perp}\) \(\newcommand{\xhat}{\widehat{\xvec}}\) \(\newcommand{\vhat}{\widehat{\vvec}}\) \(\newcommand{\uhat}{\widehat{\uvec}}\) \(\newcommand{\what}{\widehat{\wvec}}\) \(\newcommand{\Sighat}{\widehat{\Sigma}}\) \(\newcommand{\lt}{<}\) \(\newcommand{\gt}{>}\) \(\newcommand{\amp}{&}\) \(\definecolor{fillinmathshade}{gray}{0.9}\)
The following is a list of learning objectives for this section.
|
.png?revision=1) To access the Hawk A.I. Tutor, you will need to be logged into your campus Gmail account. |
Now that we have the basic idea of how to compute the volume of a solid using slices, we venture into rotational solids.
Solids of Revolution
If a region in a plane is revolved around a line in that plane, the resulting solid is called a solid of revolution, as shown in the following figure.

Figure \(\PageIndex{1a}\): This is the region that is revolved around the \(x\)-axis.
Figure \( \PageIndex{ 1b } \): As the region begins to revolve around the axis, it sweeps out a solid of revolution.
Figure \( \PageIndex{ 1c } \): This is the solid that results when the revolution is complete.
Solids of revolution are common in mechanical applications, such as machine parts produced by a lathe. We spend the rest of this section looking at solids of this type. The following example uses the slicing method to calculate the volume of a solid of revolution.
Use the slicing method to find the volume of the solid of revolution bounded by the graphs of \(f(x)=x^2−4x+5\), \(x=1\), and \(x=4,\) and rotated about the \(x\)-axis.
- Solution
-
Using the problem-solving strategy, we first sketch the graph of the quadratic function over the interval \([1,4]\) as shown in the following figure.
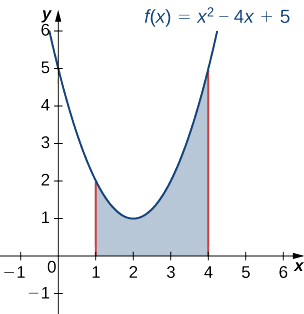
Figure \(\PageIndex{2}\): A region used to produce a solid of revolution.Next, revolve the region around the \(x\)-axis, as shown in the following figure.
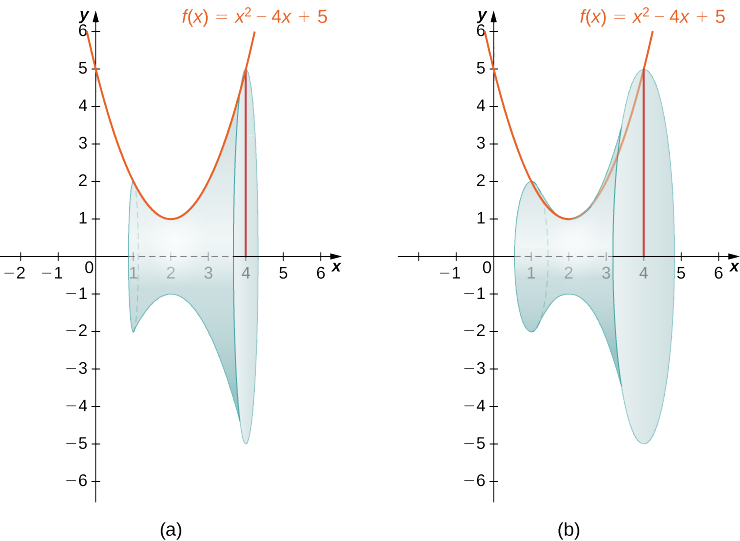
Figure \(\PageIndex{3}\): Two views, (a) and (b), of the solid of revolution produced by revolving the region in Figure \(\PageIndex{2}\) about the \(x\)-axis.The cross-sections are circles since the solid was formed by revolving the region around the \(x\)-axis. The area of the cross-section, then, is the area of a circle, and the radius of the circle is given by \(f(x)\). Use the formula for the area of the circle:\[A(x)= \pi r^2= \pi [f(x)]^2= \pi (x^2−4x+5)^2. \nonumber \]The volume, then, is\[\begin{array}{rcl}
V & = & \displaystyle \int _a^b A(x)\,dx \\
\\
& = & \displaystyle \int ^4_1 \pi (x^2−4x+5)^2\,dx \\
\\
& = & \pi \displaystyle \int ^4_1(x^4−8x^3+26x^2−40x+25)\,dx \\
\\
& = & \pi \left(\dfrac{x^5}{5}−2x^4+\dfrac{26x^3}{3}−20x^2+25x\right)\bigg|^4_1 \\
\\
& = & \dfrac{78}{5} \pi \\
\end{array} \nonumber \]The volume is \(\frac{78 \pi}{5} \text{ units}^3\).
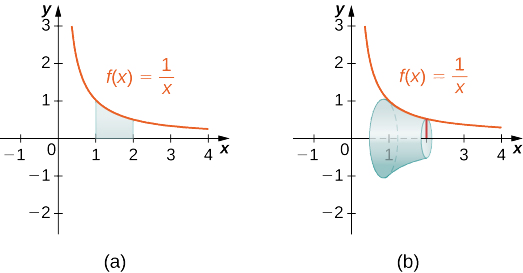
Use the method of slicing to find the volume of the solid of revolution formed by revolving the region between the graph of the function \(f(x)=\frac{1}{x}\) and the \(x\)-axis over the interval \([1,2]\) around the \(x\)-axis. See the following figure.
- Answer
-
\(\frac{ \pi }{2}\text{ units}^3\)
The Disk Method
When we use the slicing method with solids of revolution, it is often called the Disk Method because, for solids of revolution, the slices used to approximate the volume of the solid are disks. To see this, consider the solid of revolution generated by revolving the region between the graph of the function \(f(x)=(x−1)^2+1\) and the \(x\)-axis over the interval \([−1,3]\) around the \(x\)-axis (called the axis of rotation). The graph of the function and a representative disk are shown in Figure \(\PageIndex{11}\) (a) and (b). The region of revolution and the resulting solid are shown in Figure \(\PageIndex{4}\) (c) and (d).

Figure \(\PageIndex{4a}\): A thin rectangle for approximating the area under a curve. The height of this rectangle is the radius of rotation and it is denoted \( r_i \).
Figure \( \PageIndex{ 4b } \): A representative disk formed by revolving the rectangle about the \(x\)-axis.
Figure \( \PageIndex{ 4c } \): The region under the curve is revolved around the \(x\)-axis, resulting in Figure \( \PageIndex{ 4d } \) the solid of revolution.
Figure \(\PageIndex{4e}\): A dynamic version of this solid of revolution generated using CalcPlot3D.
We already used the formal Riemann sum development of the volume formula when we developed the slicing method. We know that \[ V = \lim_{n \to \infty} \sum_{i = 1}^{n} A(x_i^*) \Delta x = \int _a^b A(x)\,dx.\nonumber \]The only difference with the Disk Method is that we know the formula for the cross-sectional area ahead of time; it is the area of a circle. That is,\[ V = \lim_{n \to \infty} \sum_{i = 1}^{n} \pi \left[ r(x_i^*) \right]^2 \Delta x = \int _a^b \pi \left[ r(x) \right]^2 \,dx, \nonumber \]where \( r(x) \) is the radius of rotation (and \( r(x_i^*) \) is the radius of rotation for the \( i^{\text{th}} \) slice).1 For the Disk and Washer (see below) Methods, the radius of rotation is the distance between the axis of rotation and the function. If the axis of rotation is the \( x \)-axis, then our discussion of measuring distances in Section 1.1 reveals that\[ r(x) = \begin{cases}
f(x) - 0 = f(x) & \text{if} & f(x) \geq 0 \\
0 - f(x) = -f(x) & \text{if} & f(x) \lt 0 \\
\end{cases} \nonumber \]In either case, and only if the axis of rotation is the \( x \)-axis, we get\[ \left[ r(x) \right]^2 = \left[ f(x) \right]^2 \nonumber \]This leads to the following theorem.
Let \(f(x)\) be continuous. Define \(\textbf{R}\) as the region bounded by the graph of \(f(x)\), the \(x\)-axis, on the left by the line \(x=a\), and on the right by the line \(x=b\). Then, the volume of the solid of revolution formed by revolving \(R\) around the \(x\)-axis is given by\[V= \int ^b_a \pi [f(x)]^2\,dx. \label{TempVolFormula} \]
While Equation \( \ref{TempVolFormula} \) is simple to memorize, doing so will result in a massive lack of understanding of how rotational volumes are computed and inevitably will lead to mistakes. It is best to truly understand the underpinnings of the development of Equation \( \ref{TempVolFormula} \) so that you can compute the volume of a rotational solid in more general situations. For example, Equation \( \ref{TempVolFormula} \) does not work if you are rotating a region about the \( y \)-axis, the line \( y = -2 \), or the region bounded between two curves about the line \( x = 7 \).
In general, when needing to compute the volume of a rotational solid, you should fall back to the development of the corresponding Riemann sum\[ V = \lim_{n \to \infty} \sum_{i = 1}^{n} K(x_i^*) \Delta x, \label{GenVolFormula} \]where \( K(x_i^*) \Delta x \) is the volume of the \( i^{\text{th}} \) slice found using logic from our previous Geometry course.2 To compute this volume, we will always start by focusing on the volume of the \( i^{\text{th}} \) slice,\[ V_i = K(x_i^*) \Delta x. \nonumber \]
Compute the volume of the rotational solid from Figure \( \PageIndex{4d} \).
- Solution
- Just as we said we should, we start by considering the volume of the \( i^{\text{th}} \) slice,\[ V_i = K(x_i^*) \Delta x. \nonumber \]Since a representative slice of this solid of revolution is a disk (a circle with a thickness), we know the volume of the \( i^{\text{th}} \) slice is\[ V_i = \pi \left[ r(x_i^*) \right]^2 \Delta x. \nonumber \]Moreover, since \( r(x_i^*) \) is the radius of revolution, and the axis of revolution is the \( x \)-axis, we know \( r(x_i^*) = f(x_i^*) \) (remember, \( f(x) \geq 0 \) on the given interval). Therefore,\[ V_i = \pi \left[ f(x_i^*) \right]^2 \Delta x. \nonumber \]Hence,\[\begin{array}{rcl}
V & = & \int ^b_a \pi \left[f(x)\right]^2\,dx \\
\\
& = & \int ^3_{−1} \pi \big[(x−1)^2+1\big]^2\,dx \\
\\
& = & \pi \int ^3_{−1}\big[(x−1)^4+2(x−1)^2+1\big]^2\,dx \\
\\
& = & \pi \left.\Big[\dfrac{1}{5}(x−1)^5+\dfrac{2}{3}(x−1)^3+x\Big]\right|^3_{−1} \\
\\
& = & \pi \left[\left(\dfrac{32}{5}+\dfrac{16}{3}+3\right)−\left(−\dfrac{32}{5}−\dfrac{16}{3}−1\right)\right] \\
\\
& = & \frac{412 \pi }{15}\text{ units}^3. \\
\end{array} \nonumber \]Again, it cannot be overstated that starting our computation of the volume for a solid of revolution by considering the volume of the \( i^{\text{th}} \) slice is incredibly helpful.3
Let’s look at some other examples.
Use the Disk Method to find the volume of the solid of revolution generated by rotating the region bounded by the graph of \(f(x)=\sqrt{x}\) and the \(x\)-axis over the interval \([1,4]\) around the \(x\)-axis.
- Solution
-
The graphs of the function and the solid of revolution are shown in the following figure.
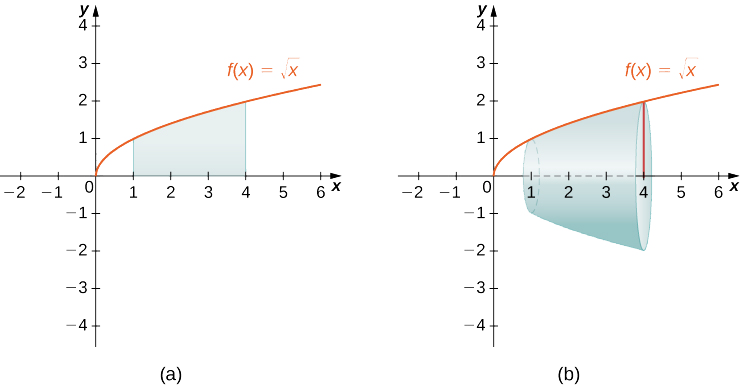
Figure \(\PageIndex{5a}\): The function \(f(x)=\sqrt{x}\) over the interval \([1,4]\).
Figure \( \PageIndex{ 5b } \): The solid of revolution obtained by revolving the region under the graph of \(f(x)\) about the \(x\)-axis.We have the volume of the \( i^{\text{th}} \) slice as\[ V_i = K(x_i^*) \Delta x; \nonumber \]however, we can see that a drawing of this representative slice would be a disk. Using the fact that the axis of rotation is the \( x \)-axis and \( f(x) \geq 0 \), we get\[ V_i = \pi \left[ r(x_i^*) \right]^2 \Delta x = \pi \left[f(x_i^*) \right]^2 \Delta x = \pi \left[ \sqrt{x_i^*} \right]^2 \Delta x = \pi x_i^* \Delta x. \nonumber \]Hence,\[ \begin{array}{rcl}
V & = & \displaystyle \int ^b_a \pi \left[f(x)\right]^2\,dx \\
\\
& = & \displaystyle \int^4_1 \pi x \,dx \\
\\
& = & \pi \displaystyle \int ^4_1x\,dx \\
\\
& = & \dfrac{ \pi }{2}x^2\bigg|^4_1 \\
\\
& = & \dfrac{15 \pi }{2} \\
\end{array} \nonumber \]The volume is \(\frac{15 \pi}{2} \text{ units}^3.\)
Use the Disk Method to find the volume of the solid of revolution generated by rotating the region between the graph of \(f(x)=\sqrt{4−x}\) and the \(x\)-axis over the interval \([0,4]\) around the \(x\)-axis.
- Answer
-
\(8 \pi \text{ units}^3\)
So far, our examples have all concerned regions revolved around the \(x\)-axis, but we can generate a solid of revolution by revolving a plane region around any horizontal or vertical line. In the following example, we look at a solid of revolution that has been generated by rotating a region around the \(y\)-axis. The mechanics of the Disk Method are nearly the same as when the \(x\)-axis is the axis of revolution, but we express the function in terms of \(y\) and we integrate with respect to \(y\) as well. This is summarized in the following theorem.
Let \(g(y)\) be continuous. Define \(\textbf{Q}\) as the region bounded by the graph of \(g(y)\), the \(y\)-axis, below by the line \(y=c\), and above by the line \(y=d\). Then, the volume of the solid of revolution formed by revolving \(\textbf{Q}\) around the \(y\)-axis is given by\[V= \int ^d_c \pi [g(y)]^2\,dy. \label{TempVolFormula2} \]
Again, memorizing Equation \( \ref{TempVolFormula2} \) is a terrible idea. An example showcases that this formula is a result of our theoretical derivation of the volume of the \( i^{\text{th}} \) slice.
Let \(\mathbf{R}\) be the region bounded by the graph of \(g(y)=\sqrt{4−y}\) and the \(y\)-axis over the \(y\)-axis interval \([0,4]\). Use the Disk Method to find the volume of the solid of revolution generated by rotating \(\mathbf{R}\) about the \(y\)-axis.
- Solution
-
Figure \(\PageIndex{13}\) shows the function and a representative disk that can be used to estimate the volume. Notice that since we are revolving the function around the \(y\)-axis, the disks are horizontal, rather than vertical.
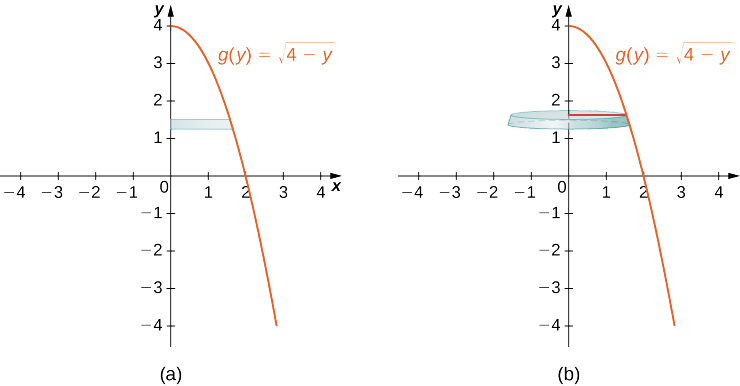
Figure \(\PageIndex{6a}\): Shown is a thin rectangle between the curve of the function \(g(y)=\sqrt{4−y}\) and the \(y\)-axis.
Figure \( \PageIndex{ 6b } \): The rectangle forms a representative disk after revolving around the \(y\)-axis.The region to be revolved and the full solid of revolution are depicted in the following figure.
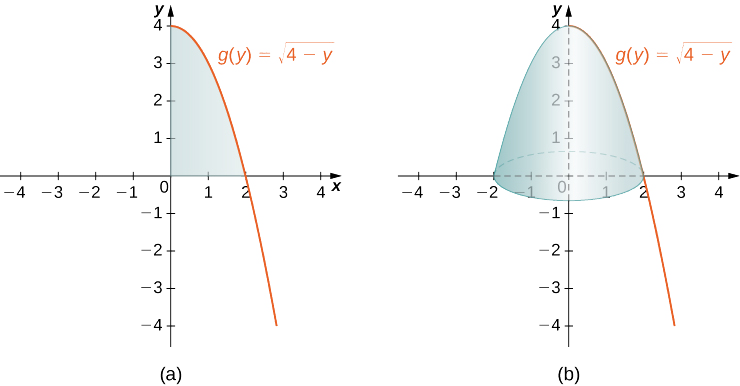
Figure \(\PageIndex{7a}\): The region to the left of the function \(g(y)=\sqrt{4−y}\) over the \(y\)-axis interval \([0,4]\).
Figure \( \PageIndex{ 7b } \): The solid of revolution formed by revolving the region about the \(y\)-axis.We can see from Figure \( \PageIndex{7b} \) that the \( i^{\text{th}} \) slice is a disk. Hence, its volume is\[ V_i = \pi \left[ r(y_i^*) \right]^2 \Delta y, \nonumber \]where the thickness, \( \Delta y \), is a small "wiggle" in \( y \). The axis of rotation is the \( y \)-axis and the radius of rotation is \( r(y_i^*) = x_R - x_L = g(y_i^*) - 0 = g(y_i^*) \).4 Hence,\[ V_i = \pi \left[ g(y_i^*) \right]^2 \Delta y = \pi \left[ \sqrt{4 - y_i^*} \right]^2 \Delta y = \pi \left( 4 - y_i^* \right) \Delta y. \nonumber \]Therefore, we obtain\[V = \int^d_c \pi \left[g(y)\right]^2\,dy = \pi \int ^4_0(4−y)\,dy = \pi \left.\left[4y−\dfrac{y^2}{2}\right]\right|^4_0=8 \pi . \nonumber \]The volume is \(8 \pi \text{ units}^3\).
Use the Disk Method to find the volume of the solid of revolution generated by rotating the region between the graph of \(g(y)=y\) and the \(y\)-axis over the interval \([1,4]\) around the \(y\)-axis.
- Answer
-
\(21 \pi \text{ units}^3\)
We now showcase how to compute the volume of a solid of revolution if the axis of rotation is off an axis.5
Find the volume of the solid of revolution generated by rotating the region bounded by \( f(x) = \sin\left( \frac{x}{4} \right) \), \( y = -1 \), \( x = 0 \), and \( x = 2\pi \) about the line \( y = -1 \).
- Solution
-
As always, we begin by sketching the curve, the axis of rotation, and a representative slice.

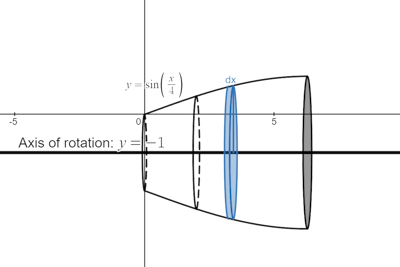
Figure \( \PageIndex{8} \): A sketch of \( f(x) = \sin\left( \frac{x}{4} \right) \), the axis of rotation (\( y=-1 \)), and a representative slice.
The volume of the \( i^{\text{th}} \) slice is\[ V_i = K(x_i^*) \Delta x, \nonumber \]and we can see that this slice is a disk. Hence,\[ V_i = \pi \left[ r(x_i^*) \right]^2 \Delta x. \nonumber \]The difference between this problem and the previous problems is that the radius of rotation involves a little more thought. The distance from the function to the axis of rotation is \( y_T - y_B = \sin\left( \frac{x_i^*}{4} \right) - (-1) = \sin\left( \frac{x_i^*}{4} \right) + 1 \). Hence, the radius of rotation is \( r(x_i^*) = \sin\left( \frac{x_i^*}{4} \right) + 1 \). Thus, the volume of the \( i^{\text{th}} \) slice is\[ V_i = \pi \left[ \sin\left( \frac{x_i^*}{4} \right) + 1 \right]^2 \Delta x = \pi \left[ \sin^2\left( \frac{x_i^*}{4} \right) + 2\sin\left( \frac{x_i^*}{4} \right) + 1 \right] \Delta x. \nonumber \]We are now ready to find this volume.\[ \begin{array}{rclr}
V & = & \displaystyle \int_a^b \pi \left[ r(x) \right]^2 dx & \\
\\
& = & \displaystyle \int_0^{2 \pi} \pi \left[ \sin^2\left( \frac{x}{4} \right) + 2\sin\left( \frac{x}{4} \right) + 1 \right] dx & \\
\\
& = & \pi \displaystyle \int_0^{2 \pi} \dfrac{1 - \cos\left( \frac{x}{2} \right)}{2} + 2\sin\left( \frac{x}{4} \right) + 1 dx & \left( \text{Power reduction formula} \right) \\
\\
& = & \dfrac{\pi}{2} \displaystyle \int_0^{2 \pi} 1 - \cos\left( \frac{x}{2} \right) dx + 2 \pi \int_0^{2\pi} \sin\left( \frac{x}{4} \right) dx + \pi \int_0^{2\pi} dx & \\
\\
& = & \dfrac{\pi}{2} \displaystyle \int_0^{2 \pi} dx - \dfrac{\pi}{2} \int_0^{2\pi} \cos\left( \frac{x}{2} \right) dx + 2 \pi \int_0^{2\pi} \sin\left( \frac{x}{4} \right) dx + \pi \int_0^{2\pi} dx & \\
\\
& = & \pi^2 - \dfrac{\pi}{2} \displaystyle \int_0^{2\pi} \cos\left( \frac{x}{2} \right) dx + 2 \pi \int_0^{2\pi} \sin\left( \frac{x}{4} \right) dx + 2 \pi^2 & \\
\\
& = & 3 \pi^2 - \dfrac{\pi}{2} \displaystyle \int_0^{2\pi} \cos\left( \frac{x}{2} \right) dx + 2 \pi \int_0^{2\pi} \sin\left( \frac{x}{4} \right) dx & \\
\\
& = & 3 \pi^2 - \pi \displaystyle \int_{u=0}^{u=\pi} \cos\left( u \right) du + 2 \pi \int_0^{2\pi} \sin\left( \frac{x}{4} \right) dx & \left( \text{Let }u = \frac{x}{2} \implies du = \frac{1}{2} dx \right) \\
\\
& = & 3 \pi^2 - \pi \bigg( \sin(u) \bigg)_{u = 0}^{u = \pi} + 2 \pi \displaystyle \int_0^{2\pi} \sin\left( \frac{x}{4} \right) dx & \\
\\
& = & 3 \pi^2 - \pi \left( \sin(\pi) - \sin(0) \right) + 2 \pi \displaystyle \int_0^{2\pi} \sin\left( \frac{x}{4} \right) dx & \\
\\
& = & 3 \pi^2 + 2 \pi \displaystyle \int_0^{2\pi} \sin\left( \frac{x}{4} \right) dx & \\
\\
& = & 3 \pi^2 + 8 \pi \displaystyle \int_{u = 0}^{u = \pi/2} \sin\left( u \right) du & \left( \text{Let }u = \frac{x}{4} \implies du = \frac{1}{4} dx \right) \\
\\
& = & 3 \pi^2 - 8 \pi \bigg( \cos(u) \bigg)_{u=0}^{u = \pi/2} & \\
\\
& = & 3 \pi^2 - 8 \pi \left( \cos\left( \frac{\pi}{2} \right) - \cos(0) \right) & \\
\\
& = & 3 \pi^2 - 8 \pi \left( 0 - 1 \right) & \\
\\
& = & 3 \pi^2 + 8 \pi & \\
\end{array} \nonumber \]Thus, the volume is \( 3 \pi^2 + 8 \pi \text{ units}^3 \).6
The Washer Method
Some solids of revolution have cavities in the middle; they are not solid near to the axis of revolution. Sometimes, this is just a result of how the region of revolution is shaped with respect to the axis of revolution. In other cases, cavities arise when the region of revolution is defined as the region between the graphs of two functions. A third way this can happen is when an axis of revolution other than the \(x\)-axis or \(y\)-axis is selected.
When the solid of revolution has a cavity in the middle, the slices used to approximate the volume are not disks, but washers (disks with holes in the center). For example, consider the region bounded above by the graph of the function \(f(x)=\sqrt{x}\) and below by the graph of the function \(g(x)=1\) over the interval \([1,4]\). When this region is revolved around the \(x\)-axis, the result is a solid with a cavity in the middle, and the slices are washers. The graph of the function and a representative washer are shown in Figure \(\PageIndex{9}\) (a) and (b). The region of revolution and the resulting solid are shown in Figure \(\PageIndex{9}\) (c) and (d).
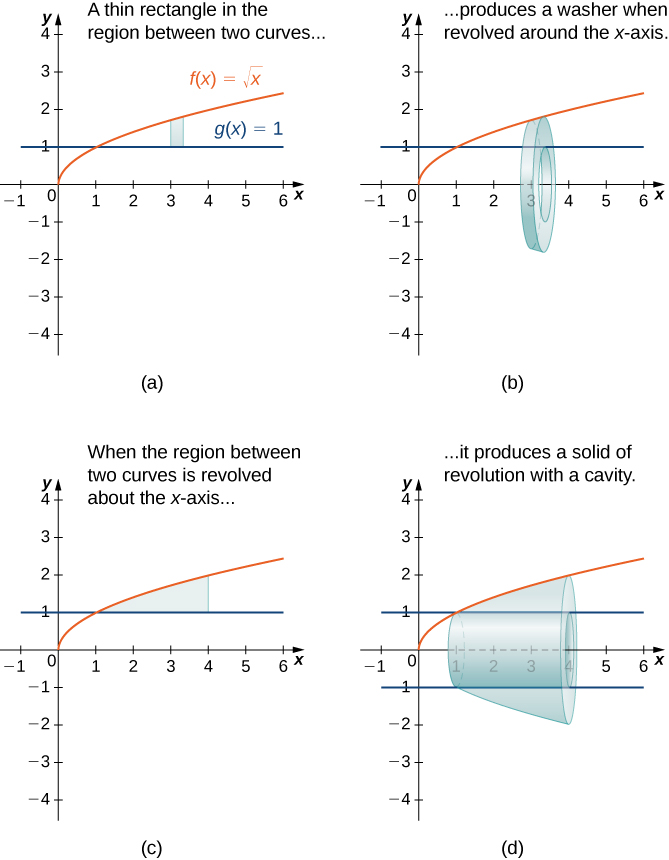
Figure \(\PageIndex{9a}\): A thin rectangle in the region between two curves.
Figure \( \PageIndex{ 9b } \): A representative disk formed by revolving the rectangle about the \(x\)-axis.
Figure \( \PageIndex{ 9c } \): The region between the curves over the given interval.
Figure \( \PageIndex{ 9d } \): The resulting solid of revolution.
Figure \(\PageIndex{9e}\): A dynamic version of this solid of revolution generated using CalcPlot3D.
The volume of the \( i^{\text{th}} \) slice is still represented by\[ V_i = K(x_i^*) \Delta x; \nonumber \]however, we can see that this slice is a disk with a central disk removed. That is,\[ V_i = \pi \left[ r_O(x_i^*) \right]^2 \Delta x - \pi \left[ r_I(x_i^*) \right]^2 \Delta x, \nonumber \]where \( r_O \) is the radius of rotation to the outer function and \( r_I \) is the radius of rotation to the inner function. In both cases, the axis of rotation is the \( x \)-axis, so its easily found that \( r_O(x_i^*) = f(x_i^*) = \sqrt{x_i^*} \) and \( r_I(x_i^*) = g(x_i^*) = 1 \). Hence,\[ V_i = \pi \left[ \sqrt{x_i^*} \right]^2 \Delta x - \pi \left[ 1 \right]^2 \Delta x = \pi x_i^* \Delta x - \pi \Delta x. \nonumber \]From this formula, we have the option to use two integrals or one to find the volume of the solid of revolution. That is, we could use\[ V = \int_1^4 \pi x \, dx - \int_1^4 \pi \, dx \qquad \text{or} \qquad V = \int_1^4 \pi(x - 1) \, dx. \nonumber \]Both are acceptable, but while the second form looks simpler, it can lead to mistakes (see the Caution below). Computing the volume, we get\[V = \pi \int^4_1 x \,dx - \pi \int_1^4 \, dx = \pi \bigg(\dfrac{x^2}{2}\bigg)_1^4 - \pi(4 - 1) = \dfrac{9}{2} \pi \text{ units}^3. \nonumber \]Generalizing this process gives the Washer Method. Again, you should "strive to derive" this formula rather than memorize it (this formula can cause issues if you just try to memorize it).
Suppose \(f(x)\) and \(g(x)\) are continuous, nonnegative functions such that \(f(x) \geq g(x)\) over \([a,b]\). Let \(\mathbf{R}\) denote the region bounded above by the graph of \(f(x)\), below by the graph of \(g(x)\), on the left by the line \(x=a\), and on the right by the line \(x=b\). Then, the volume of the solid of revolution formed by revolving \(\mathbf{R}\) around the \(x\)-axis is given by\[V= \int ^b_a \pi \left[(f(x))^2−(g(x))^2\right]\,dx. \nonumber \]
A prevalent mistake is to think that the volume in the previous theorem is\[\int ^b_a \pi \left[f(x)−g(x)\right]^2\,dx. \nonumber \]This is why I strongly encourage my students to not memorize that formula, but instead to derive it until it makes sense. I will demonstrate this process with each remaining problem.
Find the volume of a solid of revolution formed by revolving the region bounded above by the graph of \(f(x)=x\) and below by the graph of \(g(x)=1/x\) over the interval \([1,4]\) around the \(x\)-axis.
- Solution
-
We start by graphing the functions, the axis of rotation, the solid, and a representative slice (Figure \( \PageIndex{10c} \)).
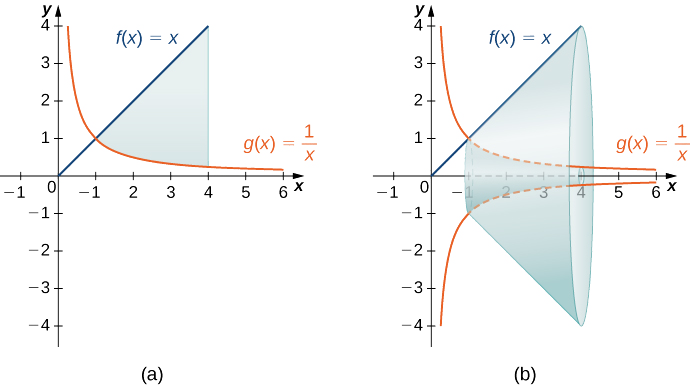
Figure \(\PageIndex{10a}\): The region between the graphs of the functions \(f(x)=x\) and \(g(x)=1/x\) over the interval \([1,4]\).
Figure \( \PageIndex{ 10b } \): Revolving the region about the \(x\)-axis generates a solid of revolution with a cavity in the middle.The slice is a disk with an inner disk removed. Therefore, the volume of this slice is\[ V_i = \pi \left[ r_O(x_i^*) \right]^2 \Delta x - \pi \left[ r_I(x_i^*) \right]^2 \Delta x, \nonumber \]where the outer radius is the distance between the axis of rotation (the \( x \)-axis) and \( f(x) = x \), and the inner radius is the distance between the axis of rotation and \( g(x) = \frac{1}{x} \). Thus,\[ V_i = \pi \left[ f(x_i^*) \right]^2 \Delta x - \pi \left[ g(x_i^*) \right]^2 \Delta x = \pi \left[ x_i^* \right]^2 \Delta x - \pi \left[ \frac{1}{x_i^*} \right]^2 \Delta x = \pi \left( x_i^* \right)^2 \Delta x - \frac{\pi}{(x_i^*)^2} \Delta x = \pi \left[ \left( x_i^* \right)^2 - \frac{1}{(x_i^*)^2} \right] \Delta x. \nonumber \]Finally, we get\[\begin{array}{rcl}
V & = & \pi \displaystyle \int ^4_1\left[x^2−\left(\dfrac{1}{x}\right)^2\right]\,dx \\
\\
& = & \pi \left.\left[\dfrac{x^3}{3}+\dfrac{1}{x}\right]\right|^4_1 \\
\\
& = & \dfrac{81 \pi }{4}\text{ units}^3. \\
\end{array} \nonumber \]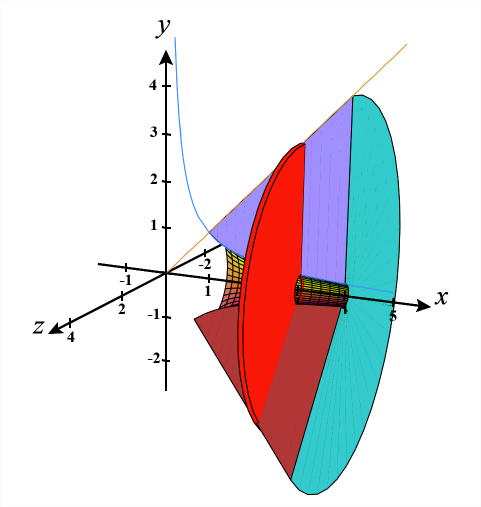
Figure \(\PageIndex{10c}\): A dynamic version of this solid of revolution generated using CalcPlot3D.
Find the volume of a solid of revolution formed by revolving the region bounded by the graphs of \(f(x)=\sqrt{x}\) and \(g(x)=1/x\) over the interval \([1,3]\) around the \(x\)-axis.
- Answer
-
\(\frac{10 \pi }{3} \,\text{units}^3\)
As with the Disk Method, we can also apply the Washer Method to solids of revolution that result from revolving a region around the \(y\)-axis. In this case, the following rule applies (again, you need to understand how this is derived).
Suppose \(u(y)\) and \(v(y)\) are continuous, nonnegative functions such that \(v(y) \leq u(y)\) for \(y \in [c,d]\). Let \(\mathbf{Q}\) denote the region bounded on the right by the graph of \(u(y)\), on the left by the graph of \(v(y)\), below by the line \(y=c\), and above by the line \(y=d\). Then, the volume of the solid of revolution formed by revolving \(\mathbf{Q}\) around the \(y\)-axis is given by\[V= \int ^d_c \pi \left[(u(y))^2−(v(y))^2\right]\,dy. \nonumber \]
Rather than looking at an example of the Washer Method with the \(y\)-axis as the axis of revolution, we now consider an example in which the axis of revolution is a line other than one of the two coordinate axes. The same general method applies, but you may have to visualize just how to describe the cross-sectional area of the volume.
Find the volume of a solid of revolution formed by revolving the region bounded above by \(f(x)=4−x\) and below by the \(x\)-axis over the interval \([0,4]\) around the line \(y=−2.\)
- Solution
-
We graph the functions, the axis of rotation, the solid of revolution, and a representative slice (not shown).
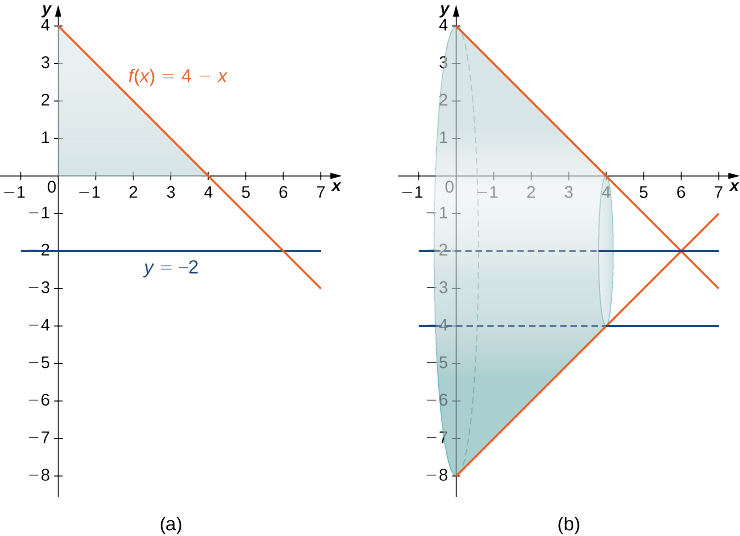
Figure \(\PageIndex{11a}\): The region between the graph of the function \(f(x)=4−x\) and the \(x\)-axis over the interval \([0,4]\).
Figure \( \PageIndex{ 11b } \): Revolving the region about the line \(y=−2\) generates a solid of revolution with a cylindrical hole through its middle.A representative slice is a disk with an inner disk removed. Therefore, the volume of this slice is\[ V_i = \pi \left[ r_O(x_i^*) \right]^2 \Delta x - \pi \left[ r_I(x_i^*) \right]^2 \Delta x, \nonumber \]where the outer radius is the distance between the axis of rotation, \( y = -2 \), and \( f(x) = 4 - x \), and the inner radius is the distance between the axis of rotation and the \( x \)-axis (\( y = 0 \)). Thus,\[ V_i = \pi \left[ f(x_i^*) - (-2) \right]^2 \Delta x - \pi \left[ 0 - (-2) \right]^2 \Delta x = \pi \left[ 4 - x_i^* + 2 \right]^2 \Delta x - \pi ( 2 )^2 \Delta x = \pi \left( 6 - x_i^* \right)^2 \Delta x - 4 \pi \Delta x = \pi \left( 32 - 12 x_i^* + (x_i^*)^2 \right) \Delta x. \nonumber \]Therefore, we have\[\begin{array}{rcl}
V & = & \displaystyle \int ^4_0 \pi \left(x^2 - 12x +32 \right)\,dx \\
\\
& = & \pi \left.\left[\dfrac{x^3}{3}−6x^2+32x\right]\right|^4_0 \\
\\
& = & \dfrac{160 \pi }{3}\,\text{units}^3. \\
\end{array} \nonumber \]Figure \(\PageIndex{11c}\): A dynamic version of this solid of revolution generated using CalcPlot3D.
Find the volume of a solid of revolution formed by revolving the region bounded above by the graph of \(f(x)=x+2\) and below by the \(x\)-axis over the interval \([0,3]\) around the line \(y=−1.\)
- Answer
-
\(60 \pi \) units3
Footnotes
1 For the remainder of this course, I will be using \( r_i \) to denote the radius of rotation for the \( i^{\text{th}} \) slice of a rotational solid, and \( r(x) \) for the "radius function." The distinction between the two should be evident within the context of the discussion.
2 The use of \( K(x_i^*) \) instead of \( \pi \left[ f(x_i^*) \right]^2 \) here is purposeful. As you will see in Section 1.4, we have choices as to the shapes of our slices. The formula for \( K(x_i^*) \) will change accordingly.
3 If you haven't noticed, you will perform a lot of fractional arithmetic in Integral Calculus. This is unavoidable. When doing homework, try to use technology sparingly (also, trust that your professor will give you something manageable on an exam).
4 Since we are computing a horizontal distance, we use our discussion of measuring distances in Section 1.1 to compute the horizontal distance \( x_R - x_L \).
5 The axes of rotation of rotation for this course will be restricted to horizontal or vertical lines.
6 This example showcases your need to be very familiar with Trigonometry in Integral Calculus. If you struggle with Trigonometry, please take the time to review the main topics by referencing Section 1.6 of Differential Calculus.