
3.2.2: Graphs of Certain Quadratic Equations: Part I

( \newcommand{\kernel}{\mathrm{null}\,}\)
By the end of this section, you will be able to:
- Understand what it means to be a solution of a quadratic equation with two variables.
- Represent solutions of certain quadratic equations with two variables.
Before you get started, take this readiness quiz.
- Find a solution of x−3y=7 of the form (2,⋅).
- Find two solutions of x−2y=4 and put them on a graph. Represent all solutions on the graph and determine if (2,4) is a solution by using that graph.
- Graph the solutions to (y−3)=2(x+1) in the simplest way you can think of.
| x | y |
| 2 | 3 |
We learned in the last section that the graph of x2+y2=r2, where r is some positive number, looks like
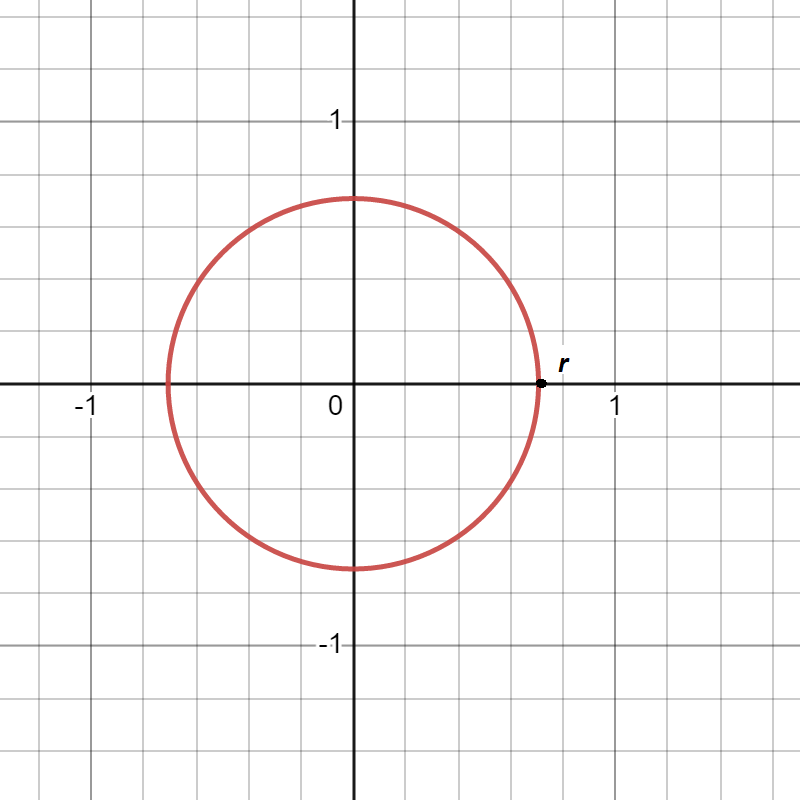.png?revision=1&size=bestfit&width=224&height=224)
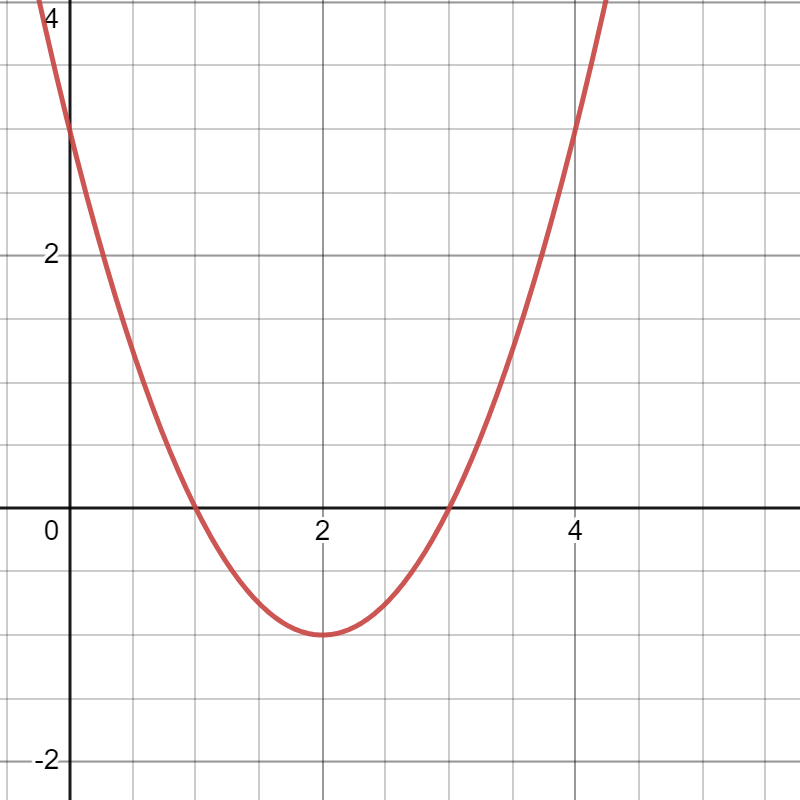
and the graph of y=x2 looks like
.png?revision=1&size=bestfit&width=271&height=271)
Switching x and y
If we switch the roles of x and y in the equation x2+y2=r2 we obtain y2+x2=r2 which has exactly the same solutions.
If we switch the roles of x and y in the equation y=x2 we obtain x=y2. Here, note that the table of values we had will just have the numbers reversed:
xy−−−−−−4−21−100114293
So, the graph of the equation x=y2 is basically switching the axes. You may also think of it as reflecting the graph with respect to the diagonal y=x. Note that the same was also true with the circle, but the graph turned out to be the same! This feature is a type of symmetry. We will discuss other symmetries in the next section.
Graph y2−x3=2 using desmos and try to sketch the graph of x2−y3=2. Check your answer on Desmos.
- Answer
-
This is to be answered with the help of Desmos.
Shifts
Let's investigate the equation (x−2)2+y2=1. Note that if we call x−2, X, (or, X=x+2) then the equation looks familiar:
X2+y2=1,
and we know what the graph looks like, except that the horizontal axis is now the 'X'-axis. Note that x=0, which is the equation to the usual y-axis, is equivalent to X+2=0 or equivalently, X=−2. (Alternatively, we can see that the axis X=0 is equivalent to x=2). The markings are still one unit apart since for example X=1 is equivalent to x=3, X=−1 is equivalent to x=1, and so forth. So, on the usual coordinate plane with x and y -coordinates labeled, the circle has center (2,0) and the radius is still 1.
.png?revision=1&size=bestfit&width=392&height=392)
The same argument holds for any number replacing the '2'. So, the graph of (x−h)2+y2=r2 is a circle of radius (h,0) with radius r.
Also, we can argued the same way when we consider the equation: x2+(y−4)2=1. That is we can replace y−4 with Y (or, y=Y+4 and see that the equation becomes
x2+Y2=1
and so on the x−Y coordinate plane we see that this is a circle centered at the origin with radius 1. But the x−axis on the x−y plane has the equation y=0 which is equivalent to Y+4=0 or Y=−4. The markings are length one unit apart (whether you are using y or Y). So, we see that on the original plane, we see that the center of the circle is (0,4) and the radius is still 1. In general, using the same argument, the graph of x2+(y−k)2=r2 is a circle with center (0,k) and radius r.
Putting these so-called shifts together we see that replacing the x with x−h and the y with y−k in the original equation x2+y2=r2 has the effect of shifting the original graph h units along the x-axis and shifting it k units along the y-axis so that the center of the circle described by
(x−h)2+(y−k)2=r2
is at (h,k) and the radius is r. Note that if we substitute (h,k) in for (x,y) we get 0 on the left side. This is a useful way to determine or check the values of h and k.
Now, consider the basic equation for the parabola y=x2. In exactly the same way (though tracking the vertex instead of the center), we can explore the graph of y−k=(x−h)2.
Consider the equation y=(x−2)2). Letting X=x−2 the equation becomes y=X2 which we know how to graph on the X−y coordinate plane. The y-axis in the x−y plane is given by the equation x=0 or X=−2. (Or, equivalently, X=0 is equivalent to x−2=0 or x=2. So the x-coordinate of the vertex is 2. The markings are the same distance apart no matter if you are considering the x−y- plane or the X−y plane. So, the parabola has vertex (2,0). In general, if we replace x by x−h, the graph can be obtained by shifting the graph of y=x2 along the x-axis by h units.
Similarly, the graph of y−k=x2 is obtained by shifting the graph of y=x2 along the y-axis by k units.
Putting these together, we see that the graph of y−k=(x−h)2 is obtained by shifting the graph of y=x2 along the x-axis by h units and along the y-axis by k units. Note that if we substitute (h,k) in for (x,y) we get the equation 0=0. This can be a nice way of verifying or finding the values of h and k.
Generally, if you know what the graph of an equation in x and y looks like you can graph the equation obtained by replacing x with x−h and y with y−k by shifting the graph of the original. Pinpointing particular features (here it was the center of the circle, and the vertex of the parabola), may help you form your new graph.
- Graph (x−2)2+(y+1)2=4
- Write the equation of the following graph
.png?revision=1&size=bestfit&width=178&height=178)
Solution
1. We know this is a circle due to the fact that it is of the form (x−h)2+(y−k)2=r2. Now we set about graphing it. We see that (2,−1) makes each of the terms on the left side 0 so it is the center of the circle. We start our sketch by finding this point on the coordinate plane. Since r2=4, the radius is 2 (the radius is always non-negative). So, to guide our graph, we move up two from the center and place a point there. This point must be on our circle. Then, from the center we move two units to the right and place a point there since that point must also be on our circle. Similarly, we move down two units from the center and also left to units from the center to find a total of four points that are on our circle.
We know this is a circle so we connect the 4 points in as close to a circle figure as we can. The end result should look like:
.png?revision=1&size=bestfit&width=194&height=194)
2. We see that this is a circle but is shifted so that its center is not (0,0). We see that its center is in fact (−1,3). We can verify this by checking the distance from this point to the right most point on the circle which we find to be 3, by checking the distance between this point and the highest point which is also 3, by checking the distance from this point to the left most point on the circle which is again 3, and by checking the distance from this point to the lowest point on the circle which is again 3. (We in fact only need three of these equations since in the general form of the circle, there are only 3 parameters: h,k, and r.) We also, discovered that the radius is 3! The general form of the circle is:
(x−h)2+(y−k)2=r2.
We determine h and k by noting that when we substitute (−1,3) for (x,y) we should get zero on the left side, so h=−1 and k=3. Also, since r=3, the right hand side is 32=9. So the equation for this circle is:
(x−(−1))2+(y−3)2=9
or, equivalently,
(x+1)2+(y−3)2=9.
- Graph y−3=(x+1)2
- Write the equation of the following graph
.png?revision=1&size=bestfit&width=208&height=208)
- Answer
-
- The first can be checked on Desmos.
- Here we note that this has the shape of the parabola we discussed in the last section. Its vertex is not at (0,0) but it is instead at (2,−1). The standard form of a parabola with this shape (opening up and the same shape as the one in the last section) is y−h=(x−k)2. To determine h and k we note that when we substitute (2,−1) in for (x,y) we should get 0 on both sides of the equation. This forces h=2 and k=−1. We therefore have the equation y−2=(x−(−1))2 or, equivalently, y−2=(x+1)2.
Scaling
Recall the graph for the basic parabola y=x2. What does the graph of 3y=x2 look like? If we let Y=3y then we can write this equation as Y=x2 and we know that on the x−Y -plane, this looks like a parabola (the vertex is where x=0 and Y=0 ). Unlike before, the x−y axes is the same as the x−Y axes. However, when y=1, Y=3 so the y−units occur every 3 of the Y-units. So when we shrink the xY−plane so that the x−y-units are the same as on the original, we see that the graph has been squeezed by a factor of 3 in the y direction. Similarly, compared to the standard parabola y=x2, 13y=x2 appears to be stretched by a factor of 3! Note that when we plug in (1,3) for (x,y) we get the equation 1=1. You can think of 1 as the x−stretch factor and 3as the x−stretch factor. This can be handy to identify the stretching along the axis. The idea is that (1,1) is a point on the standard graph and the question we can ask here is, what is the corresponding point on the graph of 13y=x2.
.png?revision=1&size=bestfit&width=293&height=293)
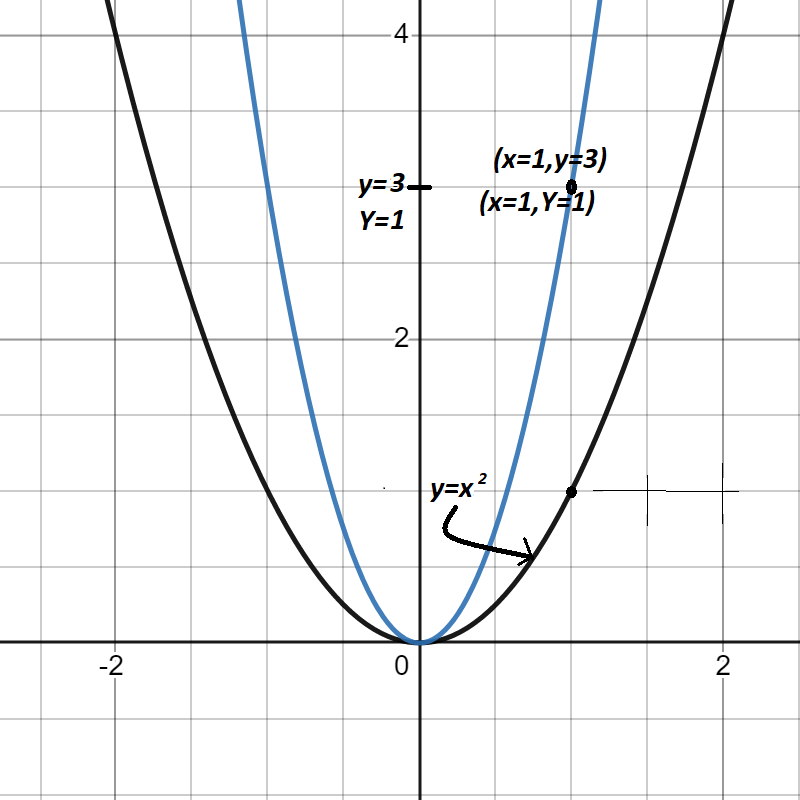.png?revision=1&size=bestfit&width=290&height=290)
In general, if you know what the graph of an equation in x and y, the graph of that equation with every occurrence of y replaced with ay (a>0), can be obtained by stretching or shrinking the graph along the y-axis.
Even more, if you know what the graph of an equation in x and y, the graph of that equation with every occurrence of x replaced with ax can be obtained by stretching or shrinking the graph along the x-axis. More generally, the graph of that equation with every occurrence of x replaced with ax and every occurrence of y replaced with by will stretch/shrink the graph along the x-axis by a factor of a and along the y-axis by a factor of b.
Note that if we consider the equation (2x)2+(2y)2=r2, we can rewrite the equation as X2+Y2=r2, where X=2x and Y=2y so that when x=1 is the same as X=2 so, the graph of the circle on the XY-plane is centered at (0,0) with radius r, but since the distance between two adjacent marks on the X-axis is only 12 on the x−axis, or equivalently, when X=r,x=r2. So rhe radius is actually r/2. We can see this another way:
(2x)2+(2y)2=r2⟹4x2+4y2=r2⟹x2+y2=r24⟹x2+y2=(r2)2
so we see that the radius is r2.
Finally consider y=−x2. We can see by finding solutions the pattern presented looks like the graph of y=x2 which is reflected across the x-axis.
Alternatively, we can rewrite the equation as −y=−x2 and in a similar way as before, let Y=−y. The graph of Y=x2 is the graph of a parabola. But since y and Y are opposites, 1 on the Y-axis is −1 on the y−axis. So the Y axis is numbered in a way that is opposite to the numbering on the y-axis. So, to align them requires us to reflect with respect to the x-axis.
If we do the same with the x, we will see that the graph is identical! There is s symmetry!
In general if we know the graph of an equation of x and y and we replace y by −y then we can graph the resulting equation by "flipping the y-axis" or, reflecting the graph about the x-axis. Also, if we replace x by −x then we can graph the resulting equation by "flipping the x-axis" or, reflecting the graph about the y-axis.
Notice again, that nothing changes with the circle if you replace x by −x or if you replace y with −y! This is another example of symmetry.
- Graph 4y=x2.
- Identify the equation of
.png?revision=1&size=bestfit&width=282&height=282)
Solution
1. We see that this equation has a parabola as its graph because there is one quadratic term and one linear term. The vertex is at (0,0) because there is no shifting of the x or y. Here we note that to arrive at the equation 1=1 we need to substitute (1,1/4). So the point (1,1/4) is on the graph of this parabola. This will help us determine the scaling. The next point to plot will be (2,4⋅14) and then the points symmetricly located on the other side of the vertex.
.png?revision=1&size=bestfit&width=285&height=285)
2. The parabola here has ay=x2. Notice that (1,−1/2) is on the graph and has an x-coordinate of 1. When we substitute (1,−1/2) in for (x,y) we should get 1=1. This leads us to notice that a⋅(−12)=1 so that a=−2. The equation of this parabola is therefore
−2y=x2.
- Graph −12y=x2.
- Identify the equation of
- Answer
-
1. Check your graph on Desmos.
2.
- Graph y=x3 on desmos and try to graph 4y=x3. Find at least two particular solutions and check your answer on Desmos.
- Sketch the graph of −13y=x3 (indicating at least two particular solutions) and check your answer on Desmos.
- Challenge: Sketch the graph of y=(2x)2 (indicating at least two particular solutions) and check your answer on desmos.
- Answer
-
Graphs should be checked on Desmos. Answers will vary.
Combined Examples
1. Graph 2(y−3)=(x+1)2.
2. Find an equation whose solution has the following graph.
.png?revision=1&size=bestfit&width=237&height=237)
Solution
1. We note that this is a parabola. The vertex (h,k) can be found by substituting in (h,k) for (x,y) for which we should get 0=0. This leads to the equation k−3=0 and h+1=0 so that the vertex is (−1,3). Now, there is some scaling on the y-axis. So, we will ask ourselves which values of (x,y) result in (1,1). We find 2(y−3)=1 gives us y=7/2 and x+1=1 gives us x=0. So a point on our parabola is (0,7/2). Notice that as we move from the vertex to the point (0,7/2), the y-coordinate moved up by 1/2, which is our scaling factor. Our next point moving to the right of the vertex is (1,3+4⋅12)=\((1,5). Using the symmetry of the parabola to find points on the other side of the vertex, we find the graph is:
.png?revision=1&size=bestfit&width=313&height=313)
2. This parabola is of the form a(x−h)=(y−k)2. The vertex to this parabola is (−1,1) so when we substitute this for (x,y) we should arrive at the equation (0,0). This leads us to h=−1 and k=1 so that our equation is a(x−(−1))=(y−1)2 or a(x+1)=(y−1)2. Now to find our point that corresponds to (1,1) in the standard parabola. We look for points whose y-coordinate is 1 away from the y-coordinate of the vertex:1+1=2. We see that (−3,2) is a point on the parabola and has a y-coordinate of 2. When we plug this point into the equation we should get the equation 1=1 which will allow us to determine the value of a:
We find that a(−3+1)=1 so that a=−1/2.
The parabola therefore has the equation −12(x+1)=(y−1)2, which can be verified with Desmos.
1. Graph 12(x−1)=(y+2)2. Label at least two points.
2. Find an equation whose solution has the following graph.
.png?revision=1&size=bestfit&width=230&height=230)
- Answer
-
1. Check the graph on Desmos. Add texts here.
2. −2(y+3)=(x+1)2
An interesting point to consider is an equation where there is scaling of both axes in the case of a circle: a(x-h)^2+a(y-k)^2=r^2. What is the effect? Is this still a circle?
Other Quadratic Equations
We have only dealt with certain types of equations which lead to circles and parabolas.
We could ask:
What is the graph of (ax)2+y2=r2? We stretch/shrink along the x-axis and the result is called an ellipse!
What about xy=1? This one is a new one, called a hyperbola.
There are also all that we've discussed rotated! To discuss all of these is beyond the scope of this book.
More Graphing
We now look at certain quadratic equations in x and y and try to write them in a way that we can use the previous section to graph.
We have already learned a process by which you can turn an expression that looks like ax2+bx into one that looks like a(x+B)2. It was called completing the square. This is the key to graphing the equations in this section.
1. Graph x2+y2−4y−2x−2=0.
2. Graph x2−5x+3y=0.
Solution
1. We see this equation is quadratic in x and y so we anticipate that this is a circle and proceed to put it in the form (x−h)2+(y−k)2=r2. To do this we recall the process of completing the square:
| x2+y2−4y−2x−2=0 | |
| Note that x2−2x=(x−1)2−1 and y2−4y=(y−2)2−4. | (x−1)2−1+(y−2)2−4−2=0 |
| Combine constants on the right hand side. | (x−1)2+(y−2)2=7 |
| Identify the center and the radius. | The center is (1,2) and the radius is √7 |
| Locate four particular points on the circle to aid in the sketch. |
(1+√7,2) (1−√7,2) (1,2+√7) (1,2−√7) |
Graph the points and form a circle:
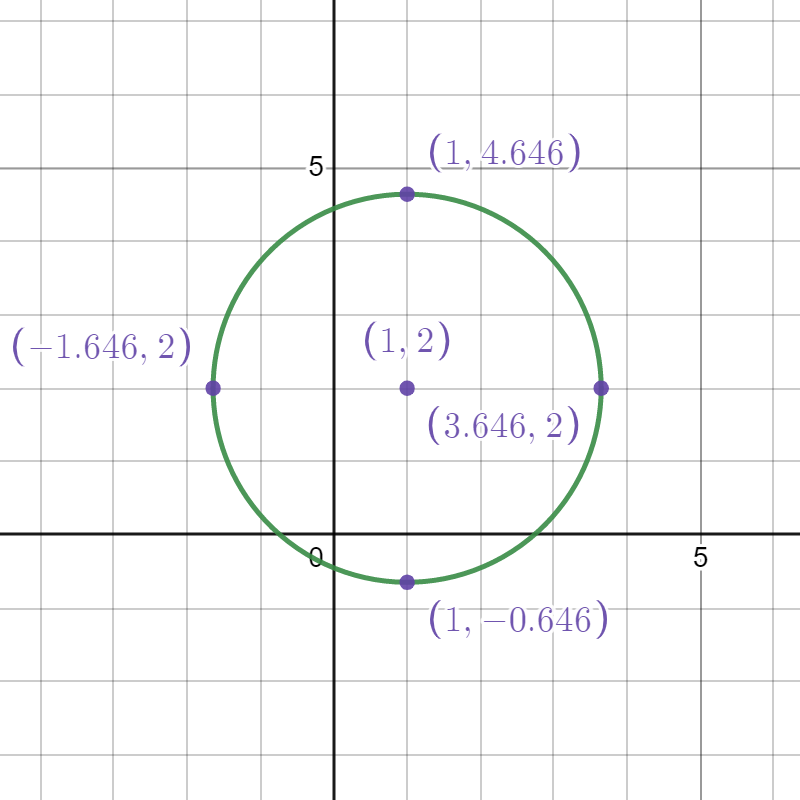.png?revision=1&size=bestfit&width=297&height=297)
2. Note that this is quadratic in x and linear in y. We therefore anticipate that this is a parabola and aim to put it in the form a(y−k)=(x−h)2.
| x2−5x+3y=0 | |
| x2−5x=(x−52)2−254 | −3y=(x−52)2−254 |
| The constant on the right side needs to be brought to join the y-term. | −3y+254=(x−52)2 |
| Finally, let's factor out the −3 to bring it into form. | −3(y−2512)=(x−52)2 |
| Identify the vertex (the values that can be substituted for x and y that will result in 0=0). | The vertex is (52,2512). |
|
Identify the point corresponding to the point (1,1) of the basic parabola. |
1=−3(y−2512)⟹y=2512−13=74 1=x−52⟹x=72 So, (72,74) is on the graph. |
| Identify one more point by noting that in moving from the vertex to (74,74), the y− coordinate moved down by 13. |
Another point on our graph is (92,2512−4⋅13), or, more simply, (92,912). |
| Plot these three points and the symmetric points on the other side of the vertex and complete the sketch. |
.png?revision=1&size=bestfit&width=267&height=267)
1. Graph x2+y2+6x+2y−1=0.
2. Graph y2−5x+3y=0.
- Answer
-
Expositions of solutions will vary. Final graphs can be checked on Desmos. We will give the form after completing the square here.
1. The graph is a circle. (x+3)2+(y+1)2=11 so the center is (−3,−1) and its radius is √11.
2. The graph is a parabola. (y+3/2)2−9/4=5x which leads to 5(x+9/20)=(y+3/2)2 with vertex (−9/20,−3/2). The point corresponding to the (1,1) of the basic parabola is: (1/5−9/20,−12)=(−5/20,−12). The difference of the y-coordinates between this point and the vertex is 1/5. So, another point on the parabola is: (−9/20+4⋅15,1/2)=(7/20,1/2). Look at the graph and these points plotted on Desmos.