
1.2: Adding and Subtracting Whole Numbers


- Last updated
- Aug 14, 2020
- Save as PDF

( \newcommand{\kernel}{\mathrm{null}\,}\)
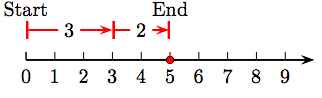
In the expression 3 + 4, which shows the sum of two whole numbers, the whole numbers 3 and 4 are called addends or terms. We can use a visual approach to find the sum of 3 and 4. First, construct a number line as shown in Figure 1.2.
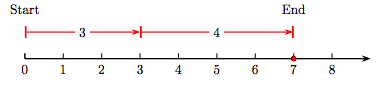
To add 3 and 4, proceed as follows.
- Start at the number 0, then draw an arrow 3 units to the right, as shown in Figure 1.2. This arrow has magnitude (length) three and represents the whole number 3.
- Draw a second arrow of length four, starting at the end of the first arrow representing the number 3. This arrow has magnitude (length) four and represents the whole number 4.
- The sum of 3 and 4 could be represented by an arrow that starts at the number 0 and ends at the number 7. However, we prefer to mark this sum on the number line as a solid dot at the whole number 7. This number represents the sum of the whole numbers 3 and 4.
The Commutative Property of Addition
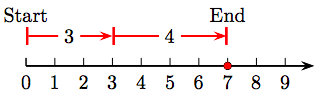
Let’s change the order in which we add the whole numbers 3 and 4. That is, let’s find the sum 4 + 3 instead.
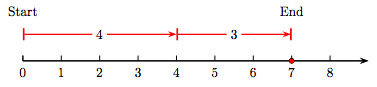
As you can see in Figure 1.3, we start at zero then draw an arrow of length four, followed by an arrow of length three. However, the result is the same; i.e., 4 + 3 = 7.
Thus, the order in which we add three and four does not matter; that is,
3 + 4=4 + 3.
This property of addition of whole numbers is known as the commutative property of addition.
Let a and b represent two whole numbers. Then,
a + b = b + a.
Grouping Symbols
In mathematics, we use grouping symbols to affect the order in which an expression is evaluated. Whether we use parentheses, brackets, or curly braces, the expression inside any pair of grouping symbols must be evaluated first. For example, note how we first evaluate the sum in the parentheses in the following calculation.
(3 + 4) + 5 = 7 + 5
= 12
The rule is simple: Whatever is inside the parentheses is evaluated first.
When writing mathematical statements, follow the mantra:
One equal sign per line.
We can use brackets instead of parentheses.
5 + [7 + 9] = 5 + 16
= 21
Again, note how the expression inside the brackets is evaluated first.
We can also use curly braces instead of parentheses or brackets.
{2+3} + 4 = 5 + 4
= 9
Again, note how the expression inside the curly braces is evaluated first.
If grouping symbols are nested, we evaluate the innermost parentheses first.
For example,
2 + [3 + (4 + 5)] = 2 + [3 + 9]
= 2 + 12
= 14.
Use parentheses, brackets, or curly braces to delimit the part of an expression you want evaluated first. If grouping symbols are nested, evaluate the expression in the innermost pair of grouping symbols first.
The Associative Property of Addition
Consider the evaluation of the expression (2+3)+4. We evaluate the expression in parentheses first.
(2 + 3) + 4 = 5 + 4
= 9
Now, suppose we change the order of addition to 2 + (3 + 4). Then,
2 + (3 + 4) = 2 + 7
= 9.
Although the grouping has changed, the result is the same. That is,
(2 + 3) + 4 = 2 + (3 + 4).
This property of addition of whole numbers is called the associate property of addition.
Let a, b, and c represent whole numbers. Then,
(a + b) + c = a + (b + c).
Because of the associate property of addition, when presented with a sum of three numbers, whether you start by adding the first two numbers or the last two numbers, the resulting sum is the same.
The Additive Identity
Imagine a number line visualization of the sum of four and zero; i.e., 4 + 0.
In Figure 1.4, we start at zero, then draw an arrow of magnitude (length) four pointing to the right. Now, at the end of this arrow, attach a second arrow of length zero. Of course, that means that we remain right where we are, at 4. Hence the shaded dot at 4 is the sum. That is, 4 + 0 = 4.
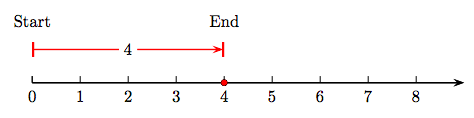
The whole number zero is called the additive identity. If a is any whole number, the
a + 0 = a.
The number zero is called the additive identity because if you add zero to any number, you get the identical number back.
Adding Larger Whole Numbers
For completeness, we include two examples of adding larger whole numbers. Hopefully, the algorithm is familiar from previous coursework.
Simplify: 1, 234 + 498.
Solution
Align the numbers vertically, then add, starting at the furthest column to the right. Add the digits in the ones column, 4 + 8 = 12. Write the 2, then carry a 1 to the tens column. Next, add the digits in the tens column, 3 + 9 = 12, add the carry to get 13, then write the 3 and carry a 1 to the hundreds column. Continue in this manner, working from right to left
111234+4981732
Therefore, 1, 234 + 498 = 1, 732
Simplify: 1,286 + 349.
- Answer
-
1635
Add three or more numbers in the same manner.
Simplify: 256 + 322 + 418.
Solution
Align the numbers vertically, then add, starting at the furthest column to the right. Add the digits in the ones column, 6 + 2 + 8 = 16. Write the 6, then carry a 1 to the tens column. Continue in this manner, working from right to left.
256322+418996
Therefore, 256 + 322 + 418 = 996.
Simplify: 256 + 342 + 283
- Answer
-
881
Subtraction of Whole Numbers
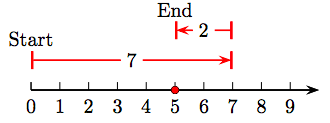
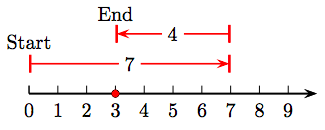
The key idea is this: Subtraction is the opposite of addition. For example, consider the difference 7 - 4 depicted on the number line in Figure 1.5.
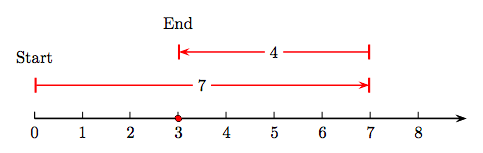
If we were adding 7 and 4, we first draw an arrow starting at zero pointing to the right with magnitude (length) seven. Then, to add 4, we would draw a second arrow of magnitude (length) 4, attached to the end of the first arrow and pointing to the right.
However, because subtraction is the opposite of addition, in Figure 1.5 we attach an arrow of magnitude (length) four to the end of the first arrow, but pointing in the opposite direction (to the left). Note that this last arrow ends at the answer, which is a shaded dot on the number line at 3. That is, 7 − 4 = 3.
Note that subtraction is not commutative; that is, it make no sense to say that 7 − 5 is the same as 5 − 7.
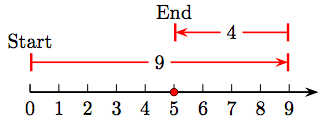
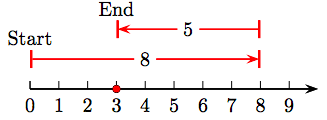
Subtraction is not associative. It is not the case that (9 − 5) − 2 is the same as 9 − (5 − 2). On the one hand,
(9 − 5) − 2 = 4 − 2
= 2,
but
9 − (5 − 2) = 9 − 3
= 6.
Subtracting Larger Whole Numbers
Much as we did with adding larger whole numbers, to subtract two large whole numbers, align them vertically then subtract, working from right to left. You may have to “borrow” to complete the subtraction at any step.
Simplify: 1, 755 − 328.
Solution
Align the numbers vertically, then subtract, starting at the ones column, then working right to left. At the ones column, we cannot subtract 8 from 5, so we borrow from the previous column. Now, 8 from 15 is 7. Continue in this manner, working from right to left.
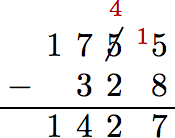
Therefore, 1, 755 − 328 = 1, 427.
Simplify: 5,635 - 288.
- Answer
-
5,347
Order of Operations
In the absence of grouping symbols, it is important to understand that addition holds no precedence over subtraction, and vice-versa.
Perform all additions and subtractions in the order presented, moving left to right.
Let’s look at an example.
Simplify the expression 15−8+4.
Solution
This example can be trickier than it seems. However, if we follow the rule (perform all additions and subtractions in the order presented, moving left to right), we should have no trouble. First comes fifteen minus eight, which is seven. Then seven plus four is eleven.
15−8+4=7+4=11.
Simplify: 25−10+8.
- Answer
-
23
Note that it is possible to arrive at a different (but incorrect) answer if we favor addition over subtraction in Example 4. If we first add eight and four, then 15 − 8 + 4 becomes 15 − 12, which is 3. However, note that this is incorrect, because it violates the rule “perform all additions and subtractions in the order presented, moving left to right.”
Applications — Geometry
There are any number of applications that require a sum or difference of whole numbers. Let’s examine a few from the world of geometry.
In geometry a polygon is a plane figure made up of a closed path of a finite sequence of segments. The segments are called the edges or sides of the polygon and the points where two edges meet are called the vertices of the polygon. The perimeter of any polygon is the sum of the lengths of its sides.
A quadrilateral is a polygon with four sides. Find the perimeter of the quadrilateral shown below, where the sides are measured below.
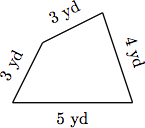
Solution
To find the perimeter of the quadrilateral, find the sum of the lengths of the sides.
Perimeter = 3 + 3 + 4 + 5 = 15
Hence, the perimeter of the quadrilateral is 15 yards.
A quadrilateral has sides that measure in 4 in., 3 in., 5 in., and 5 in. Find the perimeter.
- Answer
-
17 inches
A quadrilateral (four sides) is a rectangle if all four of its angles are right angles. It can be shown that the opposite sides of a rectangle must be equal. Find the perimeter of the rectangle shown below, where the sides of the rectangle are measured in meters.
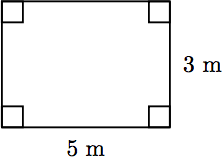
Solution
To find the perimeter of the rectangle, find the sum of the four sides. Because opposite sides have the same length, we have two sides of length 5 meters and two sides of length 3 meters. Hence,
Perimeter = 5 + 3 + 5 + 3 = 16.
Thus, the perimeter of the rectangle is 16 meters.
A rectangle has length 12 meters and width 8 meters. Find its perimeter.
- Answer
-
40 meters
A quadrilateral (four sides) is a square if all four of its sides measures 18 centimeters. Find its perimeter. are equal and all four of its angles are right angles. Pictured below is a square having a side of length 12 feet. Find the perimeter of the square.

Solution
Because the quadrilateral is a square, all four sides have the same length, namely 12 feet. To find the perimeter of the square, find the sum of the four sides. Perimeter = 12 + 12 + 12 + 12 = 48
Hence, the perimeter of the square is 48 feet.
A square has a side that measures 18 centimeters. Find its perimeter.
- Answer
-
72 centimeters
Application — Alternative Fuels
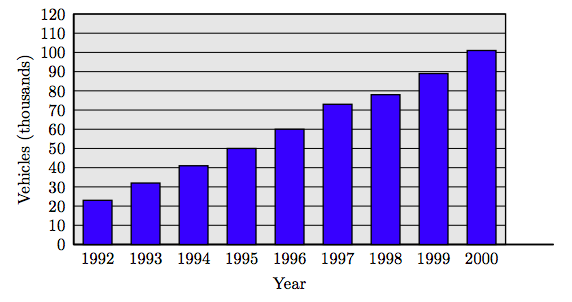
Automobiles that run on alternative fuels (other than gasoline) have increased in the United States over the years.
Table 1.2 show the number of cars (in thousands) running on compressed natural gas versus the year. Create a bar chart showing the number of cars running on compressed natural gas versus the year.
| Year | 1992 | 1993 | 1994 | 1995 | 1996 | 1997 | 1998 | 1999 | 2000 |
| Number | 23 | 32 | 4` | 50 | 60 | 73 | 78 | 89 | 101 |
Table 1.2: Number of vehicles (in thousands) running on compressed natural gas.
Solution
Place the years on the horizontal axis. At each year, sketch a bar having height equal to the number of cars in that year that are running on compressed natural gas. Scale the vertical axis in thousands.
The following table shows the number of hybrid cars (in thousands) by country.
| Country | Number |
| U.S. | 279 |
| Japan | 77 |
| Canada | 17 |
| U.K. | 14 |
| Netherlands | 11 |
Create a bar chart showing the number of cars versus the country of use.
Using the data in Table 1.2, crease a table that shows the differences in consecutive years, then create a line plot of the result. In what consecutive years did the United States see the greatest increase in cars powered by compressed natural gas?
Solution
Table 1.3 shows the differences in consecutive years.
Next, craft a line graph. Place consecutive years on the horizontal axis. At each consecutive year pair, plot a point at a height equal to the difference in alternative fuel vehicles. Connect the points with straight line segments.
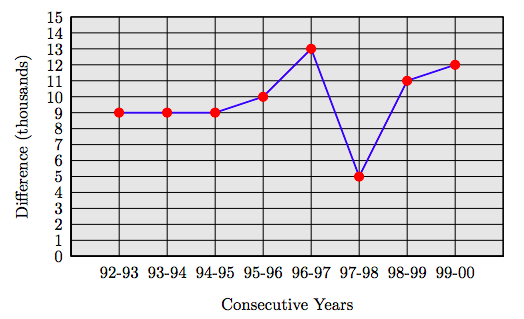
Note how the line graph makes it completely clear that the greatest increase in vehicles powered by compressed natural gas occurred in the consecutive years 1996-1997, an increase of 13,000 vehicles.
The following table show Alphonso's percentage scores on his examinations in mathematics.
| Exam | Percentage |
| Exam #1 | 52 |
| Exam #2 | 45 |
| Exam #3 | 72 |
| Exam #4 | 889 |
| Exam #5 | 76 |
Construct a line graph of Alphonso's exam scores versus exam number.
Exercises
1. Sketch a number line diagram depicting the sum 3 + 2, as shown in Figure 1.2 in the narrative of this section.
2. Sketch a number line diagram depicting the sum 3 + 5, as shown in Figure 1.2 in the narrative of this section.
3. Sketch a number line diagram depicting the sum 3 + 4, as shown in Figure 1.2 in the narrative of this section.
4. Sketch a number line diagram depicting the sum 2 + 4, as shown in Figure 1.2 in the narrative of this section.
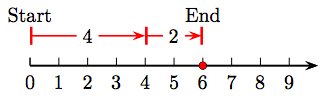
5. Sketch a number line diagram depicting the sum 4 + 2, as shown in Figure 1.2 in the narrative of this section.
6. Sketch a number line diagram depicting the sum 4 + 3, as shown in Figure 1.2 in the narrative of this section.
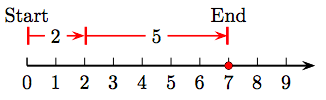
7. Sketch a number line diagram depicting the sum 2 + 5, as shown in Figure 1.2 in the narrative of this section.
8. Sketch a number line diagram depicting the sum 4 + 5, as shown in Figure 1.2 in the narrative of this section.
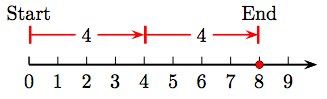
9. Sketch a number line diagram depicting the sum 4 + 4, as shown in Figure 1.2 in the narrative of this section.
10. Sketch a number line diagram depicting the sum 3 + 3, as shown in Figure 1.2 in the narrative of this section.
In Exercises 11-28, determine which property of addition is depicted by the given identity
11. 28 + 0 = 28
12. 53 + 0 = 53
13. 24 + 0 = 24
14. 93 + 0 = 93
15. (51 + 66) + 88 = 51 + (66 + 88)
16. (90 + 96) + 4 = 90 + (96 + 4)
17. 64 + 39 = 39 + 64
18. 68 + 73 = 73 + 68
19. (70 + 27) + 52 = 70 + (27 + 52)
20. (8 + 53) + 81 = 8 + (53 + 81)
21. 79 + 0 = 79
22. 42 + 0 = 42
23. 10 + 94 = 94 + 10
24. 55 + 86 = 86 + 55
25. 47 + 26 = 26 + 47
26. 62 + 26 = 26 + 62
27. (61 + 53) + 29 = 61 + (53 + 29)
28. (29 + 96) + 61 = 29 + (96 + 61)
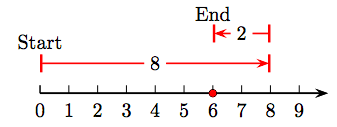
29. Sketch a number line diagram depicting the difference 8−2, as shown in Figure 1.5 in the narrative of this section.
30. Sketch a number line diagram depicting the difference 8−4, as shown in Figure 1.5 in the narrative of this section.
31. Sketch a number line diagram depicting the difference 7−2, as shown in Figure 1.5 in the narrative of this section.
32. Sketch a number line diagram depicting the difference 9−5, as shown in Figure 1.5 in the narrative of this section.
33. Sketch a number line diagram depicting the difference 7−4, as shown in Figure 1.5 in the narrative of this section.
34. Sketch a number line diagram depicting the difference 6−4, as shown in Figure 1.5 in the narrative of this section.
35. Sketch a number line diagram depicting the difference 9−4, as shown in Figure 1.5 in the narrative of this section.
36. Sketch a number line diagram depicting the difference 6−5, as shown in Figure 1.5 in the narrative of this section.
37. Sketch a number line diagram depicting the difference 8−5, as shown in Figure 1.5 in the narrative of this section.
38. Sketch a number line diagram depicting the difference 9−3, as shown in Figure 1.5 in the narrative of this section.
In Exercises 39-50, simplify the given expression.
39. 16 − 8+2
40. 17 − 3+5
41. 20 − 5 + 14
42. 14 − 5+6
43. 15 − 2+5
44. 13 − 4+2
45. 12 − 5+4
46. 19 − 4 + 13
47. 12 − 6+4
48. 13 − 4 + 18
49. 15 − 5+8
50. 13 − 3 + 11
In Exercises 51-58, the width W and length L of a rectangle are given. Find the perimeter P of the rectangle.
51. W = 7 in, L = 9 in
52. W = 4 in, L = 6 in
53. W = 8 in, L = 9 in
54. W = 5 in, L = 9 in
55. W = 4 cm, L = 6 cm
56. W = 5 in, L = 8 in
57. W = 4 cm, L = 7 cm
58. W = 4 in, L = 9 in
In Exercises 59-66, the length s of a side of a square is given. Find the perimeter P of the square.
59. s = 25 cm
60. s = 21 in
61. s = 16 cm
62. s = 10 in
63. s = 18 in
64. s = 7 in
65. s = 3 in
66. s = 20 in
In Exercises 67-86, find the sum.
67. 3005 + 5217
68. 1870 + 5021
69. 575 + 354 + 759
70. 140 + 962 + 817
71. 472 + (520 + 575)
72. 318 + (397 + 437)
73. 274 + (764 + 690)
74. 638 + (310 + 447)
75. 8583 + 592
76. 5357 + 9936
77. 899 + 528 + 116
78. 841 + 368 + 919
79. (466 + 744) + 517
80. (899 + 996) + 295
81. 563 + 298 + 611 + 828
82. 789 + 328 + 887 + 729
83. 607 + 29 + 270 + 245
84. 738 + 471 + 876 + 469
85. (86 + 557) + 80
86. (435 + 124) + 132
In Exercises 87-104, find the difference.
87. 3493 − 2034 − 227
88. 3950 − 1530 − 2363
89. 8338 − 7366
90. 2157 − 1224
91. 2974 − 2374
92. 881 − 606
93. 3838 − (777 − 241)
94. 8695 − (6290 − 4233)
95. 5846 − 541 − 4577
96. 5738 − 280 − 4280
97. 3084 − (2882 − 614)
98. 1841 − (217 − 28)
99. 2103 − (1265 − 251)
100. 1471 − (640 − 50)
101. 9764 − 4837 − 150
102. 9626 − 8363 − 1052
103. 7095 − 226
104. 4826 − 1199
105. Water Subsidies. Since the drought began in 2007, California farms have received $79 million in water subsidies. California cotton and rice farmers received an additional $439 million. How much total water subsidies have farmers received? Associated Press Times-Standard 4/15/09
106. War Budget. The 2010 Federal budget allocates $534 billion for the Department of Defense base programs and an additional $130 billion for the nation’s two wars. How much will the Department of Defense receive altogether? Associated Press Times-Standard 5/8/09
107. Sun Frost. Arcata, CA is home to Sun Frost, a manufacturer of highly efficient refrigerators and freezers. The AC model RF12 refrigerator/freezer costs $2,279 while an R16 model refrigerator/freezer costs $3,017. How much more does the R16 model cost? Source: www.sunfrost.com/retail pricelist.html
108. Shuttle Orbit. The space shuttle usually orbits at 250 miles above the surface of the earth. To service the Hubble Space Telescope, the shuttle had to go to 350 miles above the surface. How much higher did the shuttle have to orbit?
109. Earth’s Orbit. Earth orbits the sun in an ellipse. When earth is at its closest to the sun, called perihelion, earth is about 147 million kilometers. When earth is at its furthest point from the sun, called aphelion, earth is about 152 million kilometers from the sun. What’s the difference in millions of kilometers between aphelion and perihelion?
110. Pluto’s Orbit. Pluto’s orbit is highly eccentric. Find the difference between Pluto’s closest approach to the sun and Pluto’s furthest distance from the sun if Pluto’s perihelion (closest point on its orbit about the sun) is about 7 billion kilometers and its aphelion (furthest point on its orbit about the sun) is about 30 billion kilometers.
111. Sunspot Temperature. The surface of the sun is about 10,000 degrees Fahrenheit. Sunspots are darker regions on the surface of the sun that have a relatively cooler temperature of 6,300 degrees Fahrenheit. How many degrees cooler are sunspots?
112. Jobs. The Times-Standard reports that over the next year, the credit- and debitcard processing business Humboldt Merchant Services expects to cut 36 of its 80 jobs, but then turn around and hire another 21. How many people will be working for the company then? Times-Standard 5/6/09
113. Wild tigers. The chart shows the estimated wild tiger population, by region. According to this chart, what is the total wild tiger population worldwide? Associated Press-Times-Standard 01/24/10 Pressure mounts to save the tiger.
| Region | Tiger population |
| India, Nepal and Bhutan | 1650 |
| China and Russia | 450 |
| Bangladesh | 250 |
| Sumatra (Indonesia) | 400 |
| Malaysia | 500 |
| other SE Asia | 350 |
114. Pirate Attacks. The following bar chart tracks pirate attacks off the coast of Somalia.
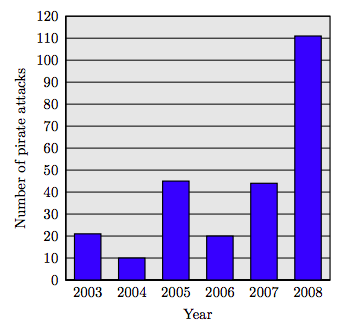
Source: ICC International Maritime Bureau, AP Times-Standard, 4/15/2009
a) How many pirate attacks were there in 2003, 2004, and 2005 combined?
b) How many pirate attacks were there in 2006, 2007, and 2008 combined?
c) How many more pirate attacks were there in 2008 than in 2007?
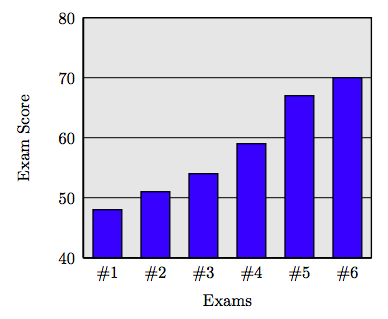
115. Emily shows improvement on each successive examination throughout the term. Her exam scores are recorded in the following table.
| Exam | Score |
| Exam #1 | 48 |
| Exam #2 | 51 |
| Exam #3 | 54 |
| Exam #4 | 59 |
| Exam #5 | 67 |
| Exam #6 | 70 |
a) Create a bar plot for Emily’s examination scores. Place the examination numbers on the horizontal axis in the same order shown in the table above.
b) Create a table that shows successive differences in examination scores. Make a line plot of these differences. Between which two exams did Emily show the greatest improvement?
116. Jason shows improvement on each successive examination throughout the term. His exam scores are recorded in the following table.
| Exam | Score |
| Exam #1 | 34 |
| Exam #2 | 42 |
| Exam #3 | 45 |
| Exam #4 | 50 |
| Exam #5 | 57 |
| Exam #6 | 62 |
a) Create a bar plot for Jason’s examination scores. Place the examination numbers on the horizontal axis in the same order shown in the table above.
b) Create a table that shows successive differences in examination scores. Make a line plot of these differences. Between which two exams did Jason show the greatest improvement?
Answers
1. 3 + 2 = 5.
3. 3 + 4 = 7.
5. 4 + 2 = 6.
7. 2 + 5 = 7.
9. 4 + 4 = 8.
11. Additive identity property of addition.
13. Additive identity property of addition.
15. Associative property of addition
17. Commutative property of addition
19. Associative property of addition
21. Additive identity property of addition.
23. Commutative property of addition
25. Commutative property of addition
27. Associative property of addition
29. 8 − 2 = 6.
31. 7 − 2 = 5.
33. 7 − 4 = 3.
35. 9 − 4 = 5.
37. 8 − 5 = 3.
39. 10
41. 29
43. 18
45. 11
47. 10
49. 18
51. P = 32 in
53. P = 34 in
55. P = 20 cm
57. P = 22 cm
59. P = 100 cm
61. P = 64 cm
63. P = 72 in
65. P = 12 in
67. 8222
69. 1688
71. 1567
73. 1728
75. 9175
77. 1543
79. 1727
81. 2300
83. 1151
85. 723
87. 1232
89. 972
91. 600
93. 3302
95. 728
97. 816
99. 1089
101. 4777
103. 6869
105. $518 million
107. $738
109. 5 million kilometers
111. 3,700 degrees Fahrenheit
113. 3600
115. a) Bar chart.
b) Line plot of consecutive differences. The line plot of consecutive examination score differences.
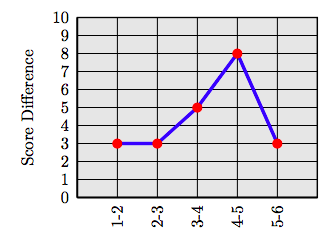
The largest improvement was between Exam #4 and Exam #5, where Emily improved by 8 points.