2.R: Periodic Functions (Review)
- Page ID
- 60919

\( \newcommand{\vecs}[1]{\overset { \scriptstyle \rightharpoonup} {\mathbf{#1}} } \)
\( \newcommand{\vecd}[1]{\overset{-\!-\!\rightharpoonup}{\vphantom{a}\smash {#1}}} \)
\( \newcommand{\dsum}{\displaystyle\sum\limits} \)
\( \newcommand{\dint}{\displaystyle\int\limits} \)
\( \newcommand{\dlim}{\displaystyle\lim\limits} \)
\( \newcommand{\id}{\mathrm{id}}\) \( \newcommand{\Span}{\mathrm{span}}\)
( \newcommand{\kernel}{\mathrm{null}\,}\) \( \newcommand{\range}{\mathrm{range}\,}\)
\( \newcommand{\RealPart}{\mathrm{Re}}\) \( \newcommand{\ImaginaryPart}{\mathrm{Im}}\)
\( \newcommand{\Argument}{\mathrm{Arg}}\) \( \newcommand{\norm}[1]{\| #1 \|}\)
\( \newcommand{\inner}[2]{\langle #1, #2 \rangle}\)
\( \newcommand{\Span}{\mathrm{span}}\)
\( \newcommand{\id}{\mathrm{id}}\)
\( \newcommand{\Span}{\mathrm{span}}\)
\( \newcommand{\kernel}{\mathrm{null}\,}\)
\( \newcommand{\range}{\mathrm{range}\,}\)
\( \newcommand{\RealPart}{\mathrm{Re}}\)
\( \newcommand{\ImaginaryPart}{\mathrm{Im}}\)
\( \newcommand{\Argument}{\mathrm{Arg}}\)
\( \newcommand{\norm}[1]{\| #1 \|}\)
\( \newcommand{\inner}[2]{\langle #1, #2 \rangle}\)
\( \newcommand{\Span}{\mathrm{span}}\) \( \newcommand{\AA}{\unicode[.8,0]{x212B}}\)
\( \newcommand{\vectorA}[1]{\vec{#1}} % arrow\)
\( \newcommand{\vectorAt}[1]{\vec{\text{#1}}} % arrow\)
\( \newcommand{\vectorB}[1]{\overset { \scriptstyle \rightharpoonup} {\mathbf{#1}} } \)
\( \newcommand{\vectorC}[1]{\textbf{#1}} \)
\( \newcommand{\vectorD}[1]{\overrightarrow{#1}} \)
\( \newcommand{\vectorDt}[1]{\overrightarrow{\text{#1}}} \)
\( \newcommand{\vectE}[1]{\overset{-\!-\!\rightharpoonup}{\vphantom{a}\smash{\mathbf {#1}}}} \)
\( \newcommand{\vecs}[1]{\overset { \scriptstyle \rightharpoonup} {\mathbf{#1}} } \)
\(\newcommand{\longvect}{\overrightarrow}\)
\( \newcommand{\vecd}[1]{\overset{-\!-\!\rightharpoonup}{\vphantom{a}\smash {#1}}} \)
\(\newcommand{\avec}{\mathbf a}\) \(\newcommand{\bvec}{\mathbf b}\) \(\newcommand{\cvec}{\mathbf c}\) \(\newcommand{\dvec}{\mathbf d}\) \(\newcommand{\dtil}{\widetilde{\mathbf d}}\) \(\newcommand{\evec}{\mathbf e}\) \(\newcommand{\fvec}{\mathbf f}\) \(\newcommand{\nvec}{\mathbf n}\) \(\newcommand{\pvec}{\mathbf p}\) \(\newcommand{\qvec}{\mathbf q}\) \(\newcommand{\svec}{\mathbf s}\) \(\newcommand{\tvec}{\mathbf t}\) \(\newcommand{\uvec}{\mathbf u}\) \(\newcommand{\vvec}{\mathbf v}\) \(\newcommand{\wvec}{\mathbf w}\) \(\newcommand{\xvec}{\mathbf x}\) \(\newcommand{\yvec}{\mathbf y}\) \(\newcommand{\zvec}{\mathbf z}\) \(\newcommand{\rvec}{\mathbf r}\) \(\newcommand{\mvec}{\mathbf m}\) \(\newcommand{\zerovec}{\mathbf 0}\) \(\newcommand{\onevec}{\mathbf 1}\) \(\newcommand{\real}{\mathbb R}\) \(\newcommand{\twovec}[2]{\left[\begin{array}{r}#1 \\ #2 \end{array}\right]}\) \(\newcommand{\ctwovec}[2]{\left[\begin{array}{c}#1 \\ #2 \end{array}\right]}\) \(\newcommand{\threevec}[3]{\left[\begin{array}{r}#1 \\ #2 \\ #3 \end{array}\right]}\) \(\newcommand{\cthreevec}[3]{\left[\begin{array}{c}#1 \\ #2 \\ #3 \end{array}\right]}\) \(\newcommand{\fourvec}[4]{\left[\begin{array}{r}#1 \\ #2 \\ #3 \\ #4 \end{array}\right]}\) \(\newcommand{\cfourvec}[4]{\left[\begin{array}{c}#1 \\ #2 \\ #3 \\ #4 \end{array}\right]}\) \(\newcommand{\fivevec}[5]{\left[\begin{array}{r}#1 \\ #2 \\ #3 \\ #4 \\ #5 \\ \end{array}\right]}\) \(\newcommand{\cfivevec}[5]{\left[\begin{array}{c}#1 \\ #2 \\ #3 \\ #4 \\ #5 \\ \end{array}\right]}\) \(\newcommand{\mattwo}[4]{\left[\begin{array}{rr}#1 \amp #2 \\ #3 \amp #4 \\ \end{array}\right]}\) \(\newcommand{\laspan}[1]{\text{Span}\{#1\}}\) \(\newcommand{\bcal}{\cal B}\) \(\newcommand{\ccal}{\cal C}\) \(\newcommand{\scal}{\cal S}\) \(\newcommand{\wcal}{\cal W}\) \(\newcommand{\ecal}{\cal E}\) \(\newcommand{\coords}[2]{\left\{#1\right\}_{#2}}\) \(\newcommand{\gray}[1]{\color{gray}{#1}}\) \(\newcommand{\lgray}[1]{\color{lightgray}{#1}}\) \(\newcommand{\rank}{\operatorname{rank}}\) \(\newcommand{\row}{\text{Row}}\) \(\newcommand{\col}{\text{Col}}\) \(\renewcommand{\row}{\text{Row}}\) \(\newcommand{\nul}{\text{Nul}}\) \(\newcommand{\var}{\text{Var}}\) \(\newcommand{\corr}{\text{corr}}\) \(\newcommand{\len}[1]{\left|#1\right|}\) \(\newcommand{\bbar}{\overline{\bvec}}\) \(\newcommand{\bhat}{\widehat{\bvec}}\) \(\newcommand{\bperp}{\bvec^\perp}\) \(\newcommand{\xhat}{\widehat{\xvec}}\) \(\newcommand{\vhat}{\widehat{\vvec}}\) \(\newcommand{\uhat}{\widehat{\uvec}}\) \(\newcommand{\what}{\widehat{\wvec}}\) \(\newcommand{\Sighat}{\widehat{\Sigma}}\) \(\newcommand{\lt}{<}\) \(\newcommand{\gt}{>}\) \(\newcommand{\amp}{&}\) \(\definecolor{fillinmathshade}{gray}{0.9}\)2.1: Graphs of the Sine and Cosine Functions
For the exercises 1-8, graph the functions for two periods and determine the amplitude or stretching factor, period, midline equation, and asymptotes.
1) \(f(x)=-3\cos x+3\)
- Answer
-
amplitude: \(3\); period: \(2\pi \); midline: \(y=3\)no asymptotes
2) \(f(x)=\dfrac{1}{4}\sin x\)
3) \(f(x)=3\cos\left ( x+\dfrac{\pi }{6} \right )\)
- Answer
-
amplitude: \(3\); period: \(2\pi \); midline: \(y=0\); no asymptotes
4) \(f(x)=-2\sin\left ( x-\dfrac{2\pi }{3} \right )\)
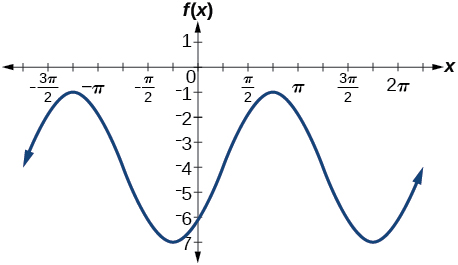
5) \(f(x)=3\sin\left ( x-\dfrac{\pi }{4} \right )-4\)
- Answer
-
amplitude: \(3\); period: \(2\pi \); midline: \(y=-4\); no asymptotes
6) \(f(x)=2\left (\cos\left ( x-\dfrac{4\pi }{3} \right )+1 \right )\)
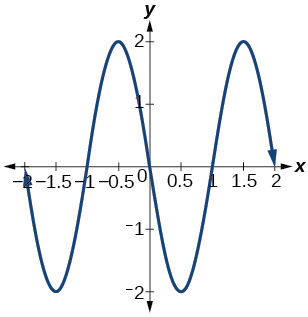
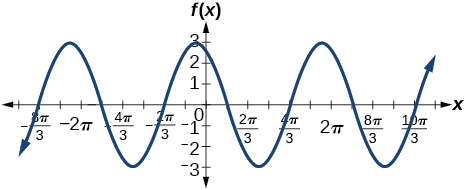
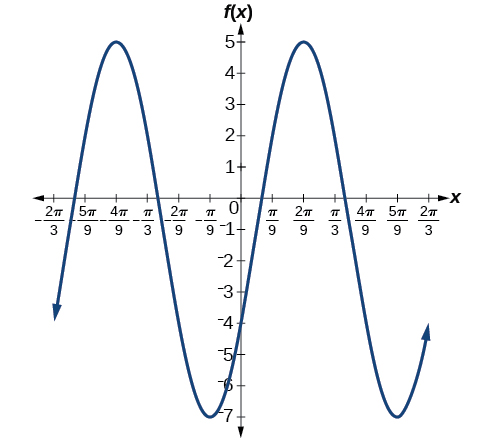
7) \(f(x)=6\sin\left ( 3x-\dfrac{\pi }{6} \right )-1\)
- Answer
-
amplitude: \(6\); period: \(dfrac{2\pi }{3}\); midline: \(y=-1\); no asymptotes
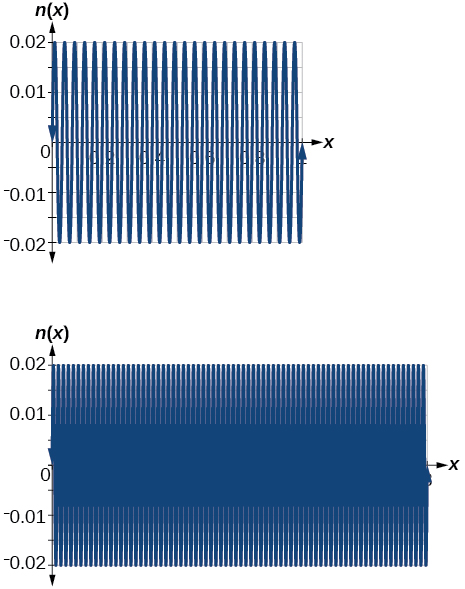
8) \(f(x)=-100\sin(50x-20)\)
2.2: Graphs of the Other Trigonometric Functions
For the exercises 1-4, graph the functions for two periods and determine the amplitude or stretching factor, period, midline equation, and asymptotes.
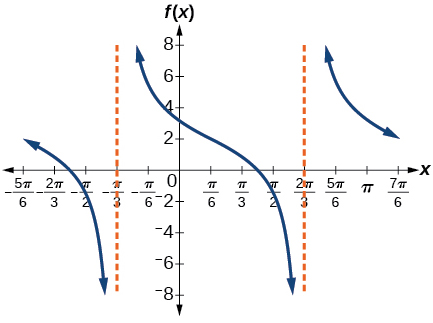
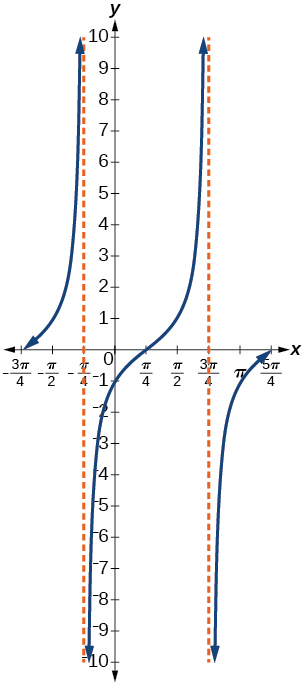
1) \(f(x)=\tan x-4\)
- Answer
-
stretching factor: none; period: \(\pi \)midline: \(y=-4\)asymptotes: \(x=\dfrac{\pi }{2}+\pi k\), where \(k\) is an integer
2) \(f(x)=2\tan \left ( x-\dfrac{\pi }{6} \right )\)
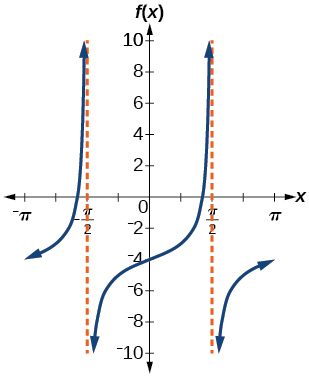
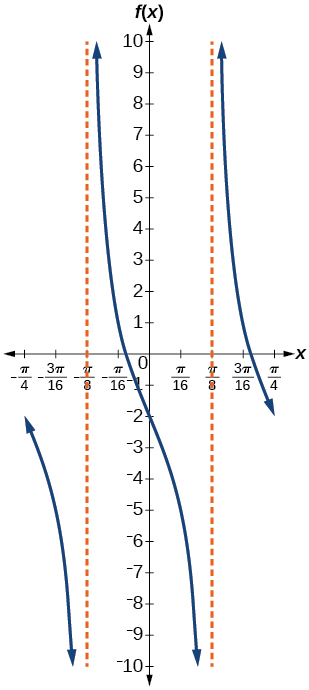
3) \(f(x)=-3\tan (4x)-2\)
- Answer
-
stretching factor: \(3\); period: \(\dfrac{\pi }{4}\); midline: \(y=-2\); asymptotes: \(x=\dfrac{\pi }{8}+\dfrac{\pi }{4}k\), where \(k\) is an integer
4) \(f(x)=0.2\cos(0.1x)+0.3\)
For the exercises 5-10, graph two full periods. Identify the period, the phase shift, the amplitude, and asymptotes.
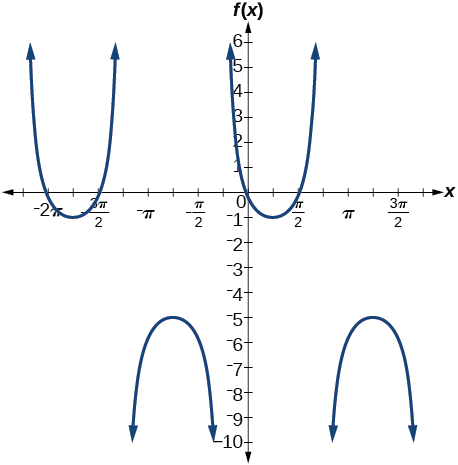
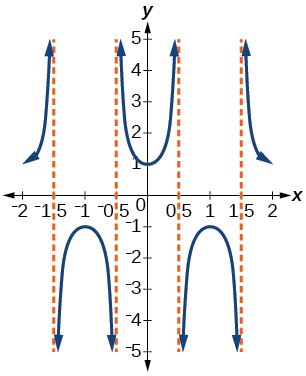
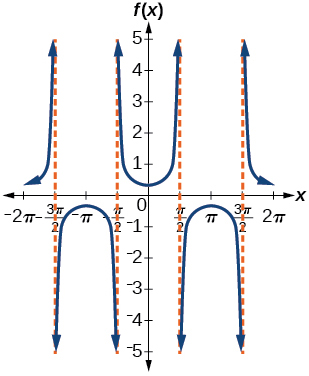
5) \(f(x)=\dfrac{1}{3}\sec x\)
- Answer
-
amplitude: none; period: \(2\pi \); no phase shift; asymptotes: \(x=\dfrac{\pi }{2}k\), where \(k\) is an integer
6) \(f(x)=3\cot x\)
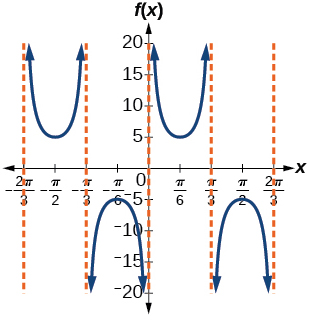
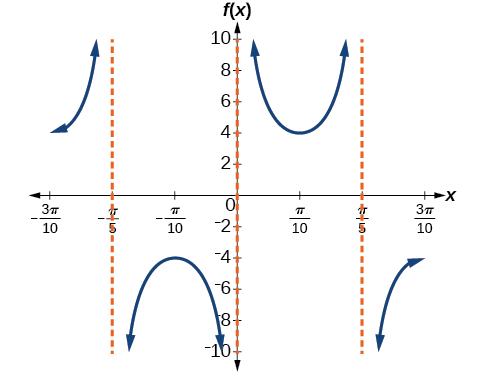
7) \(f(x)=4\csc (5x)\)
- Answer
-
amplitude: none; period: \(\dfrac{2\pi }{5}\); no phase shift; asymptotes: \(x=\dfrac{\pi }{5}k\), where \(k\) is an integer
8) \(f(x)=8\sec \left (\dfrac{1}{4}x \right )\)
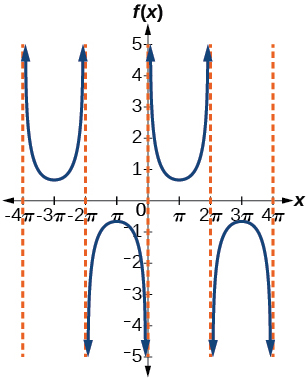
9) \(f(x)=\dfrac{2}{3}\csc \left (\dfrac{1}{2}x \right )\)
- Answer
-
amplitude: none; period: \(4\pi \); no phase shift; asymptotes: \(x=2\pi k\), where \(k\) is an integer
10) \(f(x)=-\csc (2x+\pi)\)
For the exercises 11-15, use this scenario: The population of a city has risen and fallen over a \(20\)-year interval. Its population may be modeled by the following function: \(y=12,000+8,000\sin(0.628x)\), where the domain is the years since 1980 and the range is the population of the city.
11) What is the largest and smallest population the city may have?
- Answer
-
largest: \(20,000\); smallest: \(4,000\)
12) Graph the function on the domain of \([0,40]\).
13) What are the amplitude, period, and phase shift for the function?
- Answer
-
amplitude: \(8,000\); period: \(10\); phase shift: \(0\)
14) Over this domain, when does the population reach \(18,000\)? \(13,000\)?
15) What is the predicted population in 2007? 2010?
- Answer
-
In 2007, the predicted population is \(4,413\). In 2010, the population will be \(11,924\).
For the exercises 16a-16d, suppose a weight is attached to a spring and bobs up and down, exhibiting symmetry.
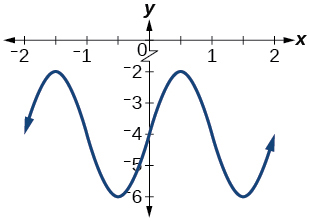
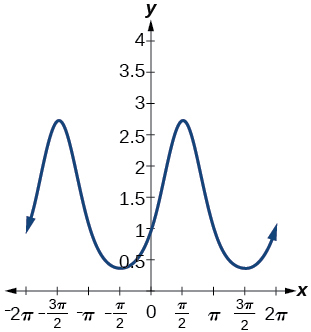
16) Suppose the graph of the displacement function is shown in the Figure below, where the values on the \(x\)-axis represent the time in seconds and the \(y\)-axis represents the displacement in inches.
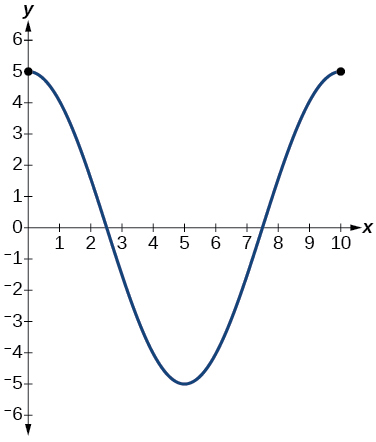
- Give the equation that models the vertical displacement of the weight on the spring.
- At \(\text{time} = 0\), what is the displacement of the weight?
- Answer
-
\(5\) in.
- At what time does the displacement from the equilibrium point equal zero?
- What is the time required for the weight to return to its initial height of \(5\) inches? In other words, what is the period for the displacement function?
- Answer
-
\(10\) seconds
2.3: Inverse Trigonometric Functions
For the exercises 1-11, find the exact value without the aid of a calculator.
1) \(\sin ^{-1}(1)\)
2) \(\cos ^{-1}\left ( \dfrac{\sqrt{3}}{2} \right )\)
- Answer
-
\(\dfrac{\pi }{6}\)
3) \(\tan ^{-1}(-1)\)
4) \(\cos ^{-1}\left ( \dfrac{1}{\sqrt{2}} \right )\)
- Answer
-
\(\dfrac{\pi }{4}\)
5) \(\sin ^{-1}\left ( \dfrac{-\sqrt{3}}{2} \right )\)
6) \(\sin ^{-1}\left (\cos \left (\dfrac{\pi }{6} \right ) \right )\)
- Answer
-
\(\dfrac{\pi }{3}\)
7) \(\cos ^{-1}\left (\tan \left (\dfrac{3\pi }{4} \right ) \right )\)
8) \(\sin \left (\sec^{-1} \left (\dfrac{3}{5} \right ) \right )\)
- Answer
-
No solution
9) \(\cot \left (\sin^{-1} \left (\dfrac{3}{5} \right ) \right )\)
10) \(\tan \left (\cos^{-1} \left (\dfrac{5}{13} \right ) \right )\)
- Answer
-
\(\dfrac{12}{5}\)
11) \(\sin \left (\cos^{-1} \left (\dfrac{x}{x+1} \right ) \right )\)
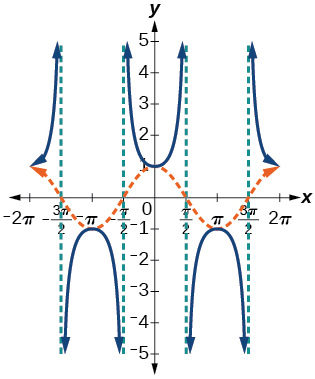
12) Graph \(f(x)=\cos x\) and \(f(x)=\sec x\) on the interval \([0,2\pi )\) and explain any observations.
- Answer
-
The graphs are not symmetrical with respect to the line \(y=x\).They are symmetrical with respect to the \(y\)-axis.
13) Graph \(f(x)=\sin x\) and \(f(x)=\csc x\) and explain any observations.
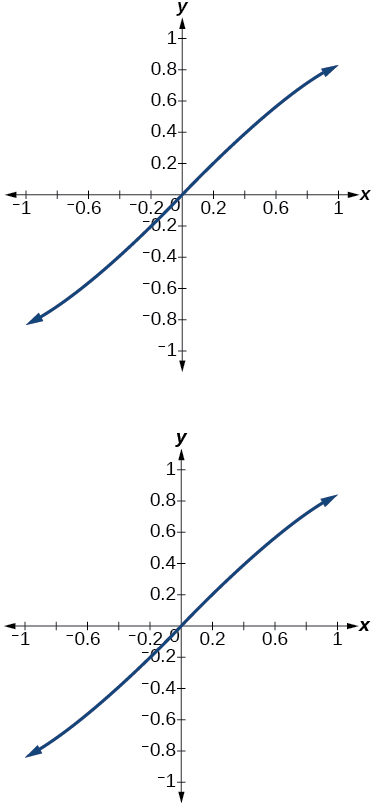
14) Graph the function \(f(x)=\dfrac{x}{1}-\dfrac{x^3}{3!}+\dfrac{x^5}{5!}-\dfrac{x^7}{7!}\) on the interval \([-1,1]\) and compare the graph to the graph of \(f(x)=\sin x\) on the same interval. Describe any observations.
- Answer
-
The graphs appear to be identical.
Practice Test
For the exercises 1-13, sketch the graph of each function for two full periods. Determine the amplitude, the period, and the equation for the midline.
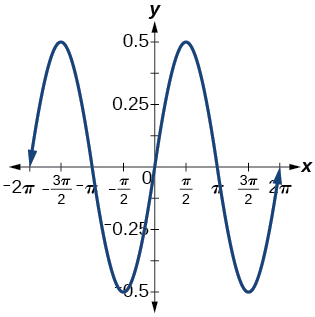
1) \(f(x)=0.5\sin x\)
- Answer
-
amplitude: \(0.5\); period: \(2\pi \)midline \(y=0\)