
14.4: The Normal Distribution
- Page ID
- 97974

The normal distribution is the most important of all the distributions. It is widely used and even more widely abused. Its graph is bell-shaped. You see the bell curve in almost all disciplines. Some of these include psychology, business, economics, the sciences, nursing, and, of course, mathematics. Some of your instructors may use the normal distribution to help determine your grade. Most IQ scores are normally distributed. Often real-estate prices fit a normal distribution. The normal distribution is extremely important, but it cannot be applied to everything in the real world.

In this chapter, you will study the normal distribution, the standard normal distribution, and applications associated with them. The normal distribution has two parameters (two numerical descriptive measures), the mean (\(\mu\)) and the standard deviation (\(\sigma\)).
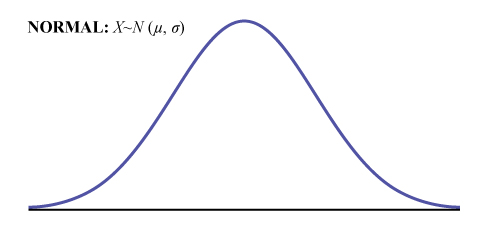
The curve is symmetrical about a vertical line drawn through the mean, \(\mu\). In theory, the mean is the same as the median, because the graph is symmetric about \(\mu\). As the notation indicates, the normal distribution depends only on the mean and the standard deviation. Since the area under the curve must equal one, or 100%, a change in the standard deviation, \(\sigma\), causes a change in the shape of the curve; the curve becomes fatter or skinnier depending on \(\sigma\). A change in \(\mu\) causes the graph to shift to the left or right. This means there are an infinite number of normal probability distributions. One of special interest is called the standard normal distribution.
Z-Scores
The standard normal distribution is a normal distribution of standardized values called z-scores. A z-score is measured in units of the standard deviation.
If \(X\) is a normally distributed random variable with mean \(\mu\) and standard deviation \(\sigma\), then the z-score is:
\(z = \dfrac{x - \mu}{\sigma} \label{zscore}\)
The z-score tells you how many standard deviations the value \(x\) is above (to the right of) or below (to the left of) the mean, \(\mu\). Values of \(x\) that are larger than the mean have positive \(z\)-scores, and values of \(x\) that are smaller than the mean have negative \(z\)-scores. If \(x\) equals the mean, then \(x\) has a \(z\)-score of zero. For example, if the mean of a normal distribution is five and the standard deviation is two, the value 11 is three standard deviations above (or to the right of) the mean. The calculation is as follows:
\( \begin{align*} x &= \mu + (z)(\sigma) \\[5pt] &= 5 + (3)(2) = 11 \end{align*}\)
The z-score is three.
Since the mean for the standard normal distribution is zero and the standard deviation is one, then this transformation produces the standard normal distribution.
Suppose that \(x\) is a normally distributed random variable with mean \(\mu = 5\) and standard deviation \(\sigma = 6\). Suppose \(x = 17\). Then the z-score is \(z = \dfrac{x-\mu}{\sigma} = \dfrac{17-5}{6} = 2 \nonumber\)
This means that \(x = 17\) is two standard deviations (2\(\sigma\)) above or to the right of the mean \(\mu = 5\). The standard deviation is \(\sigma = 6\).
Now suppose \(x = 1\). Then the z-score is \(z = \dfrac{x-\mu}{\sigma} = \dfrac{1-5}{6} = -0.67 \nonumber\) (rounded to two decimal places)
This means that \(x = 1\) is \(0.67\) standard deviations (\(–0.67\sigma\)) below or to the left of the mean \(\mu = 5\).
Summarizing, when \(z\) is positive, \(x\) is above or to the right of \(\mu\) and when \(z\) is negative, \(x\) is to the left of or below \(\mu\). Or, when \(z\) is positive, \(x\) is greater than \(\mu\), and when \(z\) is negative \(x\) is less than \(\mu\).
What is the \(z\)-score of \(x\), when \(x = 1\) and mean \(\mu = 12\) and standard deviation \(\sigma = 3\)?
- Answer
-
\(z = \dfrac{1-12}{3} \approx -3.67\)
Some doctors believe that a person can lose five pounds, on the average \(\mu = 5\), in a month by reducing his or her fat intake and by exercising consistently. Suppose weight loss has a normal distribution. Let \(X =\) the amount of weight lost(in pounds) by a person in a month. Use a standard deviation of two pounds \(\sigma = 2\). Fill in the blanks.
- Suppose a person lost ten pounds in a month. The \(z\)-score when \(x = 10\) pounds is \(x = 2.5\) (verify). This \(z\)-score tells you that \(x = 10\) is ________ standard deviations to the ________ (right or left) of the mean _____ (What is the mean?).
- Suppose a person gained three pounds (a negative weight loss). Then \(z =\) __________. This \(z\)-score tells you that \(x = -3\) is ________ standard deviations to the __________ (right or left) of the mean.
Answers
a. This \(z\)-score tells you that \(x = 10\) is 2.5 standard deviations to the right of the mean five.
b. Then \(z =\dfrac{-3-5}{2} = -4\). This \(z\)-score tells you that \(x = -3\) is 4 standard deviations to the left of the mean five.
Fill in the blanks.
Jerome averages 16 points a game, \(\mu = 16\), with a standard deviation of four points, \(\sigma = 4\). Suppose Jerome scores ten points in a game. The \(z\)–score when \(x = 10\) is \(-1.5\). This score tells you that \(x = 10\) is _____ standard deviations to the ______(right or left) of the mean______(What is the mean?).
- Answer
-
1.5, left, 16
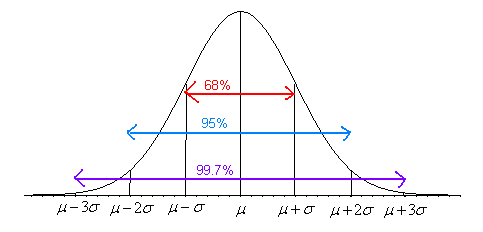
The Empirical Rule (68-95-99.7 Rule)
If \(X\) is a random variable and has a normal distribution with mean \(\mu\) and standard deviation \(\sigma\), then the Empirical Rule says the following:
- About 68% of the \(x\) values lie between –1\(\sigma\) and +1\(\sigma\) of the mean \(\mu\) (within one standard deviation of the mean).
- About 95% of the \(x\) values lie between –2\(\sigma\) and +2\(\sigma\) of the mean \(\mu\) (within two standard deviations of the mean).
- About 99.7% of the \(x\) values lie between –3\(\sigma\) and +3\(\sigma\) of the mean \(\mu\) (within three standard deviations of the mean). Notice that almost all the \(x\) values lie within three standard deviations of the mean.
- The \(z\)-scores for +1\(\sigma\) and –1\(\sigma\) are +1 and –1, respectively.
- The \(z\)-scores for +2\(\sigma\) and –2\(\sigma\) are +2 and –2, respectively.
- The \(z\)-scores for +3\(\sigma\) and –3\(\sigma\) are +3 and –3 respectively.
Suppose x has a normal distribution with mean 50 and standard deviation 6.
- About 68% of the x values lie within one standard deviation of the mean. Therefore, about 68% of the x values lie between –1σ = (–1)(6) = –6 and 1σ = (1)(6) = 6 of the mean 50. The values 50 – 6 = 44 and 50 + 6 = 56 are within one standard deviation from the mean 50. The z-scores are –1 and +1 for 44 and 56, respectively.
- About 95% of the x values lie within two standard deviations of the mean. Therefore, about 95% of the x values lie between –2σ = (–2)(6) = –12 and 2σ = (2)(6) = 12. The values 50 – 12 = 38 and 50 + 12 = 62 are within two standard deviations from the mean 50. The z-scores are –2 and +2 for 38 and 62, respectively.
- About 99.7% of the x values lie within three standard deviations of the mean. Therefore, about 99.7% of the x values lie between –3σ = (–3)(6) = –18 and 3σ = (3)(6) = 18 from the mean 50. The values 50 – 18 = 32 and 50 + 18 = 68 are within three standard deviations of the mean 50. The z-scores are –3 and +3 for 32 and 68, respectively.
Suppose \(X\) has a normal distribution with mean 25 and standard deviation five. Between what values of \(x\) do 68% of the values lie?
- Answer
-
between 20 and 30.
From 1984 to 1985, the mean height of 15 to 18-year-old males from Chile was 172.36 cm, and the standard deviation was 6.34 cm. Let \(Y =\) the height of 15 to 18-year-old males in 1984 to 1985.
- About 68% of the \(y\) values lie between what two values? These values are ________________. The \(z\)-scores are ________________, respectively.
- About 95% of the \(y\) values lie between what two values? These values are ________________. The \(z\)-scores are ________________ respectively.
- About 99.7% of the \(y\) values lie between what two values? These values are ________________. The \(z\)-scores are ________________, respectively.
Answer
- About 68% of the values lie between 166.02 and 178.7. The \(z\)-scores are –1 and 1.
- About 95% of the values lie between 159.68 and 185.04. The \(z\)-scores are –2 and 2.
- About 99.7% of the values lie between 153.34 and 191.38. The \(z\)-scores are –3 and 3.
The scores on a college entrance exam have an approximate normal distribution with mean, \(\mu = 52\) points and a standard deviation, \(\sigma = 11\) points.
- About 68% of the \(y\) values lie between what two values? These values are ________________. The \(z\)-scores are ________________, respectively.
- About 95% of the \(y\) values lie between what two values? These values are ________________. The \(z\)-scores are ________________, respectively.
- About 99.7% of the \(y\) values lie between what two values? These values are ________________. The \(z\)-scores are ________________, respectively.
- Answer a
-
About 68% of the values lie between the values 41 and 63. The \(z\)-scores are –1 and 1, respectively.
- Answer b
-
About 95% of the values lie between the values 30 and 74. The \(z\)-scores are –2 and 2, respectively.
- Answer c
-
About 99.7% of the values lie between the values 19 and 85. The \(z\)-scores are –3 and 3, respectively.