
2.3: Graphing Linear Equations
- Page ID
- 51448
\( \newcommand{\vecs}[1]{\overset { \scriptstyle \rightharpoonup} {\mathbf{#1}} } \)
\( \newcommand{\vecd}[1]{\overset{-\!-\!\rightharpoonup}{\vphantom{a}\smash {#1}}} \)
\( \newcommand{\dsum}{\displaystyle\sum\limits} \)
\( \newcommand{\dint}{\displaystyle\int\limits} \)
\( \newcommand{\dlim}{\displaystyle\lim\limits} \)
\( \newcommand{\id}{\mathrm{id}}\) \( \newcommand{\Span}{\mathrm{span}}\)
( \newcommand{\kernel}{\mathrm{null}\,}\) \( \newcommand{\range}{\mathrm{range}\,}\)
\( \newcommand{\RealPart}{\mathrm{Re}}\) \( \newcommand{\ImaginaryPart}{\mathrm{Im}}\)
\( \newcommand{\Argument}{\mathrm{Arg}}\) \( \newcommand{\norm}[1]{\| #1 \|}\)
\( \newcommand{\inner}[2]{\langle #1, #2 \rangle}\)
\( \newcommand{\Span}{\mathrm{span}}\)
\( \newcommand{\id}{\mathrm{id}}\)
\( \newcommand{\Span}{\mathrm{span}}\)
\( \newcommand{\kernel}{\mathrm{null}\,}\)
\( \newcommand{\range}{\mathrm{range}\,}\)
\( \newcommand{\RealPart}{\mathrm{Re}}\)
\( \newcommand{\ImaginaryPart}{\mathrm{Im}}\)
\( \newcommand{\Argument}{\mathrm{Arg}}\)
\( \newcommand{\norm}[1]{\| #1 \|}\)
\( \newcommand{\inner}[2]{\langle #1, #2 \rangle}\)
\( \newcommand{\Span}{\mathrm{span}}\) \( \newcommand{\AA}{\unicode[.8,0]{x212B}}\)
\( \newcommand{\vectorA}[1]{\vec{#1}} % arrow\)
\( \newcommand{\vectorAt}[1]{\vec{\text{#1}}} % arrow\)
\( \newcommand{\vectorB}[1]{\overset { \scriptstyle \rightharpoonup} {\mathbf{#1}} } \)
\( \newcommand{\vectorC}[1]{\textbf{#1}} \)
\( \newcommand{\vectorD}[1]{\overrightarrow{#1}} \)
\( \newcommand{\vectorDt}[1]{\overrightarrow{\text{#1}}} \)
\( \newcommand{\vectE}[1]{\overset{-\!-\!\rightharpoonup}{\vphantom{a}\smash{\mathbf {#1}}}} \)
\( \newcommand{\vecs}[1]{\overset { \scriptstyle \rightharpoonup} {\mathbf{#1}} } \)
\(\newcommand{\longvect}{\overrightarrow}\)
\( \newcommand{\vecd}[1]{\overset{-\!-\!\rightharpoonup}{\vphantom{a}\smash {#1}}} \)
\(\newcommand{\avec}{\mathbf a}\) \(\newcommand{\bvec}{\mathbf b}\) \(\newcommand{\cvec}{\mathbf c}\) \(\newcommand{\dvec}{\mathbf d}\) \(\newcommand{\dtil}{\widetilde{\mathbf d}}\) \(\newcommand{\evec}{\mathbf e}\) \(\newcommand{\fvec}{\mathbf f}\) \(\newcommand{\nvec}{\mathbf n}\) \(\newcommand{\pvec}{\mathbf p}\) \(\newcommand{\qvec}{\mathbf q}\) \(\newcommand{\svec}{\mathbf s}\) \(\newcommand{\tvec}{\mathbf t}\) \(\newcommand{\uvec}{\mathbf u}\) \(\newcommand{\vvec}{\mathbf v}\) \(\newcommand{\wvec}{\mathbf w}\) \(\newcommand{\xvec}{\mathbf x}\) \(\newcommand{\yvec}{\mathbf y}\) \(\newcommand{\zvec}{\mathbf z}\) \(\newcommand{\rvec}{\mathbf r}\) \(\newcommand{\mvec}{\mathbf m}\) \(\newcommand{\zerovec}{\mathbf 0}\) \(\newcommand{\onevec}{\mathbf 1}\) \(\newcommand{\real}{\mathbb R}\) \(\newcommand{\twovec}[2]{\left[\begin{array}{r}#1 \\ #2 \end{array}\right]}\) \(\newcommand{\ctwovec}[2]{\left[\begin{array}{c}#1 \\ #2 \end{array}\right]}\) \(\newcommand{\threevec}[3]{\left[\begin{array}{r}#1 \\ #2 \\ #3 \end{array}\right]}\) \(\newcommand{\cthreevec}[3]{\left[\begin{array}{c}#1 \\ #2 \\ #3 \end{array}\right]}\) \(\newcommand{\fourvec}[4]{\left[\begin{array}{r}#1 \\ #2 \\ #3 \\ #4 \end{array}\right]}\) \(\newcommand{\cfourvec}[4]{\left[\begin{array}{c}#1 \\ #2 \\ #3 \\ #4 \end{array}\right]}\) \(\newcommand{\fivevec}[5]{\left[\begin{array}{r}#1 \\ #2 \\ #3 \\ #4 \\ #5 \\ \end{array}\right]}\) \(\newcommand{\cfivevec}[5]{\left[\begin{array}{c}#1 \\ #2 \\ #3 \\ #4 \\ #5 \\ \end{array}\right]}\) \(\newcommand{\mattwo}[4]{\left[\begin{array}{rr}#1 \amp #2 \\ #3 \amp #4 \\ \end{array}\right]}\) \(\newcommand{\laspan}[1]{\text{Span}\{#1\}}\) \(\newcommand{\bcal}{\cal B}\) \(\newcommand{\ccal}{\cal C}\) \(\newcommand{\scal}{\cal S}\) \(\newcommand{\wcal}{\cal W}\) \(\newcommand{\ecal}{\cal E}\) \(\newcommand{\coords}[2]{\left\{#1\right\}_{#2}}\) \(\newcommand{\gray}[1]{\color{gray}{#1}}\) \(\newcommand{\lgray}[1]{\color{lightgray}{#1}}\) \(\newcommand{\rank}{\operatorname{rank}}\) \(\newcommand{\row}{\text{Row}}\) \(\newcommand{\col}{\text{Col}}\) \(\renewcommand{\row}{\text{Row}}\) \(\newcommand{\nul}{\text{Nul}}\) \(\newcommand{\var}{\text{Var}}\) \(\newcommand{\corr}{\text{corr}}\) \(\newcommand{\len}[1]{\left|#1\right|}\) \(\newcommand{\bbar}{\overline{\bvec}}\) \(\newcommand{\bhat}{\widehat{\bvec}}\) \(\newcommand{\bperp}{\bvec^\perp}\) \(\newcommand{\xhat}{\widehat{\xvec}}\) \(\newcommand{\vhat}{\widehat{\vvec}}\) \(\newcommand{\uhat}{\widehat{\uvec}}\) \(\newcommand{\what}{\widehat{\wvec}}\) \(\newcommand{\Sighat}{\widehat{\Sigma}}\) \(\newcommand{\lt}{<}\) \(\newcommand{\gt}{>}\) \(\newcommand{\amp}{&}\) \(\definecolor{fillinmathshade}{gray}{0.9}\)Learning Objectives
- Graph an Equation Using Ordered Pairs
- Create a table of ordered pairs from a two-variable linear equation
- Graph a two-variable linear equation using a table of ordered pairs
- Determine whether an ordered pair is a solution of an equation
- Graph Linear Equations in Different Forms
- Solve for y, then graph a two-variable linear equation
- Graph horizontal and vertical lines
- Graph an Equation Using Intercepts
- Recognize when an ordered pair is a y-intercept or an x-intercept
- Graph a linear equation using x– and y-intercepts
Graphing Using Ordered Pairs
Graphing ordered pairs is only the beginning of the story. Once you know how to place points on a grid, you can use them to make sense of all kinds of mathematical relationships.
You can use a coordinate plane to plot points and to map various relationships, such as the relationship between an object’s distance and the elapsed time. Many mathematical relationships are linear relationships. Let’s look at what a linear relationship is.
Plotting points to graph linear relationships
A linear relationship is a relationship between variables such that when plotted on a coordinate plane, the points lie on a line. Let’s start by looking at a series of points in Quadrant I on the coordinate plane.
Look at the five ordered pairs (and their x– and y-coordinates) below. Do you see any pattern to the location of the points? If this pattern continued, what other points could be on the line?
You probably identified that if this pattern continued the next ordered pair would be at (5, 10). This makes sense because the point (5, 10) “lines up” with the other points in the series—it is literally on the same line as the others. Applying the same logic, you may identify that the ordered pairs (6, 12) and (7, 14) would also belong if this coordinate plane were larger; they, too, will line up with the other points.
These series of points can also be represented in a table. In the table below, the x- and y-coordinates of each ordered pair on the graph is recorded.
| x-coordinate | y-coordinate |
| 0 | 0 |
| 1 | 2 |
| 2 | 4 |
| 3 | 6 |
| 4 | 8 |
Notice that each y-coordinate is twice the corresponding x-value. All of these x- and y-values follow the same pattern, and, when placed on a coordinate plane, they all line up.

Once you know the pattern that relates the x- and y-values, you can find a y-value for any x-value that lies on the line. So if the rule of this pattern is that each y-coordinate is twice the corresponding x-value, then the ordered pairs (1.5, 3), (2.5, 5), and (3.5, 7) should all appear on the line too, correct? Look to see what happens.
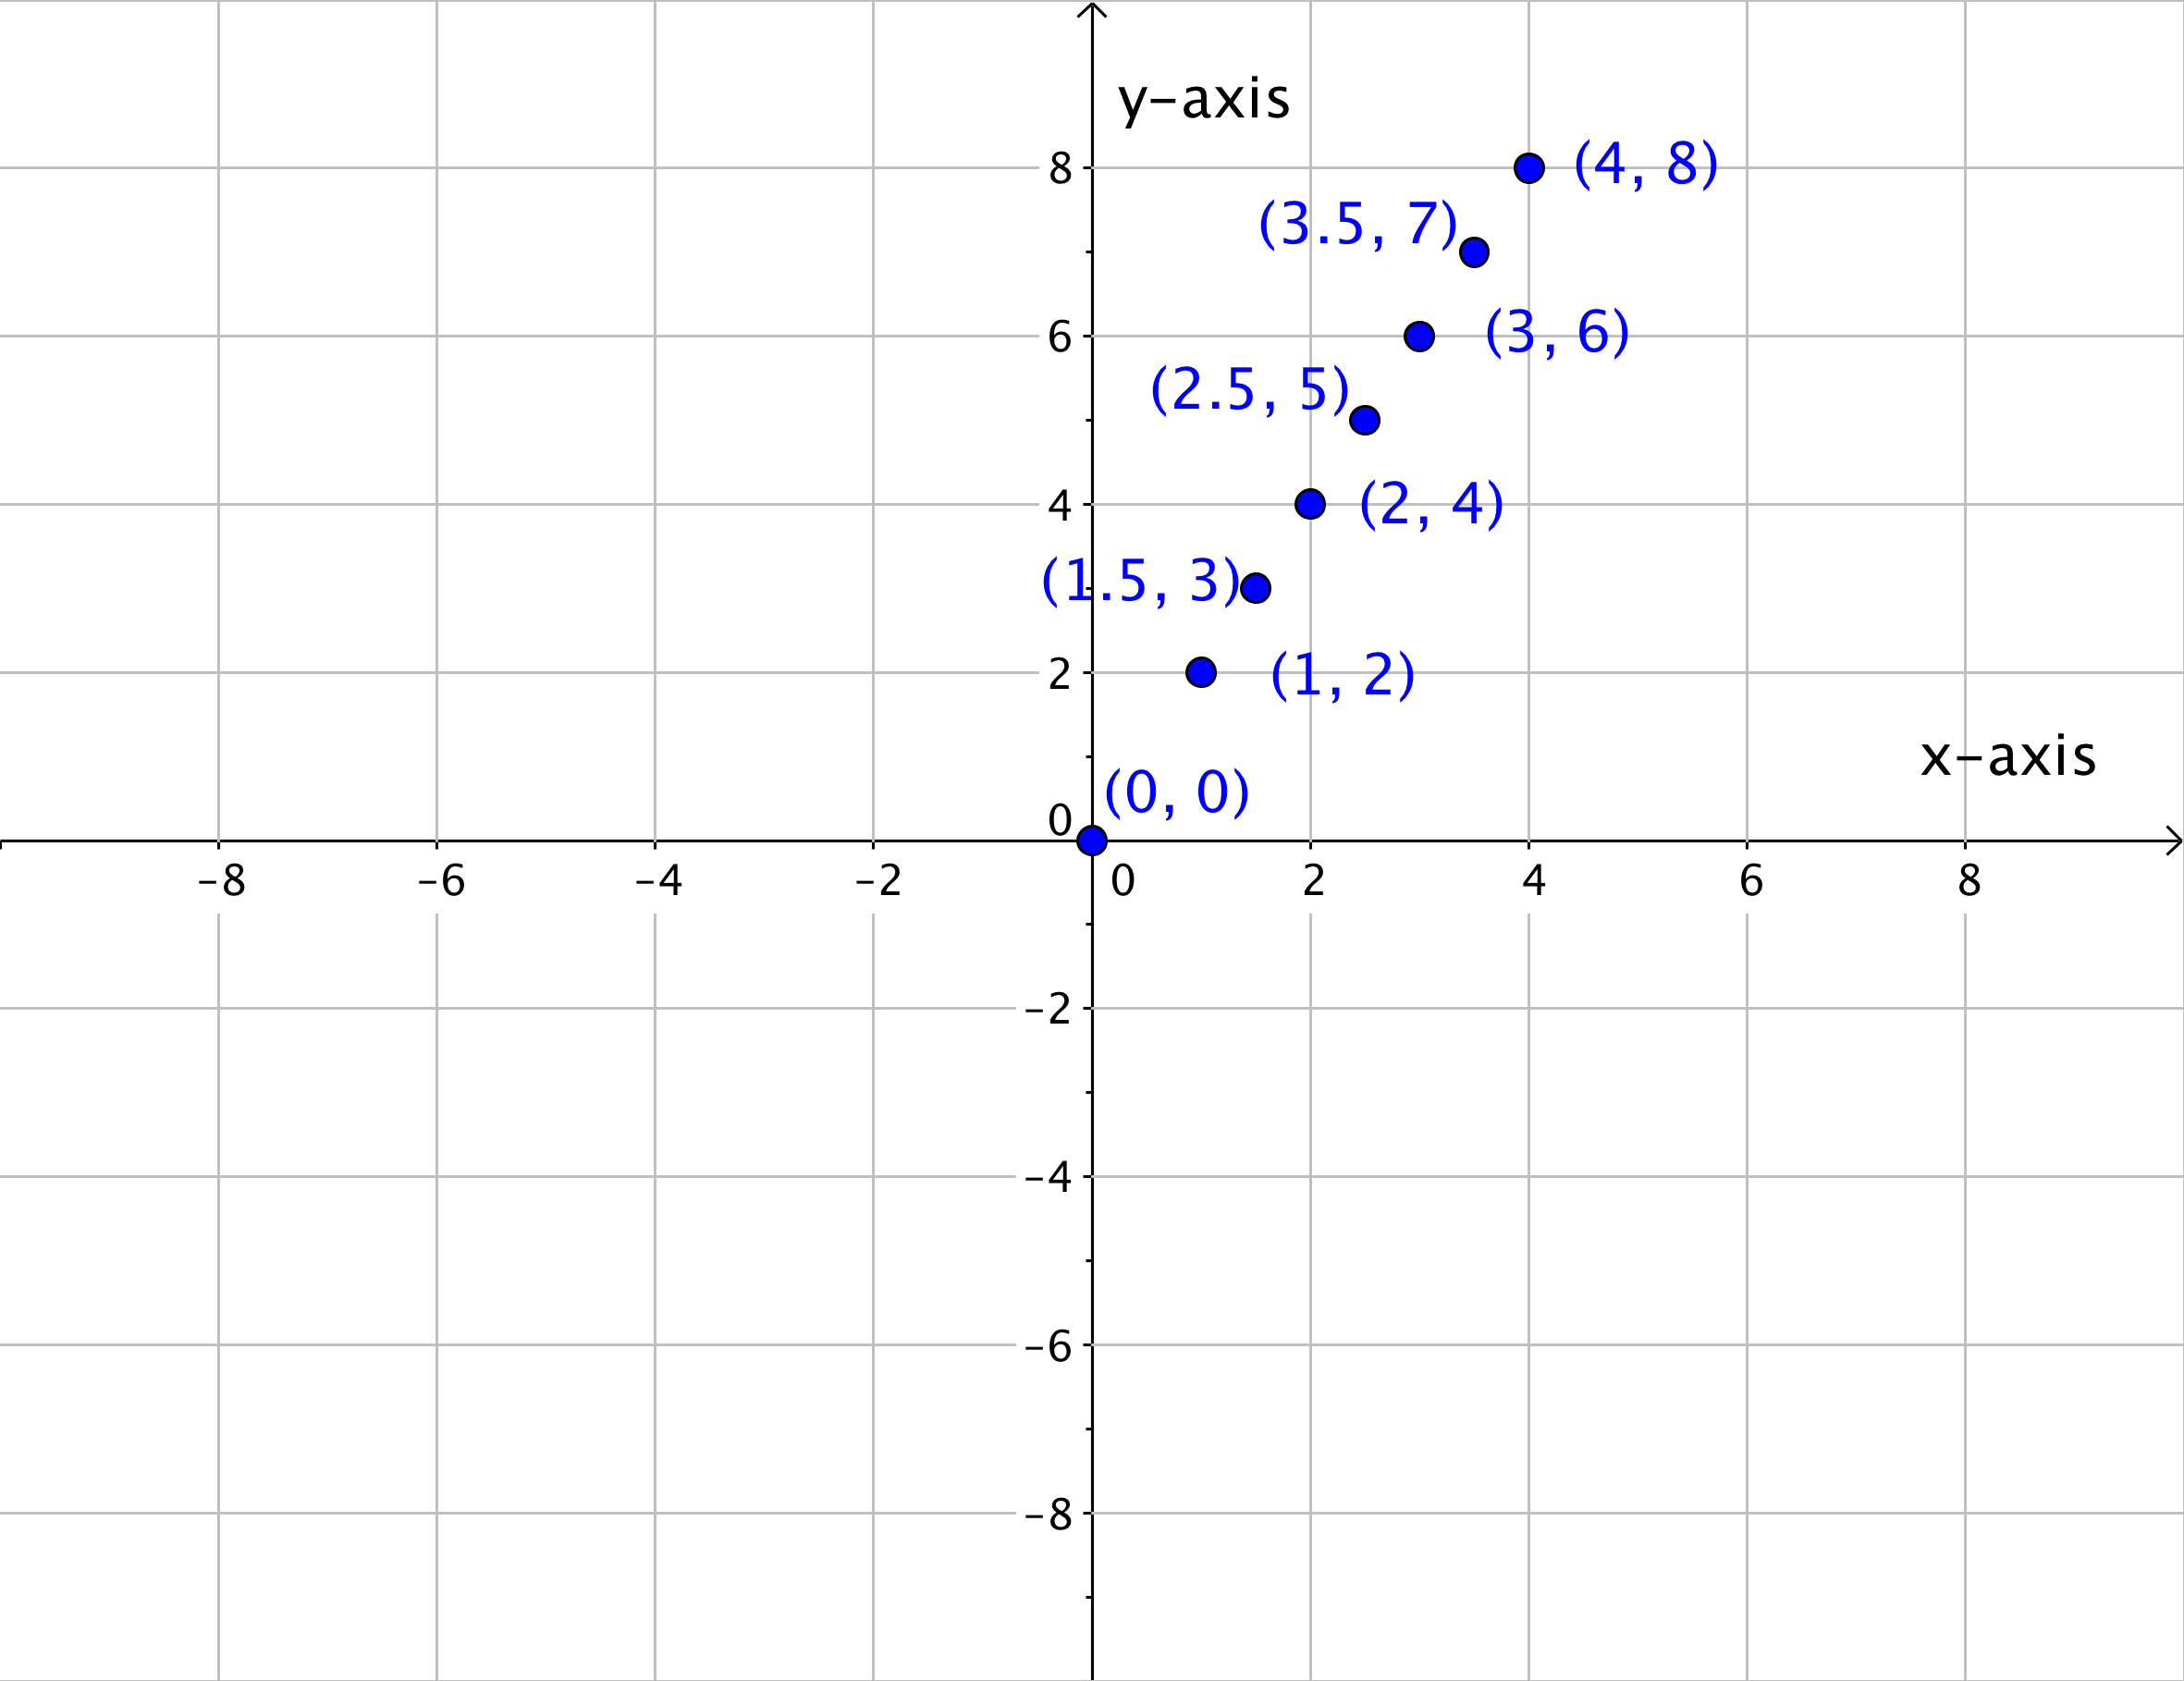
If you were to keep adding ordered pairs (x, y) where the y-value was twice the x-value, you would end up with a graph like this.
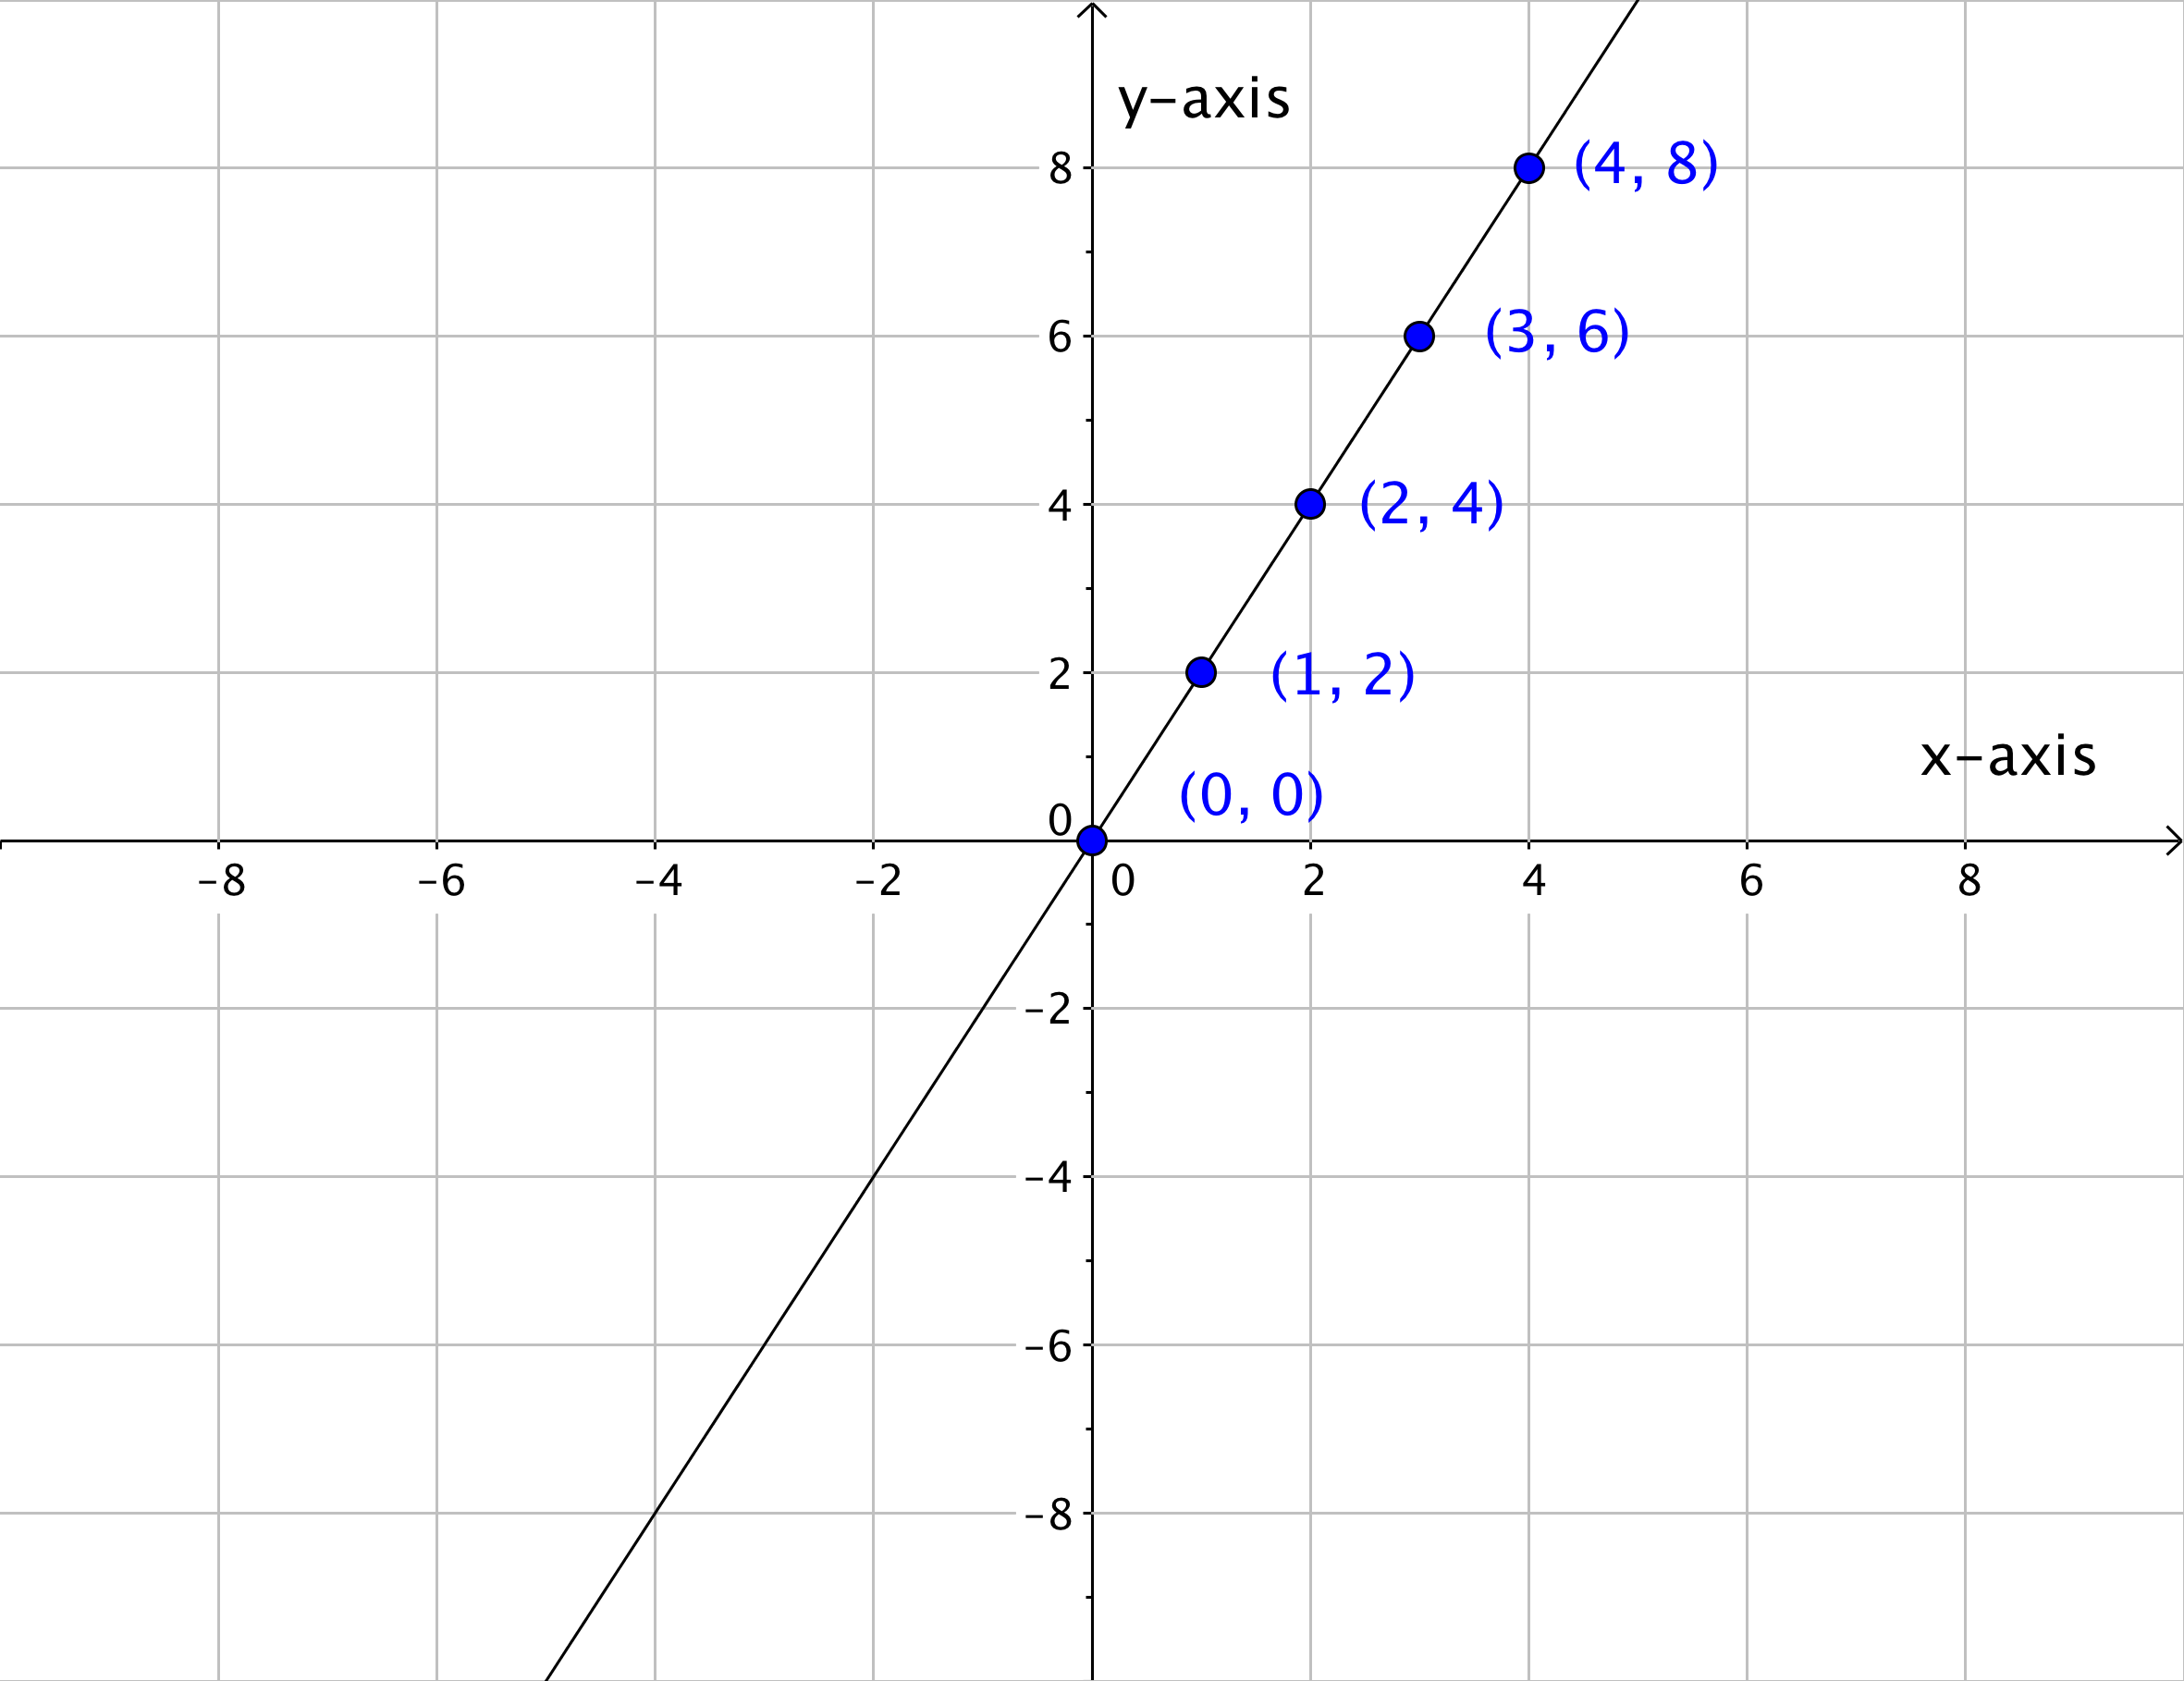
Look at how all of the points blend together to create a line. You can think of a line, then, as a collection of an infinite number of individual points that share the same mathematical relationship. In this case, the relationship is that the y-value is twice the x-value.
There are multiple ways to represent a linear relationship—a table, a linear graph, and there is also a linear equation. A linear equation is an equation with two variables whose ordered pairs graph as a straight line.
There are several ways to create a graph from a linear equation. One way is to create a table of values for x and y, and then plot these ordered pairs on the coordinate plane. Two points are enough to determine a line. However, it’s always a good idea to plot more than two points to avoid possible errors.
Then you draw a line through the points to show all of the points that are on the line. The arrows at each end of the graph indicate that the line continues endlessly in both directions. Every point on this line is a solution to the linear equation.
Example
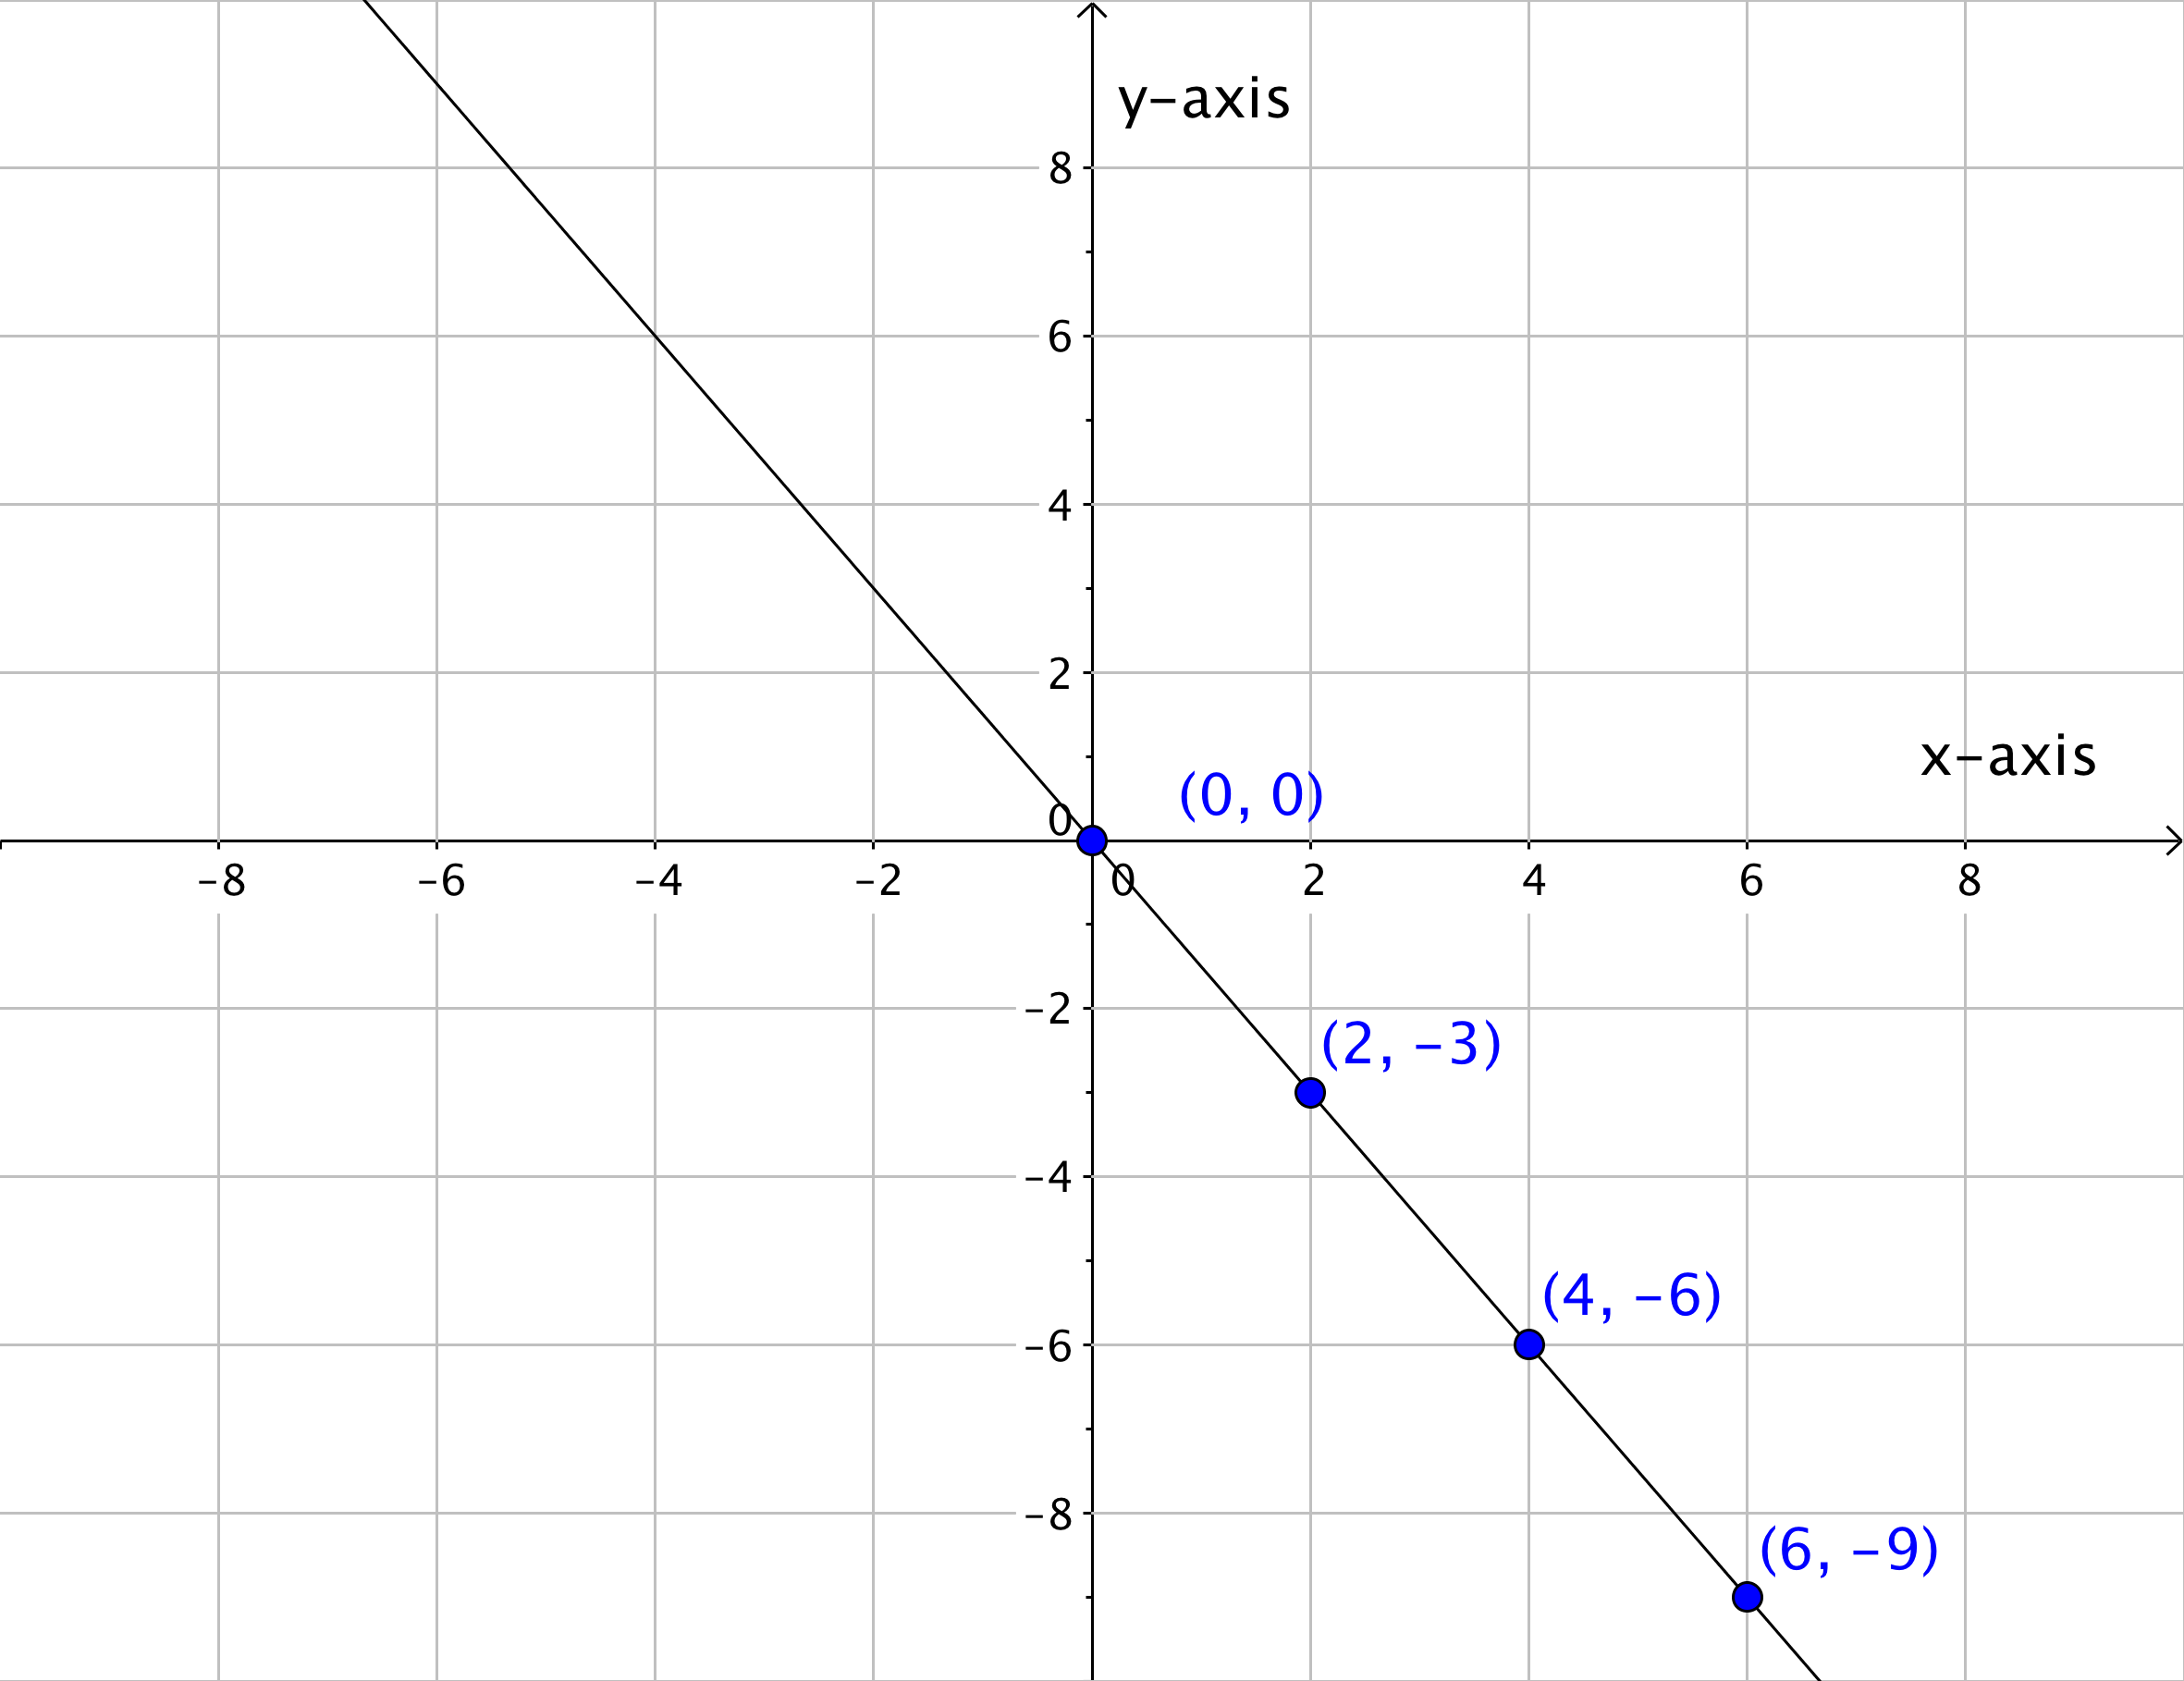
Graph the linear equation \(y=−1.5x\).
[reveal-answer q=”983342″]Show Solution[/reveal-answer]
[hidden-answer a=”983342″]Evaluate \(y=−1.5x\) for different values of x, and create a table of corresponding x and y values.
| x values | \(0\) | \(0\) |
| \(−1.5(2)\) | \(4\) | \(−6\) |
| \(−1.5(6)\) | \(−9\) |
Since the coefficient of x is \(−1.5\), it is convenient to choose multiples of 2 for x. This ensures that y is an integer, and makes the line easier to graph.
Convert the table to ordered pairs. Then plot the ordered pairs.
\((0,0)\)
\((2,−3)\)
\((4,−6)\)
\((6,−9)\)
Draw a line through the points to indicate all of the points on the line.
Answer
 [/hidden-answer]
Graph the linear equation

A YouTube element has been excluded from this version of the text. You can view it online here: pb.libretexts.org/ba/?p=64
Example
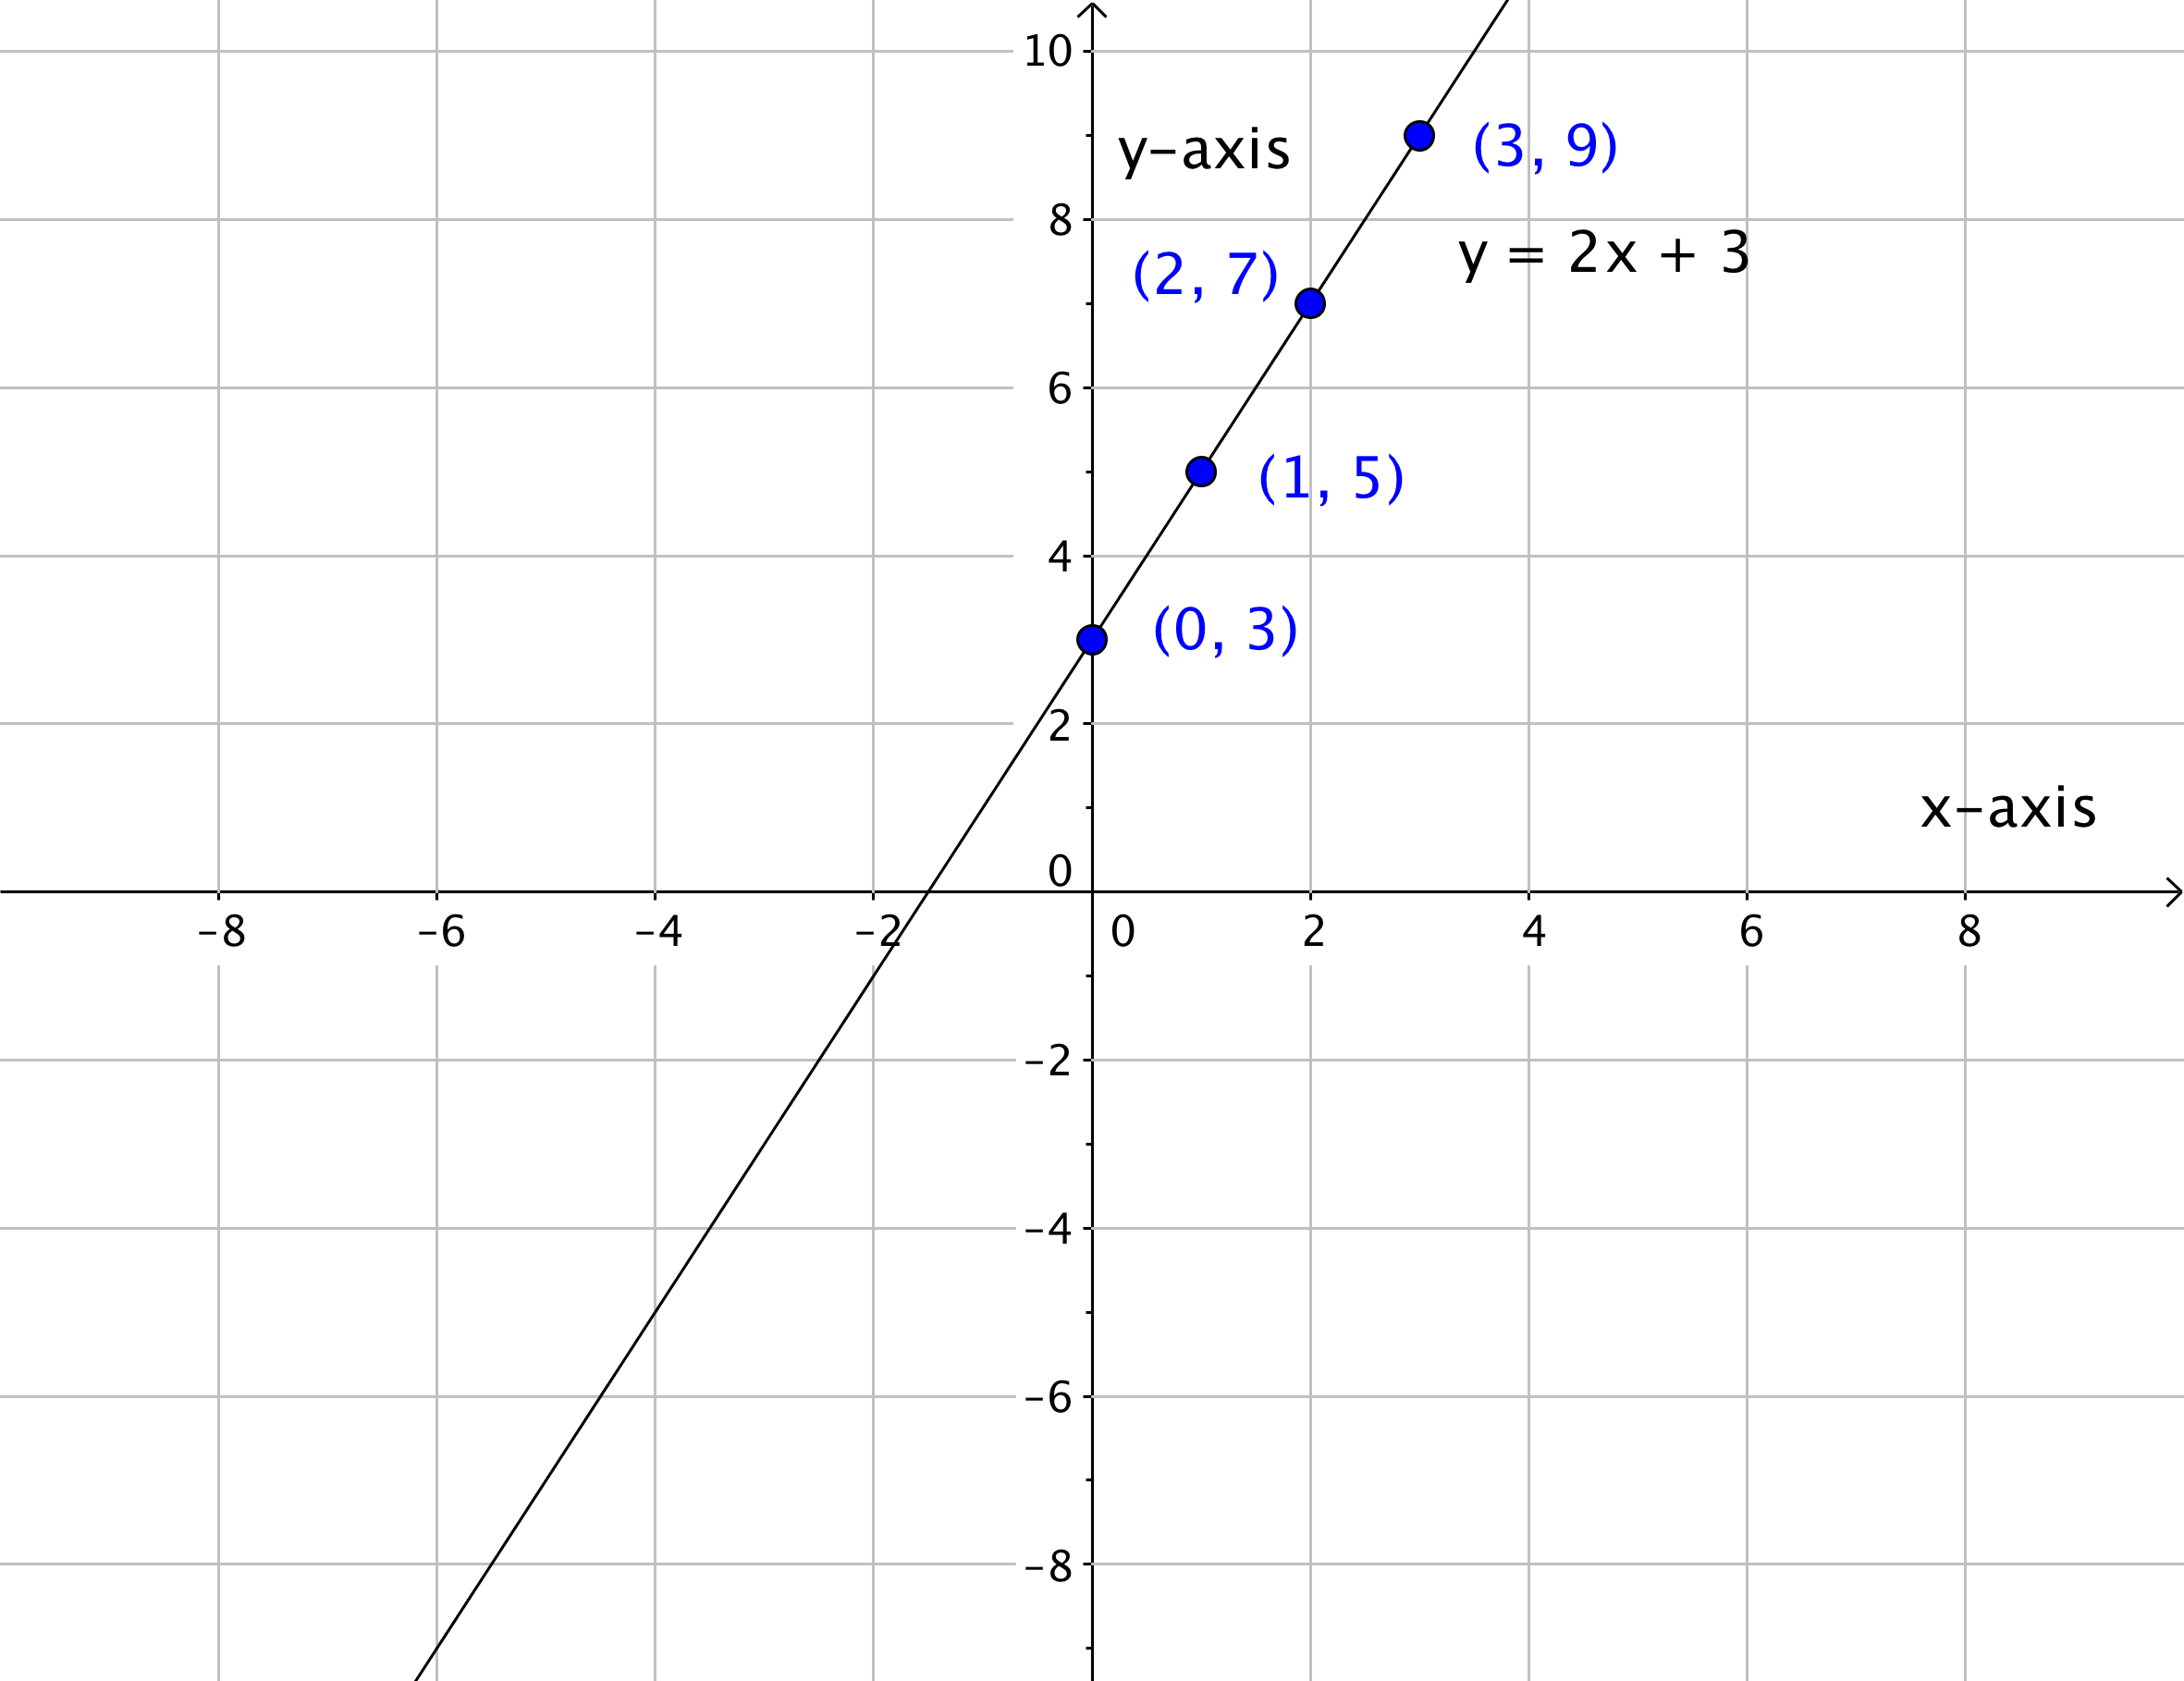
Graph the linear equation \(y=2x+3\).
[reveal-answer q=”834421″]Show Solution[/reveal-answer]
[hidden-answer a=”834421″]Evaluate \(y=2x+3\) for different values of x, and create a table of corresponding x and y values.
| x values | \(2x+3\) | y values |
| 0 | 2(0) + 3 | 3 |
| 1 | 2(1) + 3 | 5 |
| 2 | 2(2) + 3 | 7 |
| 3 | 2(3) + 3 | 9 |
(0, 3)
(1, 5)
(2, 7)
(3, 9)
Convert the table to ordered pairs. Plot the ordered pairs.

Draw a line through the points to indicate all of the points on the line.
Answer
 [/hidden-answer]
Ordered Pairs as Solutions
So far, you have considered the following ideas about lines: a line is a visual representation of a linear equation, and the line itself is made up of an infinite number of points (or ordered pairs). The picture below shows the line of the linear equation \(y=2x–5\) with some of the specific points on the line.
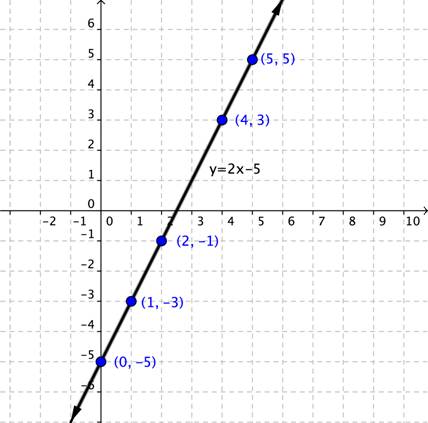
Every point on the line is a solution to the equation \((1,−3)\).
\(\begin{array}{l}\,\,\,\,y=2x-5\\-3=2\left(1\right)-5\\-3=2-5\\-3=-3\\\text{This is true.}\end{array}\)
You can also try ANY of the other points on the line. Every point on the line is a solution to the equation \(y=2x–5\). All this means is that determining whether an ordered pair is a solution of an equation is pretty straightforward. If the ordered pair is on the line created by the linear equation, then it is a solution to the equation. But if the ordered pair is not on the line—no matter how close it may look—then it is not a solution to the equation.
Identifying Solutions
To find out whether an ordered pair is a solution of a linear equation, you can do the following:
- Graph the linear equation, and graph the ordered pair. If the ordered pair appears to be on the graph of a line, then it is a possible solution of the linear equation. If the ordered pair does not lie on the graph of a line, then it is not a solution.
- Substitute the (x, y) values into the equation. If the equation yields a true statement, then the ordered pair is a solution of the linear equation. If the ordered pair does not yield a true statement then it is not a solution.
Example
Determine whether \(4y+5x=3\).
[reveal-answer q=”980260″]Show Solution[/reveal-answer]
[hidden-answer a=”980260″]For this problem, you will use the substitution method. Substitute \(y=4\) into the equation.
\(\begin{array}{r}4y+5x=3\\4\left(4\right)+5\left(−2\right)=3\end{array}\)
Evaluate.
\(\begin{array}{r}16+\left(−10\right)=3\\6=3\end{array}\)
The statement is not true, so \(4y+5x=3\).
Answer
\(4y+5x=3\).[/hidden-answer]
Determine If an Ordered Pair is a Solution to a Linear Equation

A YouTube element has been excluded from this version of the text. You can view it online here: pb.libretexts.org/ba/?p=64
Solve for y, then graph a linear equation
The linear equations we have graphed so far are in the form \(y=mx+b\) where m and b are real numbers. In this section we will graph linear equations that appear in different forms than we have seen.
Example
Graph the linear equation \(y+3x=5\).
[reveal-answer q=”61530″]Show Solution[/reveal-answer]
[hidden-answer a=”61530″]First, solve \(y+3x=5\) for y, then the equation will look familiar and you can create a table of ordered pairs.
\(\begin{array}{r}y+3x-3x=5-3x\\y=5-3x\end{array}\)
Evaluate \(y=5–3x\) for different values of x, and create a table of corresponding x and y values.
| x values | \(0\) | \(5\) |
| \(5–3(1)\) | \(2\) | \(−1\) |
| \(5–3(3)\) | \(−4\) |
Plot the ordered pairs (shown below).
\((0,5)\)
\((1,2)\)
\((2,−1)\)
\((3,−4)\)

Draw a line through the points to indicate all of the points on the line.
Answer
 [/hidden-answer]
Video: Solve for y, then graph a linear equation

A YouTube element has been excluded from this version of the text. You can view it online here: pb.libretexts.org/ba/?p=64
Horizontal and Vertical Lines
The linear equations \(y=−3\) only have one variable in each of them. However, because these are linear equations, then they will graph on a coordinate plane just as the linear equations above do. Just think of the equation \(x=0y+2\) and think of \(y=0x–3\).
Example
Graph \(y=−3\).
[reveal-answer q=”140758″]Show Solution[/reveal-answer]
[hidden-answer a=”140758″]
| x values | \(0\) | \(−3\) |
| \(0(1)–3\) | \(2\) | \(−3\) |
| \(0(3)–3\) | \(−3\) |
Write \(y=0x–3\), and evaluate y when x has several values. Or just realize that \(−3\), no matter what x is.
\((0,−3)\)
\((1,−3)\)
\((2,−3)\)
\((3,−3)\)
Plot the ordered pairs (shown below).

Draw a line through the points to indicate all of the points on the line.
Answer
\(y=−3\) graphs as a horizontal line.[/hidden-answer]
In the following video you will see more examples of graphing horizontal and vertical lines.
")
A YouTube element has been excluded from this version of the text. You can view it online here: pb.libretexts.org/ba/?p=64
Intercepts
The intercepts of a line are the points where the line intercepts, or crosses, the horizontal and vertical axes. To help you remember what “intercept” means, think about the word “intersect.” The two words sound alike and in this case mean the same thing.
The straight line on the graph below intercepts the two coordinate axes. The point where the line crosses the x-axis is called the x-intercept. The y-intercept is the point where the line crosses the y-axis.
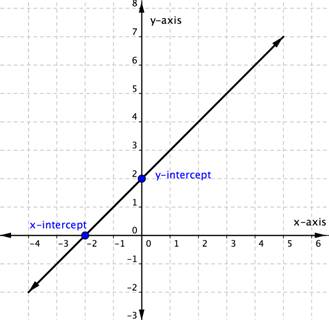
The x-intercept above is the point \((−2,0)\). The y-intercept above is the point (0, 2).
Notice that the y-intercept always occurs where \(y=0\).
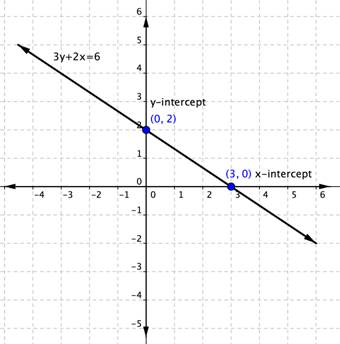
To find the x– and y-intercepts of a linear equation, you can substitute 0 for y and for x respectively.
For example, the linear equation \(y=0\), so \(3\left(0\right)+2x=6\\\).
\(\begin{array}{r}2x=6\\x=3\end{array}\)
The x-intercept is \((3,0)\).
Likewise the y-intercept occurs when \(x=0\).
\(\begin{array}{r}3y+2\left(0\right)=6\\3y=6\\y=2\end{array}\)
The y-intercept is \((0,2)\).
Using Intercepts to Graph Lines
You can use intercepts to graph linear equations. Once you have found the two intercepts, draw a line through them.
Let’s do it with the equation \((0,2)\) and \((3,0)\). That’s all you need to know.
Example
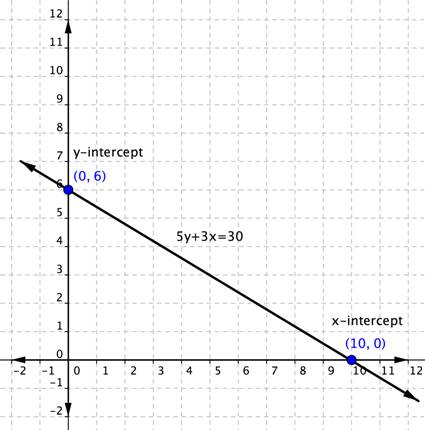
Graph \(5y+3x=30\) using the x and y-intercepts.
[reveal-answer q=”153435″]Show Solution[/reveal-answer]
[hidden-answer a=”153435″]When an equation is in \(Ax+By=C\) form, you can easily find the x– and y-intercepts and then graph.
\(\begin{array}{r}5y+3x=30\\5y+3\left(0\right)=30\\5y+0=30\\5y=30\\y=\,\,\,6\\y\text{-intercept}\,\left(0,6\right)\end{array}\)
To find the y-intercept, set \(x=0\) and solve for y.
\(\begin{array}{r}5y+3x=30\\5\left(0\right)+3x=30\\0+3x=30\\3x=30\\x=10\\x\text{-intercept}\left(10,0\right)\end{array}\)
To find the x-intercept, set \(y=0\) and solve for x.
Answer
 [/hidden-answer]

A YouTube element has been excluded from this version of the text. You can view it online here: pb.libretexts.org/ba/?p=64
Example
Graph \(y=2x-4\) using the x and y-intercepts.
[reveal-answer q=”476848″]Show Solution[/reveal-answer]
[hidden-answer a=”476848″]First, find the y-intercept. Set x equal to zero and solve for y.
\(\begin{array}{l}y=2x-4\\y=2\left(0\right)-4\\y=0-4\\y=-4\\y\text{-intercept}\left(0,-4\right)\end{array}\)
To find the x-intercept, set \(y=0\) and solve for x.
\(\begin{array}{l}y=2x-4\\0=2x-4\\4=2x\\x=2\\x\text{-intercept}\left(2,0\right)\end{array}\)
Answer
make graph for this example[/hidden-answer]
Summary
The coordinate plane is a system for graphing and describing points and lines. The coordinate plane is comprised of a horizontal (x-) axis and a vertical (y-) axis. The intersection of these lines creates the origin, which is the point \((0,0)\). The coordinate plane is split into four quadrants. Together, these features of the coordinate system allow for the graphical representation and communication about points, lines, and other algebraic concepts.
- Determine the Ordered Pairs for Points Plotted on the Coordinate Plane. Authored by: mathispower4u. Located at: https://youtu.be/c9WVU34MY5Q. License: CC BY: Attribution
- Plot Points Given as Ordered Pairs on the Coordinate Plane. Authored by: mathispower4u. Located at: https://youtu.be/p_MESleS3mw. License: CC BY: Attribution
- Graph Basic Linear Equations by Completing a Table of Values. Authored by: James Sousa (Mathispower4u.com) . Located at: https://youtu.be/f5yvGPEWpvE. License: CC BY: Attribution
- Determine If an Ordered Pair is a Solution to a Linear Equation. Authored by: James Sousa (Mathispower4u.com) . Located at: https://youtu.be/9aWGxt7OnB8. License: CC BY: Attribution
- Graph Linear Equations Using Intercepts. Authored by: James Sousa (Mathispower4u.com) . Located at: https://youtu.be/k8r-q_T6UFk. License: CC BY: Attribution
- License: Public Domain: No Known Copyright