
26.6: N1.06- Section 3 Part 1
- Page ID
- 51765
Section 3: Sinusoidal Models
Repeating behavior is very often encountered in the world, with examples such as ocean waves, heartbeats, vibrations of a spring, rotation of wheels, the phases of the moon, and the pattern of the seasons. Because none of the modeling functions we have discussed so far have repeating features, we need something more to be able to model repetitive phenomena.
For most repetitive situations, models based on the same sine function used in trigonometry will serve our needs. This may seem surprising—what do triangles and waves have to do with each other? One reason that mathematics is so powerful is that the same patterns show up in a great variety of different situations, which means that mathematical tools that were developed for one purpose often turn out to be useful in other contexts.
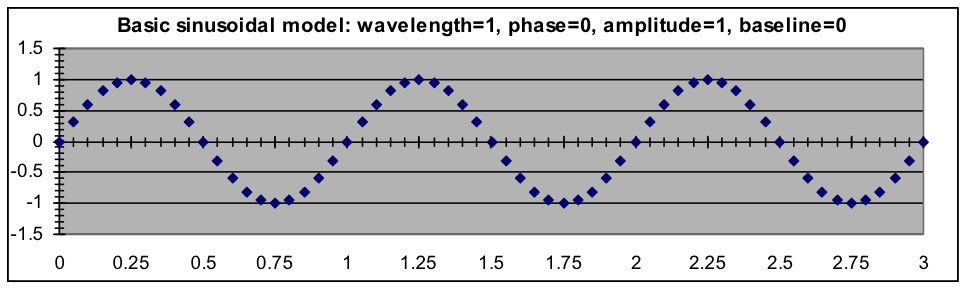
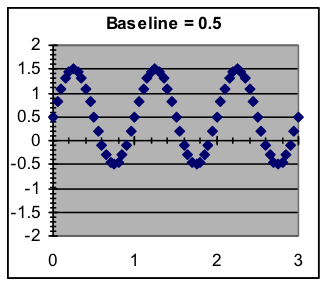
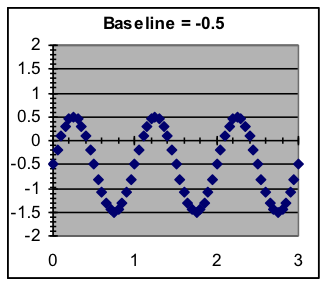
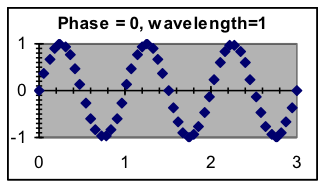
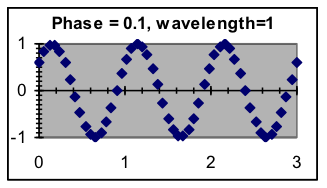
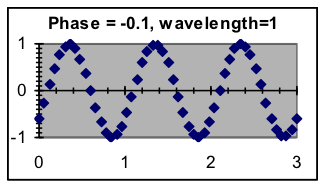
For modeling, we will want to be able to modify the shape of the standard sine function in several ways. First, we want to control how often the pattern repeats—the wavelength—so that we are not limited to the wavelength of the sine function (2π, or about 6.2832). Secondly, we need to be able to shift the pattern to the right or left so that the peaks and valleys of the model match the peaks and valleys of the data—this shift is called the phase of the model. Thirdly, we need to be able to match the amount of up-and-down variation in the model—the amplitude—to the amount of variation in the data. When the average value is not zero, we will also need to add a constant baseline to the model. The mathematical formula that serves these modeling needs will thus make use of four parameters:
If the wavelength, phase, amplitude, and baseline parameters are in G3, G4, G5, and G6, respectively, then the corresponding spreadsheet formula to be put into cell C3 of the model template is:
=$G$5*SIN(6.2832*(A3+$G$4)/$G$3)+$G$6
Summary of sinusoidal parameters
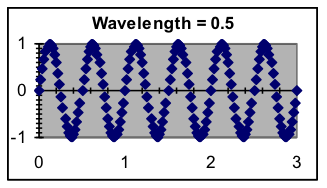
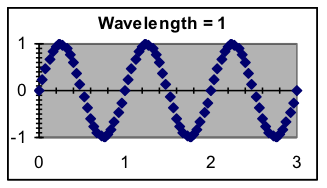
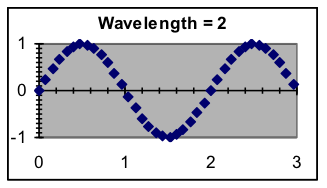
- Wavelength—How often does the pattern repeat? Wavelength is in the same units as the x data, and the ratio of x to the model wavelength is multiplied by 2π because that is the natural wavelength of the SIN function. When the x values are based on time, the wavelength is sometimes referred to as the period or as a cycle of the sinusoid.
- Phase (or phase shift)—Where in the pattern is the x = 0 point? The basic pattern (which has a phase shift of zero) can be shifted to the left or the right. Note that because the pattern repeats, a shift to the left of ¼ wavelength would result in the same pattern as a shift to the right of ¾ wavelength.
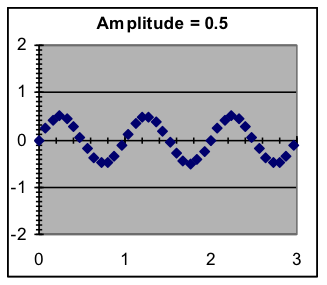
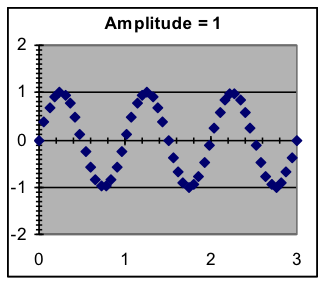
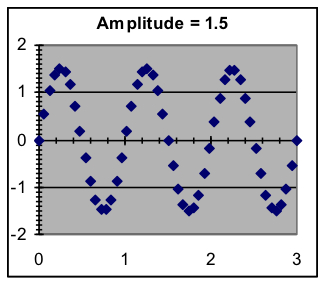
- Amplitude—This is simply a scale factor that determines how far the maximum and minimum y are from the average. While it is mathematically possible to use a negative amplitude (the pattern turns upside down), this is not done since the same effect can be obtained by a half-wavelength phase shift.
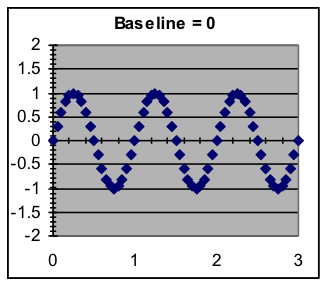
- Baseline—The average around which the pattern varies. This can be modeled by addition to the result of the SIN function after multiplying by the amplitude.
 |  |  |
 |  |  |
 |  |  |
 |  |  |
- Mathematics for Modeling. Authored by: Mary Parker and Hunter Ellinger. License: CC BY: Attribution