
13.1: Functions of Multiple Variables
- Page ID
- 9039

\( \newcommand{\vecs}[1]{\overset { \scriptstyle \rightharpoonup} {\mathbf{#1}} } \)
\( \newcommand{\vecd}[1]{\overset{-\!-\!\rightharpoonup}{\vphantom{a}\smash {#1}}} \)
\( \newcommand{\dsum}{\displaystyle\sum\limits} \)
\( \newcommand{\dint}{\displaystyle\int\limits} \)
\( \newcommand{\dlim}{\displaystyle\lim\limits} \)
\( \newcommand{\id}{\mathrm{id}}\) \( \newcommand{\Span}{\mathrm{span}}\)
( \newcommand{\kernel}{\mathrm{null}\,}\) \( \newcommand{\range}{\mathrm{range}\,}\)
\( \newcommand{\RealPart}{\mathrm{Re}}\) \( \newcommand{\ImaginaryPart}{\mathrm{Im}}\)
\( \newcommand{\Argument}{\mathrm{Arg}}\) \( \newcommand{\norm}[1]{\| #1 \|}\)
\( \newcommand{\inner}[2]{\langle #1, #2 \rangle}\)
\( \newcommand{\Span}{\mathrm{span}}\)
\( \newcommand{\id}{\mathrm{id}}\)
\( \newcommand{\Span}{\mathrm{span}}\)
\( \newcommand{\kernel}{\mathrm{null}\,}\)
\( \newcommand{\range}{\mathrm{range}\,}\)
\( \newcommand{\RealPart}{\mathrm{Re}}\)
\( \newcommand{\ImaginaryPart}{\mathrm{Im}}\)
\( \newcommand{\Argument}{\mathrm{Arg}}\)
\( \newcommand{\norm}[1]{\| #1 \|}\)
\( \newcommand{\inner}[2]{\langle #1, #2 \rangle}\)
\( \newcommand{\Span}{\mathrm{span}}\) \( \newcommand{\AA}{\unicode[.8,0]{x212B}}\)
\( \newcommand{\vectorA}[1]{\vec{#1}} % arrow\)
\( \newcommand{\vectorAt}[1]{\vec{\text{#1}}} % arrow\)
\( \newcommand{\vectorB}[1]{\overset { \scriptstyle \rightharpoonup} {\mathbf{#1}} } \)
\( \newcommand{\vectorC}[1]{\textbf{#1}} \)
\( \newcommand{\vectorD}[1]{\overrightarrow{#1}} \)
\( \newcommand{\vectorDt}[1]{\overrightarrow{\text{#1}}} \)
\( \newcommand{\vectE}[1]{\overset{-\!-\!\rightharpoonup}{\vphantom{a}\smash{\mathbf {#1}}}} \)
\( \newcommand{\vecs}[1]{\overset { \scriptstyle \rightharpoonup} {\mathbf{#1}} } \)
\(\newcommand{\longvect}{\overrightarrow}\)
\( \newcommand{\vecd}[1]{\overset{-\!-\!\rightharpoonup}{\vphantom{a}\smash {#1}}} \)
\(\newcommand{\avec}{\mathbf a}\) \(\newcommand{\bvec}{\mathbf b}\) \(\newcommand{\cvec}{\mathbf c}\) \(\newcommand{\dvec}{\mathbf d}\) \(\newcommand{\dtil}{\widetilde{\mathbf d}}\) \(\newcommand{\evec}{\mathbf e}\) \(\newcommand{\fvec}{\mathbf f}\) \(\newcommand{\nvec}{\mathbf n}\) \(\newcommand{\pvec}{\mathbf p}\) \(\newcommand{\qvec}{\mathbf q}\) \(\newcommand{\svec}{\mathbf s}\) \(\newcommand{\tvec}{\mathbf t}\) \(\newcommand{\uvec}{\mathbf u}\) \(\newcommand{\vvec}{\mathbf v}\) \(\newcommand{\wvec}{\mathbf w}\) \(\newcommand{\xvec}{\mathbf x}\) \(\newcommand{\yvec}{\mathbf y}\) \(\newcommand{\zvec}{\mathbf z}\) \(\newcommand{\rvec}{\mathbf r}\) \(\newcommand{\mvec}{\mathbf m}\) \(\newcommand{\zerovec}{\mathbf 0}\) \(\newcommand{\onevec}{\mathbf 1}\) \(\newcommand{\real}{\mathbb R}\) \(\newcommand{\twovec}[2]{\left[\begin{array}{r}#1 \\ #2 \end{array}\right]}\) \(\newcommand{\ctwovec}[2]{\left[\begin{array}{c}#1 \\ #2 \end{array}\right]}\) \(\newcommand{\threevec}[3]{\left[\begin{array}{r}#1 \\ #2 \\ #3 \end{array}\right]}\) \(\newcommand{\cthreevec}[3]{\left[\begin{array}{c}#1 \\ #2 \\ #3 \end{array}\right]}\) \(\newcommand{\fourvec}[4]{\left[\begin{array}{r}#1 \\ #2 \\ #3 \\ #4 \end{array}\right]}\) \(\newcommand{\cfourvec}[4]{\left[\begin{array}{c}#1 \\ #2 \\ #3 \\ #4 \end{array}\right]}\) \(\newcommand{\fivevec}[5]{\left[\begin{array}{r}#1 \\ #2 \\ #3 \\ #4 \\ #5 \\ \end{array}\right]}\) \(\newcommand{\cfivevec}[5]{\left[\begin{array}{c}#1 \\ #2 \\ #3 \\ #4 \\ #5 \\ \end{array}\right]}\) \(\newcommand{\mattwo}[4]{\left[\begin{array}{rr}#1 \amp #2 \\ #3 \amp #4 \\ \end{array}\right]}\) \(\newcommand{\laspan}[1]{\text{Span}\{#1\}}\) \(\newcommand{\bcal}{\cal B}\) \(\newcommand{\ccal}{\cal C}\) \(\newcommand{\scal}{\cal S}\) \(\newcommand{\wcal}{\cal W}\) \(\newcommand{\ecal}{\cal E}\) \(\newcommand{\coords}[2]{\left\{#1\right\}_{#2}}\) \(\newcommand{\gray}[1]{\color{gray}{#1}}\) \(\newcommand{\lgray}[1]{\color{lightgray}{#1}}\) \(\newcommand{\rank}{\operatorname{rank}}\) \(\newcommand{\row}{\text{Row}}\) \(\newcommand{\col}{\text{Col}}\) \(\renewcommand{\row}{\text{Row}}\) \(\newcommand{\nul}{\text{Nul}}\) \(\newcommand{\var}{\text{Var}}\) \(\newcommand{\corr}{\text{corr}}\) \(\newcommand{\len}[1]{\left|#1\right|}\) \(\newcommand{\bbar}{\overline{\bvec}}\) \(\newcommand{\bhat}{\widehat{\bvec}}\) \(\newcommand{\bperp}{\bvec^\perp}\) \(\newcommand{\xhat}{\widehat{\xvec}}\) \(\newcommand{\vhat}{\widehat{\vvec}}\) \(\newcommand{\uhat}{\widehat{\uvec}}\) \(\newcommand{\what}{\widehat{\wvec}}\) \(\newcommand{\Sighat}{\widehat{\Sigma}}\) \(\newcommand{\lt}{<}\) \(\newcommand{\gt}{>}\) \(\newcommand{\amp}{&}\) \(\definecolor{fillinmathshade}{gray}{0.9}\)Our first step is to explain what a function of more than one variable is, starting with functions of two independent variables. This step includes identifying the domain and range of such functions and learning how to graph them. We also examine ways to relate the graphs of functions in three dimensions to graphs of more familiar planar functions.
Functions of Two Variables
The definition of a function of two variables is very similar to the definition for a function of one variable. The main difference is that, instead of mapping values of one variable to values of another variable, we map ordered pairs of variables to another variable.
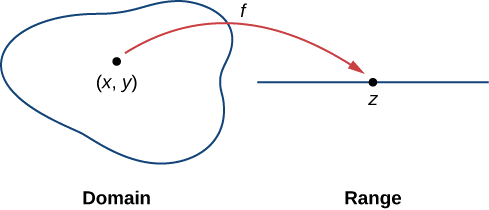
A function of two variables \(z=f(x,y)\) maps each ordered pair \((x,y)\) in a subset \(D\) of the real plane \(\rm I\!R^2\) to a unique real number \(z\). The set \(D\) is called the domain of the function. The range of \(f\) is the set of all real numbers \(z\) that has at least one ordered pair \((x,y)∈D\) such that \(f(x,y)=z\) as shown in Figure \(\PageIndex{1}\).
Determining the domain of a function of two variables involves taking into account any domain restrictions that may exist. Let’s take a look.
Example \(\PageIndex{1}\): Domains and Ranges for Functions of Two Variables
Find the domain and range of each of the following functions:
- \(f(x,y)=3x+5y+2\)
- \(g(x,y)=\sqrt{9−x^2−y^2}\)
Solution
a. This is an example of a linear function in two variables. There are no values or combinations of \(x\) and \(y\) that cause \(f(x,y)\) to be undefined, so the domain of \(f\) is \(\rm I\!R^2\). Written in set-builder notation, this could be written as, \(\{ (x, y) | x \in \rm I\!R, y \in \rm I\!R \}\).
To determine the range, first pick a value for z. We need to find a solution to the equation \(f(x,y)=z,\) or \(3x−5y+2=z.\) One such solution can be obtained by first setting \(y=0\), which yields the equation \(3x+2=z\). The solution to this equation is \(x=\dfrac{z−2}{3}\), which gives the ordered pair \(\left(\dfrac{z−2}{3},0\right)\) as a solution to the equation \(f(x,y)=z\) for any value of \(z\). Therefore, the range of the function is all real numbers, or \((-\infty, \infty)\).
b. For the function \(g(x,y)\) to have a real value, the quantity under the square root must be nonnegative:
\[ 9−x^2−y^2≥0. \nonumber\]
This inequality can be written in the form
\[ x^2+y^2≤9. \nonumber\]
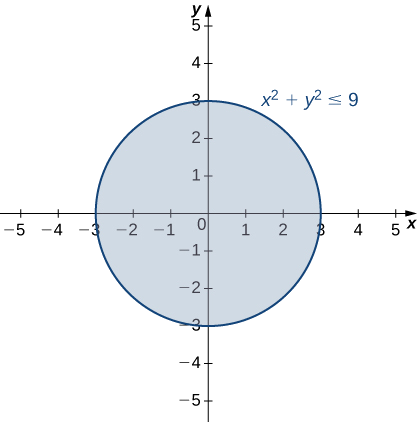
Therefore, the domain of \(g(x,y)\) is \(\{(x,y)∈R^2∣x^2+y^2≤9\}\). The graph of this set of points can be described as a disk of radius 3 centered at the origin. The domain includes the boundary circle as shown in the following graph.
To determine the range of \(g(x,y)=\sqrt{9−x^2−y^2}\) we start with a point \((x_0,y_0)\) on the boundary of the domain, which is defined by the relation \(x^2+y^2=9\). It follows that \(x^2_0+y^2_0=9\) and
\[ \begin{align*} g(x_0,y_0) &=\sqrt{9−x^2_0−y^2_0} \\[5pt]&=\sqrt{9−(x^2_0+y^2_0)}\\[5pt]&=\sqrt{9−9}\\[5pt]&=0. \end{align*}\]
If \(x_0^2+y_0^2=0\) (in other words, \(x_0=y_0=0)\), then
\[ \begin{align*} g(x_0,y_0)&=\sqrt{9−x^2_0−y^2_0}\\[5pt]&=\sqrt{9−(x^2_0+y^2_0)}\\[5pt]&=\sqrt{9−0}=3. \end{align*}\]
This is the maximum value of the function. Given any value \(c\) between \(0\) and \(3\), we can find an entire set of points inside the domain of \(g\) such that \(g(x,y)=c:\)
\[\begin{align*} \sqrt{9−x^2−y^2}&=c \\[5pt] 9−x^2−y^2&=c^2 \\[5pt] x^2+y^2&=9−c^2. \end{align*}\]
Since \(9−c^2>0\), this describes a circle of radius \(\sqrt{9−c^2}\) centered at the origin. Any point on this circle satisfies the equation \(g(x,y)=c\). Therefore, the range of this function can be written in interval notation as \([0,3].\)
Exercise \(\PageIndex{1}\)
Find the domain and range of the function \(f(x,y)=\sqrt{36−9x^2−9y^2}\).
- Hint
-
Determine the set of ordered pairs that do not make the radicand negative.
- Solution
-
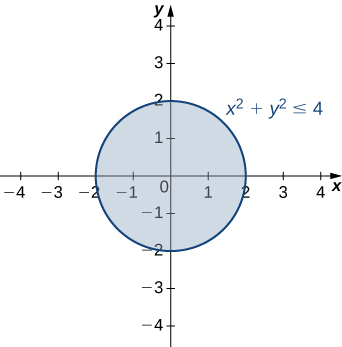
The domain is \(\{(x, y) | x^2+y^2≤4 \}\) the shaded circle defined by the inequality \(x^2+y^2≤4\), which has a circle of radius \(2\) as its boundary. The range is \([0,6].\)
Graphing Functions of Two Variables
Suppose we wish to graph the function \(z=f(x,y).\) This function has two independent variables (\(x\) and \(y\)) and one dependent variable \((z)\). When graphing a function \(y=f(x)\) of one variable, we use the Cartesian plane. We are able to graph any ordered pair \((x,y)\) in the plane, and every point in the plane has an ordered pair \((x,y)\) associated with it. With a function of two variables, each ordered pair \((x,y)\) in the domain of the function is mapped to a real number \(z\). Therefore, the graph of the function \(f\) consists of ordered triples \((x,y,z)\). The graph of a function \(z=f(x,y)\) of two variables is called a surface.
To understand more completely the concept of plotting a set of ordered triples to obtain a surface in three-dimensional space, imagine the \((x,y)\) coordinate system laying flat. Then, every point in the domain of the function f has a unique \(z\)-value associated with it. If \(z\) is positive, then the graphed point is located above the \(xy\)-plane, if \(z\) is negative, then the graphed point is located below the \(xy\)-plane. The set of all the graphed points becomes the two-dimensional surface that is the graph of the function \(f\).
Example \(\PageIndex{2}\): Graphing Functions of Two Variables
Create a graph of each of the following functions:
- \(g(x,y)=\sqrt{9−x^2−y^2}\)
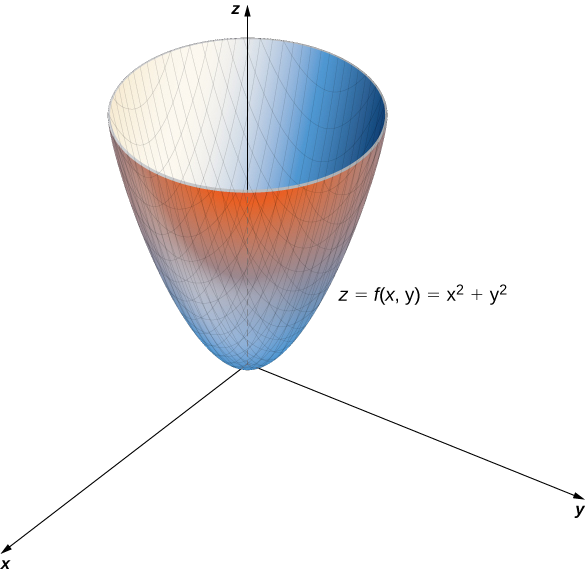
- \(f(x,y)=x^2+y^2\)
Solution
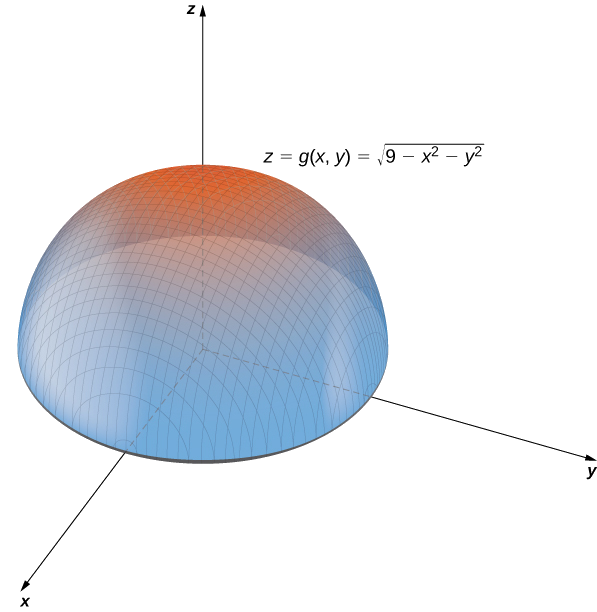
a. In Example \(\PageIndex{2}\), we determined that the domain of \(g(x,y)=\sqrt{9−x^2−y^2}\) is \(\{(x,y)∈R^2∣x^2+y^2≤9\}\) and the range is \(\{z∈R^2∣0≤z≤3\}\). When \(x^2+y^2=9\) we have \(g(x,y)=0\). Therefore any point on the circle of radius \(3\) centered at the origin in the \(xy\)-plane maps to \(z=0\) in \(R^3\). If \(x^2+y^2=8\), then \(g(x,y)=1,\) so any point on the circle of radius \(2\sqrt{2}\) centered at the origin in the \(xy\)-plane maps to \(z=1\) in \(R^3\). As \(x^2+y^2\) gets closer to zero, the value of \(z\) approaches \(3\). When \(x^2+y^2=0\), then \(g(x,y)=3\). This is the origin in the \(xy\)-plane If \(x^2+y^2\) is equal to any other value between \(0\) and \(9\), then \(g(x,y)\) equals some other constant between \(0\) and \(3\). The surface described by this function is a hemisphere centered at the origin with radius \(3\) as shown in the following graph.
b. This function also contains the expression \(x^2+y^2\). Setting this expression equal to various values starting at zero, we obtain circles of increasing radius. The minimum value of \(f(x,y)=x^2+y^2\) is zero (attained when \(x=y=0.\). When \(x=0\), the function becomes \(z=y^2\), and when \(y=0\), then the function becomes \(z=x^2\). These are cross-sections of the graph, and are parabolas. Recall from Introduction to Vectors in Space that the name of the graph of \(f(x,y)=x^2+y^2\) is a paraboloid. The graph of \(f\) appears in the following graph.
Example \(\PageIndex{3}\): Nuts and Bolts
A profit function for a hardware manufacturer is given by
\[f(x,y)=16−(x−3)^2−(y−2)^2, \nonumber\]
where \(x\) is the number of nuts sold per month (measured in thousands) and \(y\) represents the number of bolts sold per month (measured in thousands). Profit is measured in thousands of dollars. Sketch a graph of this function.
Solution
This function is a polynomial function in two variables. The domain of \(f\) consists of \((x,y)\) coordinate pairs that yield a nonnegative profit:
\[ \begin{align*} 16−(x−3)^2−(y−2)^2 &≥ 0 \\[5pt] (x−3)^2+(y−2)^2 &≤ 16. \end{align*}\]
This is a disk of radius \(4\) centered at \((3,2)\). A further restriction is that both \(x\) and \(y\) must be nonnegative. When \(x=3\) and \(y=2, \quad f(x,y)=16.\) Note that it is possible for either value to be a noninteger; for example, it is possible to sell \(2.5\) thousand nuts in a month. The domain, therefore, contains thousands of points, so we can consider all points within the disk. For any \(z<16\), we can solve the equation \(f(x,y)=16:\)
\[ \begin{align*} 16−(x−3)^2−(y−2)^2 &=z \\[5pt] (x−3)^2+(y−2)^2 &=16−z. \end{align*}\]
Since \(z<16,\) we know that \(16−z>0,\) so the previous equation describes a circle with radius \(\sqrt{16−z}\) centered at the point \((3,2)\). Therefore. the range of \(f(x,y)\) is \(\{z∈\mathbb{R}|z≤16\}.\) The graph of \(f(x,y)\) is also a paraboloid, and this paraboloid points downward as shown.

Level Curves
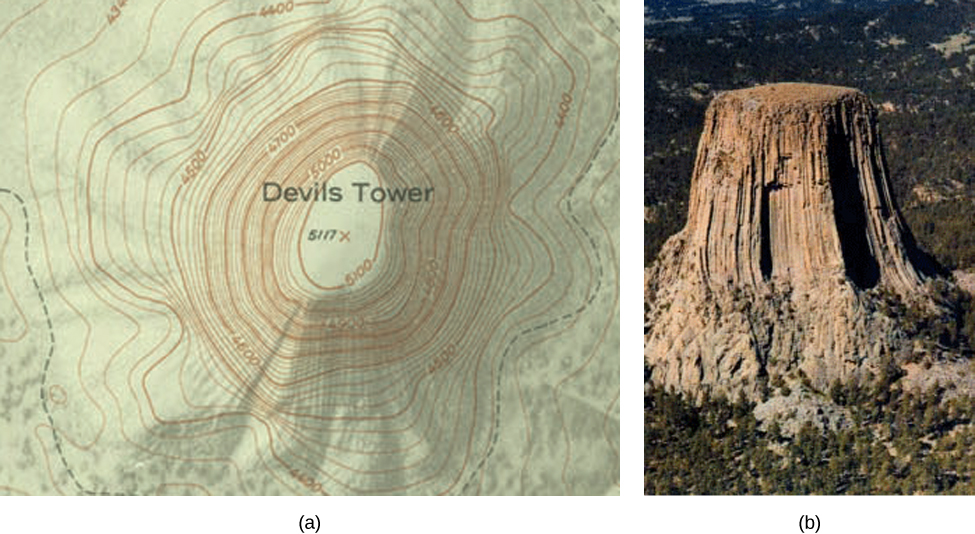
If hikers walk along rugged trails, they might use a topographical map that shows how steeply the trails change. A topographical map contains curved lines called contour lines. Each contour line corresponds to the points on the map that have equal elevation (Figure \(\PageIndex{6}\)). A level curve of a function of two variables \(f(x,y)\) is completely analogous to a contour line on a topographical map.
Given a function \(f(x,y)\) and a number \(c\) in the range of \(f\), a level curve of a function of two variables for the value \(c\) is defined to be the set of points satisfying the equation \(f(x,y)=c.\)
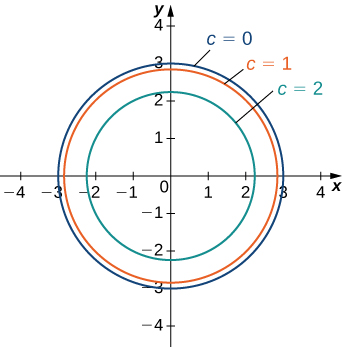
Returning to the function \(g(x,y)=\sqrt{9−x^2−y^2}\), we can determine the level curves of this function. The range of \(g\) is the closed interval \([0,3]\). First, we choose any number in this closed interval—say, \(c=2\). The level curve corresponding to \(c=2\) is described by the equation
\[ \sqrt{9−x^2−y^2}=2.\]
To simplify, square both sides of this equation:
\[ 9−x^2−y^2=4.\]
Now, multiply both sides of the equation by \(−1\) and add \(9\) to each side:
\[ x^2+y^2=5.\]
This equation describes a circle centered at the origin with radius \(\sqrt{5}\). Using values of \(c\) between \(0\) and \(3\) yields other circles also centered at the origin. If \(c=3\), then the circle has radius \(0\), so it consists solely of the origin. Figure \(\PageIndex{7}\) is a graph of the level curves of this function corresponding to \(c=0,1,2,\) and \(3\). Note that in the previous derivation it may be possible that we introduced extra solutions by squaring both sides. This is not the case here because the range of the square root function is nonnegative.
A graph of the various level curves of a function is called a contour map.
Example \(\PageIndex{4}\): Making a Contour Map
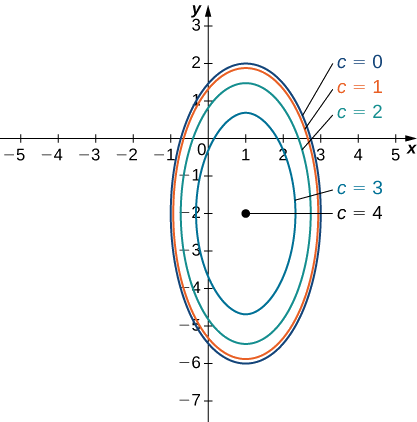
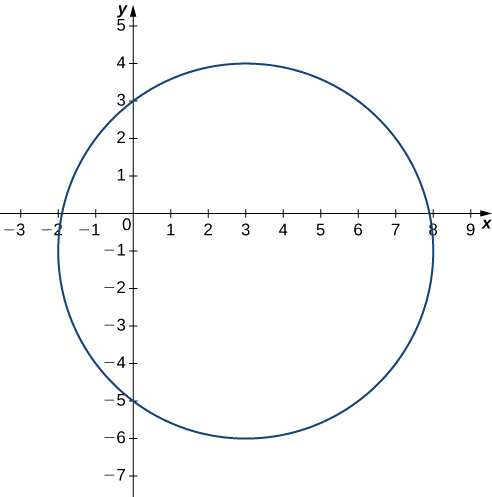
Given the function \(f(x,y)=\sqrt{8+8x−4y−4x^2−y^2}\), find the level curve corresponding to \(c=0\). Then create a contour map for this function. What are the domain and range of \(f\)?
Solution
To find the level curve for \(c=0,\) we set \(f(x,y)=0\) and solve. This gives
\(0=\sqrt{8+8x−4y−4x^2−y^2}\).
We then square both sides and multiply both sides of the equation by \(−1\):
\(4x^2+y^2−8x+4y−8=0.\)
Now, we rearrange the terms, putting the \(x\) terms together and the \(y\) terms together, and add \(8\) to each side:
\(4x^2−8x+y^2+4y=8.\)
Next, we group the pairs of terms containing the same variable in parentheses, and factor \(4\) from the first pair:
\(4(x^2−2x)+(y^2+4y)=8.\)
Then we complete the square in each pair of parentheses and add the correct value to the right-hand side:
\(4(x^2−2x+1)+(y^2+4y+4)=8+4(1)+4.\)
Next, we factor the left-hand side and simplify the right-hand side:
\(4(x−1)^2+(y+2)^2=16.\)
Last, we divide both sides by \(16\):
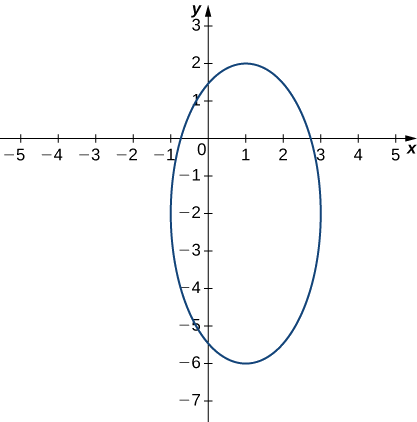
\[\dfrac{(x−1)^2}{4}+\dfrac{(y+2)^2}{16}=1. \label{ellipseeq1}\]
This equation describes an ellipse centered at \((1,−2)\). The graph of this ellipse appears in the following graph.
We can repeat the same derivation for values of \(c\) less than \(4.\) Then, Equation \ref{ellipseeq1} becomes
\(\dfrac{4(x−1)^2}{16−c^2}+\dfrac{(y+2)^2}{16−c^2}=1\)
for an arbitrary value of \(c\).
Setting the function equal to \(c\), we get:
\[\sqrt{8+8x−4y−4x^2−y^2} = c\nonumber\]
We then square both sides and multiply both sides of the equation by \(−1\):
\(4x^2+y^2−8x+4y−8=-c^2.\)
Now, we rearrange the terms, putting the \(x\) terms together and the \(y\) terms together, and add \(8\) to each side:
\(4x^2−8x+y^2+4y=8-c^2.\)
Next, we group the pairs of terms containing the same variable in parentheses, and factor \(4\) from the first pair:
\(4(x^2−2x)+(y^2+4y)=8-c^2.\)
Then we complete the square in each pair of parentheses and add the correct value to the right-hand side:
\(4(x^2−2x+1)+(y^2+4y+4)=8 - c^2 +4(1)+4.\)
Next, we factor the left-hand side and simplify the right-hand side:
\(4(x−1)^2+(y+2)^2=16 - c^2.\)
Last, we divide both sides by \(16 - c^2\):
\[\dfrac{4(x−1)^2}{16−c^2}+\dfrac{(y+2)^2}{16−c^2}=1 \nonumber\]
Figure \(\PageIndex{9}\) shows a contour map for \(f(x,y)\) using the values \(c=0,1,2,\) and \(3\). When \(c=4,\) the level curve is the point \((−1,2)\).
Finding the Domain & Range
Since this is a square root function, the radicand must not be negative. So we have
\[8+8x−4y−4x^2−y^2\ge 0 \nonumber\]
Recognizing that the boundary of the domain is an ellipse, we repeat the steps we showed above to obtain
\[\dfrac{(x−1)^2}{4}+\dfrac{(y+2)^2}{16}\le 1 \nonumber\]
So the domain of \(f\) can be written: \(\big\{ (x,y) \,|\, \frac{(x−1)^2}{4}+\frac{(y+2)^2}{16}\le 1 \big\}.\)
To find the range of \(f,\) we need to consider the possible outputs of this square root function. We know the output cannot be negative, so we need to next check if its output is ever \(0.\) From the work we completed above to find the level curve for \(c = 0,\) we know the value of \(f\) is \(0\) for any point on that level curve (on the ellipse, \(\frac{(x−1)^2}{4}+\frac{(y+2)^2}{16}=1\)). So we know the lower bound of the range of this function is \(0.\)
To determine the upper bound for the range of the function in this problem, it's easier if we first complete the square under the radical.
\[\begin{align*} f(x,y) &= \sqrt{8+8x−4y−4x^2−y^2} \\[5pt]
&= \sqrt{8 - 4(x^2 - 2x \quad) - (y^2 + 4y \quad)}\\[5pt]
&= \sqrt{8 - 4(x^2 - 2x +1 - 1) - (y^2 + 4y + 4 - 4)}\\[5pt]
&= \sqrt{8 - 4(x^2 - 2x +1) + 4 - (y^2 + 4y + 4) +4}\\[5pt]
&= \sqrt{16 - 4(x-1)^2 - (y+2)^2} \end{align*}\]
Now that we have \(f\) in this form, we can see how large the radicand can be. Since we are subtracting two perfect squares from \(16,\) we know that the value of the radicand cannot be greater than \(16.\) At the point \((1, -2),\) we can see the radicand will be 16 (since we will be subtracting \(0\) from \(16\) at this point. This gives us the maximum value of \(f\), that is \(f(1, -2) = \sqrt{16} = 4.\)
So the range of this function is \([0, 4].\)
Exercise \(\PageIndex{2}\)
Find and graph the level curve of the function \(g(x,y)=x^2+y^2−6x+2y\) corresponding to \(c=15.\)
- Hint
-
First, set \(g(x,y)=15\) and then complete the square.
- Solution
-
The equation of the level curve can be written as \((x−3)^2+(y+1)^2=25,\) which is a circle with radius \(5\) centered at \((3,−1).\)
Another useful tool for understanding the graph of a function of two variables is called a vertical trace. Level curves are always graphed in the \(xy\)-plane, but as their name implies, vertical traces are graphed in the \(xz-\) or \(yz-\) planes.
Consider a function \(z=f(x,y)\) with domain \(D⊆\rm I\!R^2\). A vertical trace of the function can be either the set of points that solves the equation \(f(a,y)=z\) for a given constant \(x=a\) or \(f(x,b)=z\) for a given constant \(y=b.\)
Example \(\PageIndex{5}\): Finding Vertical Traces
Find vertical traces for the function \(f(x,y)=\sin x \cos y\) corresponding to \(x=−\dfrac{π}{4},0,\) and \(\dfrac{π}{4}\), and \(y=−\dfrac{π}{4},0\), and \(\dfrac{π}{4}\).
Solution
First set \(x=−\dfrac{π}{4}\) in the equation \(z=\sin x \cos y:\)
\(z=\sin\left(−\dfrac{π}{4}\right)\cos y=−\dfrac{\sqrt{2}\cos y}{2}≈−0.7071\cos y.\)
This describes a cosine graph in the plane \(x=−\dfrac{π}{4}\). The other values of \(z\) appear in the following table.
| \(c\) | Vertical Trace for \(x=c\) |
|---|---|
| \(−\dfrac{π}{4}\) | \(z=−\dfrac{\sqrt{2}\cos y}{2}\) |
| 0 | \(z=0\) |
| \(\dfrac{π}{4}\) | \(z=\dfrac{\sqrt{2}\cos y}{2}\) |
In a similar fashion, we can substitute the \(y\)-values in the equation \(f(x,y)\) to obtain the traces in the \(yz\)-plane, as listed in the following table.
| \(d\) | Vertical Trace for \(y=d\) |
|---|---|
| \(\dfrac{π}{4}\) | \(z=\dfrac{\sqrt{2}\sin x}{2}\) |
| 0 | \(z=\sin x\) |
| \(−\dfrac{π}{4}\) | \(z=\dfrac{\sqrt{2}\sin x}{2}\) |
The three traces in the \(xz\)-plane are cosine functions; the three traces in the \(yz\)-plane are sine functions. These curves appear in the intersections of the surface with the planes \(x=−\dfrac{π}{4},\quad x=0,\quad x=\dfrac{π}{4}\) and \(y=−\dfrac{π}{4},\quad y=0,\quad y=\dfrac{π}{4}\) as shown in the following figure.

Exercise \(\PageIndex{3}\)
Determine the equation of the vertical trace of the function \(g(x,y)=−x^2−y^2+2x+4y−1\) corresponding to \(y=3\), and describe its graph.
- Hint
-
Set \(y=3\) in the equation \(z=−x^2−y^2+2x+4y−1\) and complete the square.
- Solution
-
\(z=3−(x−1)^2\). This function describes a parabola opening downward in the plane \(y=3\).
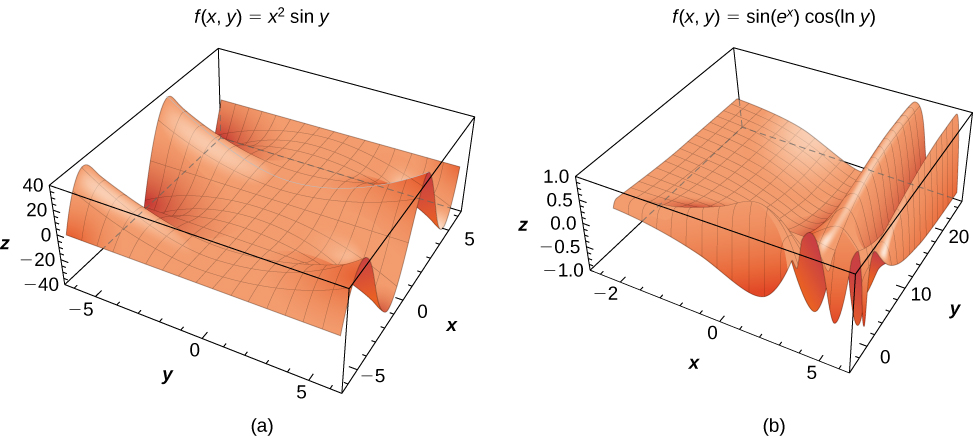
Functions of two variables can produce some striking-looking surfaces. Figure \(\PageIndex{11}\) shows two examples.
Functions of More Than Two Variables
So far, we have examined only functions of two variables. However, it is useful to take a brief look at functions of more than two variables. Two such examples are
\[ \underbrace{f(x,y,z)=x^2−2xy+y^2+3yz−z^2+4x−2y+3x−6}_{\text{a polynomial in three variables}}\]
and
\[g(x,y,t)=(x^2−4xy+y^2)\sin t−(3x+5y)\cos t.\]
In the first function, \((x,y,z)\) represents a point in space, and the function \(f\) maps each point in space to a fourth quantity, such as temperature or wind speed. In the second function, \((x,y)\) can represent a point in the plane, and \(t\) can represent time. The function might map a point in the plane to a third quantity (for example, pressure) at a given time \(t\). The method for finding the domain of a function of more than two variables is analogous to the method for functions of one or two variables.
Example \(\PageIndex{6}\): Domains for Functions of Three Variables
Find the domain of each of the following functions:
- \(f(x,y,z)=\dfrac{3x−4y+2z}{\sqrt{9−x^2−y^2−z^2}}\)
- \(g(x,y,t)=\dfrac{\sqrt{2t−4}}{x^2−y^2}\)
Solution:
a. For the function \(f(x,y,z)=\dfrac{3x−4y+2z}{\sqrt{9−x^2−y^2−z^2}}\) to be defined (and be a real value), two conditions must hold:
- The denominator cannot be zero.
- The radicand cannot be negative.
Combining these conditions leads to the inequality
\[9−x^2−y^2−z^2>0.\nonumber\]
Moving the variables to the other side and reversing the inequality gives the domain as
\[domain(f)=\{(x,y,z)∈R^3∣x^2+y^2+z^2<9\},\nonumber\]
which describes a ball of radius \(3\) centered at the origin. (Note: The surface of the ball is not included in this domain.)
b. For the function \(g(x,y,t)=\dfrac{\sqrt{2t−4}}{x^2−y^2}\) to be defined (and be a real value), two conditions must hold:
- The radicand cannot be negative.
- The denominator cannot be zero.
Since the radicand cannot be negative, this implies \(2t−4≥0\), and therefore that \(t≥2\). Since the denominator cannot be zero, \(x^2−y^2≠0\), or \(x^2≠y^2\), Which can be rewritten as \(y=±x\), which are the equations of two lines passing through the origin. Therefore, the domain of \(g\) is
\[ domain(g)=\{(x,y,t)|y≠±x,t≥2\}. \nonumber\]
Exercise \(\PageIndex{4}\)
Find the domain of the function \(h(x,y,t)=(3t−6)\sqrt{y−4x^2+4}\).
- Hint
-
Check for values that make radicands negative or denominators equal to zero.
- Solution
-
\[domain(h)=\{(x,y,t)\in \mathbb{R}^3∣y≥4x^2−4\} \nonumber\]
Functions of two variables have level curves, which are shown as curves in the \(xy-plane.\) However, when the function has three variables, the curves become surfaces, so we can define level surfaces for functions of three variables.
Given a function \(f(x,y,z)\) and a number \(c\) in the range of \(f\), a level surface of a function of three variables is defined to be the set of points satisfying the equation \(f(x,y,z)=c.\)
Example \(\PageIndex{7}\): Finding a Level Surface
Find the level surface for the function \(f(x,y,z)=4x^2+9y^2−z^2\) corresponding to \(c=1\).
Solution
The level surface is defined by the equation \(4x^2+9y^2−z^2=1.\) This equation describes a hyperboloid of one sheet as shown in Figure \(\PageIndex{12}\).

Exercise \(\PageIndex{5}\)
Find the equation of the level surface of the function
\[ g(x,y,z)=x^2+y^2+z^2−2x+4y−6z \nonumber\]
corresponding to \(c=2,\) and describe the surface, if possible.
- Hint
-
Set \(g(x,y,z)=c\) and complete the square.
- Solution
-
\((x−1)^2+(y+2)^2+(z−3)^2=16\) describes a sphere of radius \(4\) centered at the point \((1,−2,3).\)
Summary
- The graph of a function of two variables is a surface in \(\mathbb{R}^3\) and can be studied using level curves and vertical traces.
- A set of level curves is called a contour map.
Key Equations
- Vertical trace
\(f(a,y)=z\) for \(x=a\) or \(f(x,b)=z\) for \(y=b\)
- Level surface of a function of three variables
\(f(x,y,z)=c\)
Glossary
- contour map
- a plot of the various level curves of a given function \(f(x,y)\)
- function of two variables
- a function \(z=f(x,y)\) that maps each ordered pair \((x,y)\) in a subset \(D\) of \(R^2\) to a unique real number \(z\)
- graph of a function of two variables
- a set of ordered triples \((x,y,z)\) that satisfies the equation \(z=f(x,y)\) plotted in three-dimensional Cartesian space
- level curve of a function of two variables
- the set of points satisfying the equation \(f(x,y)=c\) for some real number \(c\) in the range of \(f\)
- level surface of a function of three variables
- the set of points satisfying the equation \(f(x,y,z)=c\) for some real number \(c\) in the range of \(f\)
- surface
- the graph of a function of two variables, \(z=f(x,y)\)
- vertical trace
- the set of ordered triples \((c,y,z)\) that solves the equation \(f(c,y)=z\) for a given constant \(x=c\) or the set of ordered triples \((x,d,z)\) that solves the equation \(f(x,d)=z\) for a given constant \(y=d\)
Contributors
Gilbert Strang (MIT) and Edwin “Jed” Herman (Harvey Mudd) with many contributing authors. This content by OpenStax is licensed with a CC-BY-SA-NC 4.0 license. Download for free at http://cnx.org.